

Earnings Expectation Life Cycle
In our relentless pursuit of understanding market dynamics, we gather and dissect an extensive range of earnings and sentiment data. Our aim is to identify patterns and trends that influence stock prices, both in the immediate term and over the long run, even if some promising leads may not currently be in play. Our strategic journey of deciphering stock performance was launched with a sole focus on analyzing earnings and sentiment data. In the quest to unearth commonalities among stocks that either outperform or lag behind the market, we unwittingly stumbled upon an intriguing alignment with Richard Bernstein's Earnings Expectation Life Cycle.
Richard Bernstein is the CEO and Chief Investment Officer of Richard Bernstein Advisors LLC, a firm he founded in 2009. The firm provides investment advice and portfolio management to both institutional and individual clients, but before that he had long career at Merrill Lynch, of more than 20 years. His roles at Merrill Lynch included being the firm's Chief Investment Strategist and Head of the Investment Strategy Group. Bernstein is known for his expertise in earnings quality analysis and it was his 1995 book "Style Investing: Unique Insight into Equity Management" where he introduced the Earnings Expectation Life Cycle (though it was actually something he published years earlier at Merrill Lynch).
Richard Bernstein's Earnings Expectation Life Cycle is a theory that illustrates the cyclical nature of a company's earnings expectations and its impact on stock performance. The cycle comprises four distinct phases: Value Traps, Earnings Momentum, Positive Earnings Surprises, and Negative Earnings Surprises. 'Value Traps' refer to stocks that may appear cheap, but their earnings estimates are in decline. 'Earnings Momentum' describes stocks whose earnings estimates are trending upwards, often resulting in price appreciation. 'Positive Earnings Surprises' represent companies that report earnings exceeding market expectations, while 'Negative Earnings Surprises' involve companies whose earnings fall short of these expectations. This cycle aids in understanding and predicting the market sentiment and potential investment opportunities based on a company's position within the cycle.
Value Traps
A value trap is a stock that appears cheap or undervalued because it has a low price-to-earnings ratio (P/E), but really isn’t because the denominator in the equation – the earnings – are declining. Value traps are the bottom of the cycle and it tends to come when investors are the most pessimistic in the stock. The contrarian investor and the value investor will typically look to buy these stocks, but the trends can often last longer than expected and values traps lag the overall stock market.
We begin with Value Traps because they closely mirror Stan Weinstein's Stage I stocks. Indeed, there is a significant amount of commonality between these two theoretical approaches. Both theories segment a stock's lifecycle into four stages of momentum. However, Weinstein tends to concentrate more on the market's technical aspects, while Bernstein shifts his focus towards understanding the fundamentals and their influence on investor sentiment.
Stan Weinstein, a famous market technician, introduced the idea of four stages of a stock's lifecycle in his book "Secrets for Profiting in Bull and Bear Markets." Stage I, also known as the "basing" stage, is where a stock may appear stagnant, but is building a solid foundation for future growth. This stage shares similarities with the concept of Value Traps.
The critical lesson from these theories is that while Value Traps may seem like secure, bargain investments, their true nature can be deceptive. You might spot one just as it transitions into the next phase of its life cycle, poised for a potential upward move. However, the timing of this transition remains uncertain. As famously stated by economist John Maynard Keynes, "the market can stay irrational longer than you can stay solvent." Consequently, Value Traps often underperform the broader stock market for an extended period. Indeed, as the name implies, the allure of their low valuation can entrap you, locking you into a stock that underperforms.
Value Traps typically exhibit two main characteristics: The first is a low investor sentiment, which signifies a dwindling interest or confidence in the stock. The second characteristic is a downward trend in the company's earnings estimates, indicating weakening fundamentals.
In fact, despite their lower valuations, among the four stock groups, Value Traps performed the poorest from the beginning of 2002 until the end of 2022. By our definition, characterized by bearish investor sentiment and declining earnings estimates, Value Traps averaged a decline of 0.12% per quarter. This is calculated by purchasing at the opening price following the earnings announcement and selling at the closing price just prior to the next earnings release. Moreover, these stocks showed a decrease in value 59% of the time.
For instance, consider the case of Amedisys (AMED). It reached a significant cycle peak in early 2021, right before investor sentiment hit its peak. The estimates continued to trend downwards until the sentiment finally shifted to bearish at the start of 2022. On February 23, 2022, the company failed to meet expectations and reduced its future earnings projections. Consequently, the stock experienced a gap down on this news, followed by a robust short-term uptrend. However, those investors who bought during this rally ended up stuck with a stock that underperformed.
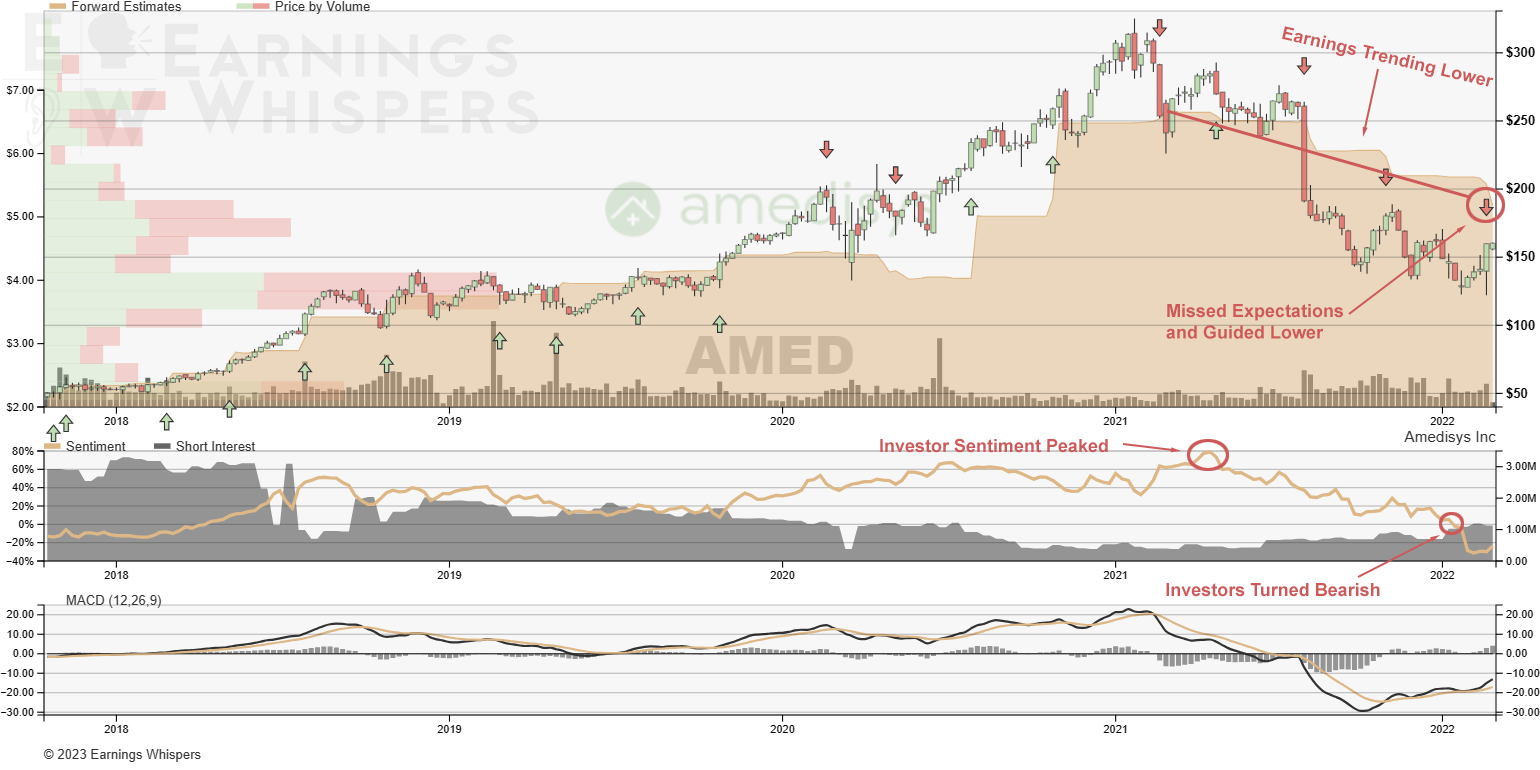
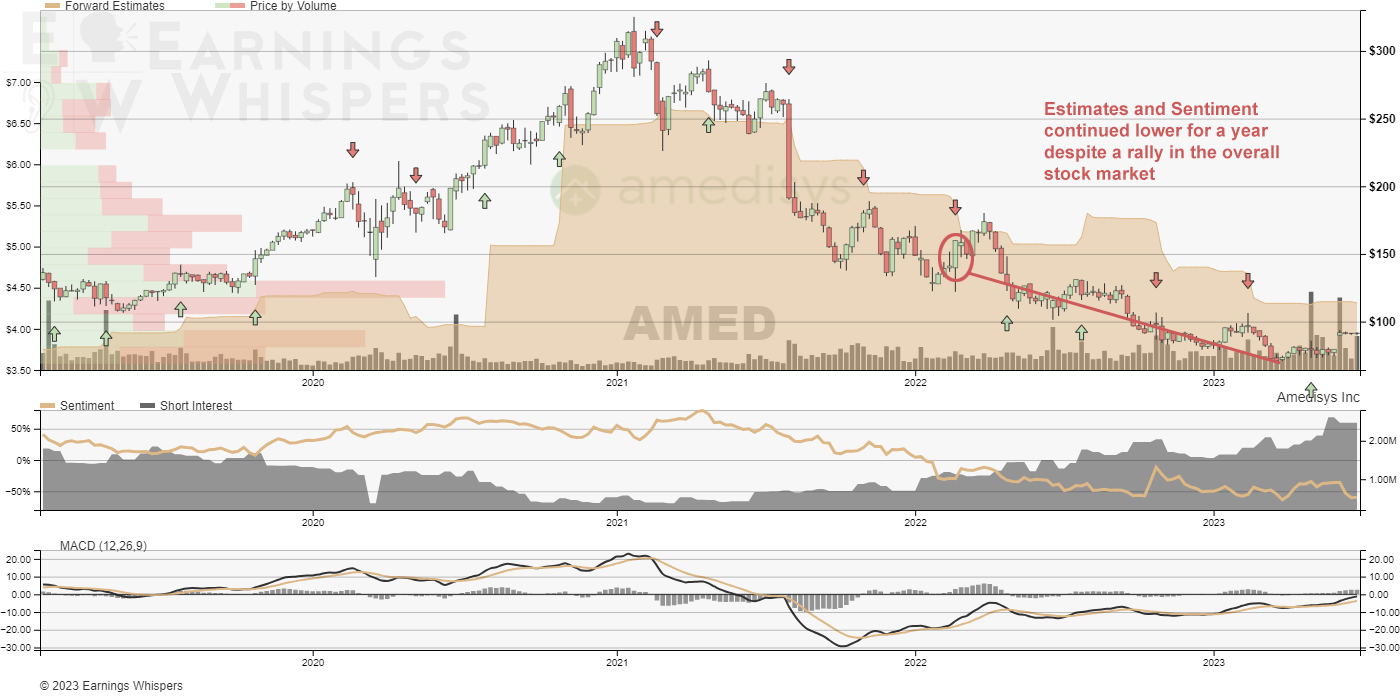
In the following year, even though the broader stock market managed to recover from its low point and staged a strong rally, Amedisys shares continued their descent. This downward trend was fueled by persistently lower earnings and decreasing investor sentiment. A little over a year later, the stock was trading approximately 45% lower than the point it had gapped down in February 2022.
Therefore, Value Traps represent what may initially seem to be low-priced, attractive investments, but the reality is often different and investors should approach such stocks with caution. While seeking value is a key part of investing, it's equally important to avoid these traps, as they can lead to significant underperformance and potential financial losses. It is much better to wait for a stock to move into the next phase of the Earnings Expectation Life Cycle
Positive Earnings Surprise Phase
- the foundations for Stage II Breakouts
The phenomenon known as the Post-earnings Announcement Drift (PEAD) was first introduced to us by Ray Ball and Philip Brown in 1968. However, it wasn't until over a decade later that EJ Elton, Martin Gruber, and Mustafa Gultekin shed light on its true nature. They suggested that PEAD is less about forecasting actual earnings and more concerned with shifts in investor expectations. The transition of stocks from Value Traps to the Positive Earnings Surprise Phase in the Earnings Expectation Life Cycle typically marks the point at which investor expectations begin to improve. Rather than being tied to a single event or earnings release, this transition is often a gradual process.
As articulated by Mr. Bernstein, "eventually a low-expectations company begins to disseminate more optimistic information [and] the stock regains investor attention." We define this transition as the Positive Earnings Surprise Phase, which is characterized by an uptick in earnings data despite the prevailing bearish investor sentiment, resulting in upward revisions to estimates. In comparison to stocks with bearish sentiment and downward-trending earnings that see a decline 59% of the time over a quarter, stocks with bearish sentiment coupled with upward-trending estimates witness a rise 56% of the time during the same period.
Larry Kudlow is often quoted saying, "earnings are the mother's milk of stock prices." However, as previously pointed out, it's the anticipation of future earnings, rather than the earnings themselves, that significantly influence stock prices. This shift in expectations usually happens when a company with low sentiment unexpectedly reports robust results. But it's important to note that there are numerous factors, not all of them company-specific, that can raise expectations for future earnings. The ultimate aim is to invest in stocks experiencing a rise in sentiment rather than just an increase in earnings. Generally, one doesn't persist without the other though.
Ideally, this phase correlates with what Weinstein described as Stage II, or the 'advance phase' of the stock's life cycle, where the primary trend is upwards. This stage signifies a move from a baseline, characterized by low investor sentiment, ideally accompanied by increased trading volume and a rise above its long-term moving average (Weinstein used a 180-day moving average). Crucially, during this stage, both fundamental and technical indicators should be on an upward trajectory.
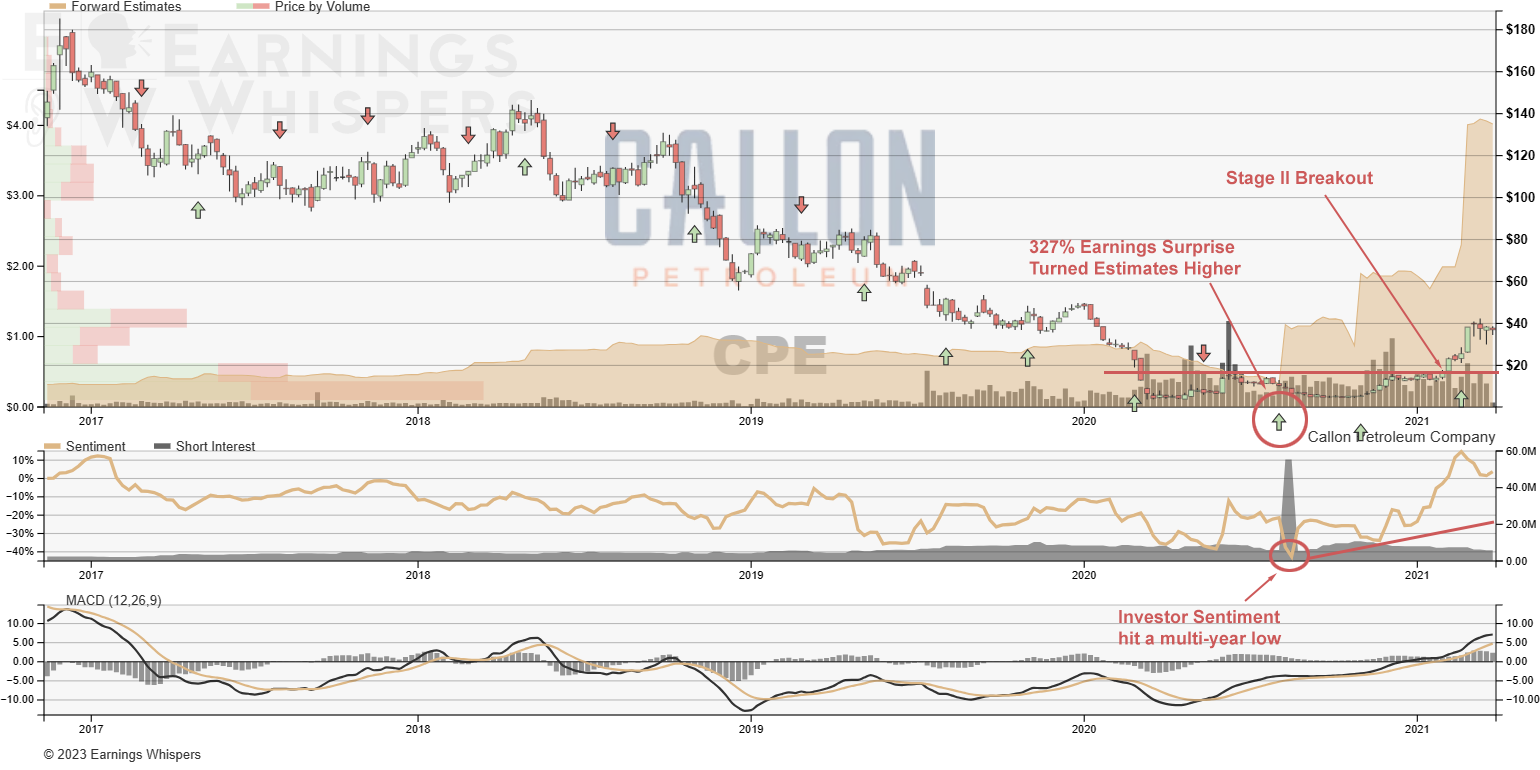
The late 2020 and early 2021 performance of many Energy stocks offers quintessential illustrations of this transition. One of our top picks at that time was Callon Petroleum (CPE), which saw vigorous accumulation under $15 alongside significant trading volume, while the stock price remained stagnant - a clear indicator of a Stage I situation. However, the scenario dramatically shifted when the company exceeded expectations by over 300% just as investor sentiment dropped to a new low. From that point, both earnings and sentiment began to rise, driving the stock from the Value Trap into the Positive Earnings Surprise Phase of the Life Cycle. Despite this, the stock continued its lateral movement until the very end of the year when it finally began breaking out from its base, clearly transitioning into a Stage II stock. Although not depicted in this chart, by mid-2021, Callon Petroleum had seen a 300% surge from its breakout point.
Thus, the Positive Earnings Surprise Phase of the Earnings Expectation Life Cycle is a critical inflection point for a stock, representing a shift from a low-expectation environment to one of improving investor sentiment and increasing earnings estimates. Successful navigation through this phase aligns with Stan Weinstein's Stage II of a stock's lifecycle, which can often signal robust future performance. It's essential for investors to grasp these dynamics to better identify opportunities for profitable investment and avoid potential Value Traps.
Earnings Momentum
Earnings Momentum Stocks - this is where the High Scores reside - the best performing group - long sustained stock moves have bullish sentiment and rising earnings estimates
Negative Earnings Surprise Phase - The Torpedo - Stage IV
Earnings Whisper Grade
Our Life Cycle Indicator