All amounts are in
“Our full year production was lower than planned and costs higher due to a challenging year at our Canadian operations. Despite these challenges, we established a number of new financial records including record free cash flow of
“Collectively, we expect these growth projects to drive a significant improvement into 2026, and sustained low-cost growth over the next five years to approximately one million ounces annually by 2030. All of this growth is in
Fourth Quarter and Full Year 2025 Highlights
Operational and Financial Highlights
- Produced 545,400 ounces of gold in 2025, below revised annual guidance and a 4% decrease from 2024. Lower mining and processing rates at the Canadian operations as a result of severe winter weather, as well as other operational challenges, impacted production late in the year. Fourth quarter production of 141,500 ounces was consistent with the third quarter but below quarterly guidance
The Island Gold District produced 250,400 ounces of gold in 2025 and generated record annual mine-site free cash flow1 of$205.0 million after funding all Phase 3+ Shaft Expansion capital and exploration initiativesYoung -Davidson produced 153,400 ounces of gold in 2025 and generated record mine-site free cash flow of$249.9 million , including a record$89.7 million in the fourth quarterThe Mulatos District produced 141,600 ounces of gold in 2025 and generated strong mine-site free cash flow of$221.5 million , including a record$92.3 million in the fourth quarter- Cost of sales were
$809.5 million or$1,524 per ounce in 2025, and$219.5 million , or$1,544 per ounce in the fourth quarter - Total cash costs1 of
$1,077 per ounce and all-in sustaining costs ("AISC"1) of$1,524 per ounce for the full year were above revised annual guidance. Total cash costs of$1,111 per ounce and AISC of$1,592 per ounce for the fourth quarter were higher than the third quarter and quarterly guidance, driven by lower than planned production from theIsland Gold District andYoung -Davidson - Full year sales totaled 531,230 ounces of gold at an average realized price of
$3,372 per ounce, generating record annual revenues of approximately$1.8 billion , including silver sales, representing a 34% increase from 2024. This included fourth quarter sales of 142,147 ounces of gold at an average realized price of$3,998 per ounce, generating record quarterly revenues of$575.3 million . This represented a 53% increase from the fourth quarter of 2024 and marked the third consecutive quarter of record revenues - Generated record annual cash flow from operating activities of
$795.3 million (including$924.3 million before changes in working capital and taxes paid1, or$2.20 per share1), a 20% increase from 2024. Fourth quarter cash flow from operating activities was$250.9 million (including$284.7 million before changes in working capital and taxes paid, or$0.68 per share) - Generated record annual free cash flow1 of
$351.7 million , including a record$156.9 million in the fourth quarter, while continuing to reinvest in high-return growth projects including the Phase 3+ Shaft Expansion, IGD Expansion to 20,000 tonnes per day ("tpd"),Lynn Lake , PDA, and a record exploration program - Reported net earnings were
$885.8 million in 2025, or$2.11 per share. Adjusted net earnings1 were$587.1 million in 2025, or$1.40 per share1. Adjusted earnings include after-tax adjustments for an impairment reversal and gain on sale of assets of$419.6 million , loss on commodity hedge derivatives of$152.1 million , as well as adjustments for net unrealized foreign exchange gain recorded within deferred taxes and foreign exchange totaling$27.4 million , and other adjustments of$3.8 million - Reported net earnings were
$434.9 million for the fourth quarter, or$1.03 per share. Adjusted net earnings for the fourth quarter were$227.6 million , or$0.54 per share. Adjusted net earnings include after-tax adjustments for a gain on sale of assets of$226.7 million , loss on commodity hedge derivatives of$34.9 million , as well as adjustments for unrealized foreign exchange gain recorded within deferred taxes and foreign exchange totaling$6.0 million , and other adjustments of$9.5 million - Cash and cash equivalents were
$623.1 million atDecember 31, 2025 , up from$463.1 million at the end of the third quarter, and$327.2 million at the end of 2024. This reflects record free cash flow generation, while continuing to reinvest in high-return growth, supporting increased shareholder returns, debt reduction, and the repurchase of hedges. The Company remains well-positioned to internally fund all of its growth initiatives with strong ongoing free cash flow, net cash of$423.1 million , and approximately$1.2 billion of total liquidity - Returned
$80.9 million to shareholders in 2025, nearly double the$41.0 million returned in 2024. This included the repurchase of 1.3 million shares at a cost of$38.8 million , and dividend payments totalling$42.1 million . In addition, the Company announced a 60% increase in the quarterly dividend to$0.04 per share, starting in the first quarter of 2026 - Repaid
$50 million of debt during the fourth quarter, leaving$200 million drawn on the credit facility at the end of 2025 - Eliminated half of the 2026 legacy gold hedges from
Argonaut Gold Inc. ("Argonaut") in the fourth quarter with the repurchase and elimination of all forward sale contracts that were scheduled to mature in the first half of 2026. These contracts totaled 50,000 ounces at an average price of$1,821 per ounce. The cost to eliminate the hedges was$113.5 million , at an effective price of approximately$4,091 per ounce, providing further upside to current gold prices. This was funded by$63.5 million in cash and a gold sale prepayment for$50.0 million in exchange for the delivery of 12,255 ounces in the first half of 2026 at a prepay price of$4,166 per ounce
Mineral Reserves and Resources, Growth Projects and Other Highlights
- Announced the Island Gold District Expansion Study ("IGD Expansion Study") on
February 3, 2026 , outlining a long-life operation that is expected to become one of the largest, lowest-cost, and most profitable gold mines inCanada . Compared to the Base Case Life of Mine Plan (the "Base Case LOM Plan") released inJune 2025 , the IGD Expansion incorporates a 30% increase in Mineral Reserves and an expansion of the Magino mill to 20,000 tpd, driving increased annual production of 534,000 ounces over the initial 10 years (starting in 2028) at average mine-site AISC of$1,025 per ounce. At a gold price of$4,500 per ounce and USD/CAD foreign exchange rate of$0 .74:1, theIsland Gold District has an estimated after-tax net present value ("NPV") (5%) of$12.2 billion , making it one of the most valuable gold mines inCanada - Issued three-year guidance on
February 4, 2026 , with production expected to increase 12% in 2026 to between 570,000 and 650,000 ounces, and 46% by 2028 to between 755,000 and 835,000 ounces. AISC are expected to decrease 18% by 2028 relative to 2025, driven by low-cost growth from theIsland Gold District following the completion of the Phase 3+ Shaft Expansion late in 2026 and the IGD Expansion in 2028. Further growth in production and reduction in costs is expected after the completion of theLynn Lake project in 2029
- Reported year-end 2025 Mineral Reserves of 15.9 million ounces (265 million tonnes ("mt")), a 32% increase from the end of 2024, with grades also increasing 5% to 1.87 grams per tonne (“g/t Au”). The growth was driven by the successful conversion of a large portion of Mineral Resources to Reserves at the
Island Gold District . Measured and Indicated Mineral Resources also increased 6% to 5.5 million ounces (119 mt grading 1.44 g/t Au) driven by additions atYoung -Davidson ,Lynn Lake and Mulatos. Inferred Mineral Resources decreased 63% to 2.0 million ounces (35 mt grading 1.82 g/t Au) reflecting the successful conversion of Mineral Resources at theIsland Gold District to Reserves - Advanced the Phase 3+ Shaft Expansion at the
Island Gold District . This included shaft sink progressing to a depth of 1,350 metres ("m"), or 98% of the ultimate depth, and advancing the paste plant construction. The Phase 3+ Shaft Expansion completion is expected in the fourth quarter of 2026 - Announced an updated development plan for the
Lynn Lake project incorporating the BT and Linkwood deposits, and several scope changes including a 13% increase in mill capacity to 9,000 tpd, driving production higher and stronger economics.Lynn Lake is expected to average 186,000 ounces over its initial 10-years at first quartile mine-site AISC of$829 per ounce. Construction activities are expected to ramp up in the spring of 2026, with initial production expected in the first half of 2029 - Received approval of an amendment to the existing environmental impact assessment (Manifestación de Impacto Ambiental) by Mexico’s Secretariat of Environment and Natural Resources in
January 2025 , allowing for the start of construction on the PDA project within theMulatos District . PDA remains on budget and on schedule for initial production by mid-2027 - Closed the sale of the Company's Turkish development projects, which consist of Kirazli, Agi Dagi and Çamyurt, to Tümad Madencilik Sanayi ve Ticaret A.S (“Tümad”) for total cash consideration of
$470 million inOctober 2025 . Upon closing, Alamos received the first payment of$160 million . The remaining cash payments, totaling$310 million , are expected to be received on the first and second anniversaries of the closing of the transaction - Closed the sale of the option to earn 100% interest in the non-core
Quartz Mountain Gold Project (“Quartz Mountain”), located inOregon , to Q-Gold Resources Ltd. (“Q-Gold”) inOctober 2025 . Quartz Mountain was sold for total consideration of up to$21 million and a 9.9% equity interest in Q-Gold - Alamos was recognized for the second consecutive year as a TSX30TM 2025 winner by the
Toronto Stock Exchange inSeptember 2025 . The annual ranking recognizes the 30 top performing stocks over a three-year period. Alamos’ share price increased 310% over the trailing three-year period
(1) Refer to the “Non-GAAP Measures and Additional GAAP Measures” section at the end of this press release and associated MD&A for a description and calculation of these measures.
Highlight Summary
| Three Months Ended | Years Ended | |||
| 2025 | 2024 | 2025 | 2024 | |
| Financial Results (in millions) | ||||
| Operating revenues | ||||
| Cost of sales(1) | ||||
| Earnings from operations | ||||
| Earnings before income taxes | ||||
| Net earnings | ||||
| Adjusted net earnings(2) | ||||
| Adjusted earnings before interest, taxes, depreciation and amortization(2) | ||||
| Cash provided by operating activities | ||||
| Cash provided by operating activities before changes in working capital and taxes paid(2) | ||||
| Capital expenditures (sustaining)(2) | ||||
| Sustaining finance leases(2)(3) | ||||
| Capital expenditures (growth)(2) | ||||
| Capital expenditures (capitalized exploration) | ||||
| Free cash flow(2)(3) | ||||
| Operating Results | ||||
| Gold production (ounces) | 141,500 | 140,200 | 545,400 | 567,000 |
| Gold sales (ounces) | 142,147 | 141,258 | 531,230 | 560,234 |
| Per Ounce Data | ||||
| Average realized gold price(5) | ||||
| Average spot gold price (London PM Fix) | ||||
| Cost of sales per ounce of gold sold (includes amortization)(1) | ||||
| Total cash costs per ounce of gold sold(2) | ||||
| All-in sustaining costs per ounce of gold sold(2) | ||||
| Share Data | ||||
| Earnings per share, basic | ||||
| Earnings per share, diluted | ||||
| Adjusted earnings per share, basic(2) | ||||
| Weighted average common shares outstanding (basic) (000’s) | 420,386 | 420,192 | 420,444 | 408,165 |
| Financial Position (in millions) | ||||
| Cash and cash equivalents(4) | ||||
(1) Cost of sales includes mining and processing costs, royalties, and amortization expense.
(2) Refer to the “Non-GAAP Measures and Additional GAAP Measures” section at the end of this press release and associated MD&A for a description and calculation of these measures.
(3) Sustaining finance leases at the
(4) Cash and cash equivalents in the comparatives reflect the balance as at
(5) Average realized gold price for the three months and year ended
(6) Comparative figures reflect the inclusion of the
| Three Months Ended | Years Ended | |||
| 2025 | 2024 | 2025 | 2024 | |
| Gold production (ounces) | ||||
| 60,000 | 55,600 | 250,400 | 188,000 | |
| 41,400 | 45,700 | 153,400 | 174,000 | |
| 40,100 | 38,900 | 141,600 | 205,000 | |
| Gold sales (ounces) | ||||
| 62,002 | 56,100 | 241,359 | 183,441 | |
| 42,287 | 45,441 | 153,382 | 173,274 | |
| 37,858 | 39,717 | 136,489 | 203,519 | |
| Cost of sales (in millions)(1) | ||||
| Cost of sales per ounce of gold sold (includes amortization)(1) | ||||
| Total cash costs per ounce of gold sold(2) | ||||
| Mine-site all-in sustaining costs per ounce of gold sold(2)(3) | ||||
| Capital expenditures (sustaining, growth, and capitalized exploration) (in millions)(2) | ||||
| Other | ||||
(1) Cost of sales includes mining and processing costs, royalties, and amortization expense.
(2) Refer to the “Non-GAAP Measures and Additional GAAP Measures” section at the end of this press release and associated MD&A for a description and calculation of these measures.
(3) For the purposes of calculating mine-site all-in sustaining costs, the Company does not include an allocation of corporate and administrative expense and corporate share-based compensation expense.
(4) Includes capitalized exploration at
(5) Includes capitalized exploration at
(6) Includes capitalized exploration at
(7)
(8)
(9) Sustaining capital expenditures for
Environment, Social and Governance Summary Performance
Health and Safety
- Total Recordable Injury Frequency Rate1 ("TRIFR") of 1.47 in the fourth quarter
- Lost time injury frequency rate1 ("LTIFR") of nil in the fourth quarter
- Alamos had 19 recordable injuries across its sites and no lost time injuries in the fourth quarter. For the full year, Alamos had 56 recordable injuries across its sites including 3 LTIs
- For the full year, TRIFR was 1.14 and LTIFR was 0.06, down 35% and 42%, respectively, from the prior year
Alamos had a strong safety performance in 2025, achieving its lowest TRIFR on record, while recognizing that continued effort is required to achieve our ultimate goal of zero harm. Alamos strives to maintain a safe, healthy working environment for all, with a strong safety culture where everyone is continually reminded of the importance of keeping themselves and their colleagues healthy and injury-free. The Company’s overarching commitment is to have all employees and contractors return Home Safe Every Day.
In 2026, the Company plans to roll out safety leadership training across all sites in connection with the launch of Alamos’ Home Safe Eight, a new initiative consisting of eight non-negotiable safety rules targeting high-risk activities. These rules, which focus on areas such as energy isolation, working at heights, and safe vehicle operation, are designed to significantly reduce the potential for injury through consistent and disciplined application.
Environment
- Zero significant environmental incidents for the fourth quarter and full year, and one reportable spill in the fourth quarter
- Continued reclamation activities at the
Cerro Pelon ,El Victor andSan Carlos pits in theMulatos District
The one reportable spill occurred at the
Community
Alamos continued to provide charitable donations, sponsorships, medical support and infrastructure investments within its local communities, including:
- Provision of free internet access to the village of Matarachi in Senora,
Mexico to create social, educational and economic development opportunities in the region - Distribution of holiday vouchers and hampers to community members in
Matachewan ,Lynn Lake , andMarcel Colomb First Nation - Cash donations to
Dubreuilville Food Bank ,Lady Dunn Health Center Foundation , as well as several other health, education, and food programs in the communities in which Alamos operates - Purchase of a heating unit for the
Matachewan Fire Department - Delivered Mining Showcase to more than 250 students from five high schools near the
Island Gold District , as well as a community open house for approximately 300 local residents
The Company believes that excellence in sustainability provides a net benefit to all stakeholders. The Company continues to engage with local communities to understand local challenges and priorities. Ongoing investments in local infrastructure, health care, education, cultural and community programs remain a focus of the Company.
Governance and Disclosure
The Mulatos District received the Exceptional Companies Award by theBusiness Coordinating Council for its contributions to theUN Sustainable Development Goals.The Mulatos District also received the Sonora Philanthropy Prize, awarded by the Esposos Rodríguez Foundation,Maldonado Foundation , Educativa y Cultural Don JoséS. Healy Foundation , and theUniversity of Sonora - Achieved its highest-ever CDP Climate Change score in December, receiving a “B” for its disclosure. Alamos also achieved a score of 56 on S&P Global’s annual Corporate Sustainability Assessment, its highest score to date
The Company maintains the highest standards of corporate governance to ensure that corporate decision-making reflects its values, including the Company’s commitment to sustainable development.
(1) Frequency rate is calculated as incidents per 200,000 hours worked.
Outlook and Strategy
| 2026 Guidance | |||||
| Total | |||||
| Gold production (000's ounces) | 290 - 330 | 155 - 175 | 125 - 145 | — | 570 - 650 |
| Cost of sales, including amortization (in millions)(2) | |||||
| Cost of sales, including amortization ($ per ounce)(2) | |||||
| Total cash costs ($ per ounce)(1) | — | ||||
| All-in sustaining costs ($ per ounce)(1) | |||||
| Mine-site all-in sustaining costs ($ per ounce)(1)(3) | — | ||||
| Capital expenditures ($ millions) | |||||
| Sustaining capital(1)(4) | — | ||||
| Growth capital(1)(4) | |||||
| Total sustaining and growth capital(1)(4) | |||||
| Capitalized exploration(1) | |||||
| Total capital expenditures and capitalized exploration(1) | |||||
(1) Refer to the "Non-GAAP Measures and Additional GAAP" section at the end of this press release and associated MD&A for a description of these measures.
(2) Cost of sales includes mining and processing costs, royalties, and amortization expense but excludes silver credit, and is calculated based on the mid-point of total cash cost guidance.
(3) For the purposes of calculating mine-site all-in sustaining costs at individual mine sites the Company allocates a portion of share based compensation to the mine sites, but does not include an allocation of corporate and administrative expenses to the mine sites.
(4) Sustaining and growth capital guidance excludes capitalized exploration.
The Company’s objective is to operate a sustainable business model that supports growing returns to all stakeholders over the long-term, through growing production, expanding margins, and increasing profitability. This includes a balanced approach to capital allocation focused on generating strong ongoing free cash flow while re-investing in high-return internal growth opportunities, and supporting higher returns to shareholders.
2025 Year in Review
From an operational perspective, the past year was not reflective of the Company's long track record of execution. Full year production of 545,000 ounces was lower than planned, down 4% from 2024, and at higher costs. Despite the operational challenges, the Company delivered a record financial performance in 2025 and made strong progress on its growth initiatives.
Revenues increased 34% from 2024 to a record
Additionally, the Company made strong progress on its growth initiatives, which are expected to nearly double gold production to approximately one million ounces annually by 2030, underpinning one of the strongest outlooks in the sector. The Phase 3+ Expansion continues to advance with the shaft on track to begin skipping ore by the end of 2026. Work on the expansion of the Magino mill began during 2025, while the Company completed an evaluation of the optimal size of a larger expansion of the
The study was completed earlier this month, with the announcement of the IGD Expansion to 20,000 tpd which is expected to create one of the largest, lowest-cost, and most profitable gold mines in
The expansion has attractive economics with an after-tax IRR of 53% and after-tax NPV of
Work on the expansion of the Magino mill began during 2025, with all infrastructure designed to support the larger expansion to 20,000 tpd. With all earthworks and concrete foundation complete, and the steel structure of the new mill building already constructed, the larger IGD Expansion is already well underway and significantly derisked.
Given the previously announced delay in the ramp up of construction of the
Development activities on PDA advanced with procurement of long lead time items and mobilizing the contractor for portal construction and start of underground development. Construction activities are expected to ramp up in 2026 with PDA on track for initial production mid-2027.
From an exploration perspective, it was another successful year across the Company's portfolio of assets. Global Mineral Reserves increased 32% to 15.9 million ounces with grades also increasing 5% to 1.87 g/t Au (265 mt). This marked the seventh consecutive year Mineral Reserves have increased for a cumulative increase of 64%, with grades also increasing 24% over that time frame. The increase was driven by the successful conversion of a large portion of Mineral Resources to Reserves at the
2026 Outlook
The Company provided three-year production and operating guidance in
Consolidated production is expected to increase 12% from 2025 (based on the mid-point) to a range of between 570,000 and 650,000 ounces. This is expected to be driven by the ramp up of underground mining rates through the year at Island Gold in conjunction with the completion of the Phase 3+ Shaft Expansion towards the end of 2026, as well as increased mining rates at
Total cash costs and AISC per ounce are expected to be consistent with 2025 for the full year, and trend lower through the year driven by low-cost growth at the
Gold production is expected to increase to a range of between 650,000 and 730,000 ounces in 2027, a 13% increase from 2026, and 27% increase from 2025.
Further growth is expected into 2029 with initial production from
Total cash costs and AISC in 2027 are expected to decrease 18% and 11%, respectively, from 2026 driven by low-cost growth from the
Capital spending in 2026 is expected to increase from 2025 to a range of
The 2026 global exploration budget has increased to a record
Cash taxes attributable to the
Additionally, as previously guided, the Company's cash flow during 2026 will be impacted by the planned delivery of 12,255 ounces into the gold prepayment facility. The ounces will be delivered monthly in the first half of 2026 (approximately 2,043 ounces per month) and recorded as revenue based on the prepay price of
The Company remains well positioned to fund its high-return growth projects internally with strong ongoing free cash flow,
Fourth Quarter and Year-End 2025 results
Island Gold District Financial and Operational Review (6)
| Three Months Ended | Years Ended | |||||||
| 2025 | 2024 | 2025 | 2024 | |||||
| Gold production (ounces) | 60,000 | 55,600 | 250,400 | 188,000 | ||||
| Gold sales (ounces) | 62,002 | 56,100 | 241,359 | 183,441 | ||||
| Financial Review (in millions) | ||||||||
| Operating Revenues | ||||||||
| Cost of sales(1) | ||||||||
| Earnings from operations | ||||||||
| Cash provided by operating activities | ||||||||
| Capital expenditures (sustaining)(2) | ||||||||
| Lease payments (sustaining)(2),(5) | ||||||||
| Capital expenditures (growth)(2) | ||||||||
| Capital expenditures (capitalized exploration)(2) | ||||||||
| Mine-site free cash flow(2),(5) | ( | ( | ||||||
| Cost of sales, including amortization per ounce of gold sold(1) | ||||||||
| Total cash costs per ounce of gold sold(2) | ||||||||
| Mine-site all-in sustaining costs per ounce of gold sold(2),(3) | ||||||||
| Underground Operations | ||||||||
| Tonnes of ore mined | 106,400 | 112,980 | 451,672 | 396,686 | ||||
| Tonnes of ore mined per day | 1,157 | 1,228 | 1,237 | 1,084 | ||||
| Average grade of gold(4) | 10.61 | 11.05 | 11.44 | 12.39 | ||||
| Metres developed | 1,539 | 1,914 | 7,597 | 6,626 | ||||
| Island Gold Mill Operations(9) | ||||||||
| Tonnes of ore processed | 108,160 | 110,096 | 342,334 | 392,460 | ||||
| Tonnes of ore processed per day | 1,176 | 1,197 | 1,160 | 1,072 | ||||
| Average grade of gold(4) | 10.71 | 11.19 | 11.61 | 12.47 | ||||
| Contained ounces milled | 37,226 | 39,614 | 127,804 | 157,379 | ||||
| Average recovery rate | 98 | % | 98 | % | 98 | % | 98 | % |
| Open Pit Operations | ||||||||
| Tonnes of ore mined - open pit(7) | 1,526,445 | 1,020,260 | 5,465,033 | 1,838,496 | ||||
| Tonnes of ore mined per day | 16,592 | 11,090 | 14,973 | 10,689 | ||||
| Total waste mined - open pit(8) | 2,650,693 | 3,877,170 | 13,754,912 | 6,759,562 | ||||
| Total tonnes mined - open pit | 4,177,138 | 4,897,430 | 19,219,944 | 8,598,059 | ||||
| Waste-to-ore ratio(8) | 1.74 | 3.96 | 2.52 | 4.18 | ||||
| Average grade of gold(4) | 0.83 | 0.73 | 0.82 | 0.81 | ||||
| Magino Mill Operations(10) | ||||||||
| Tonnes of ore processed | 793,541 | 615,076 | 3,004,449 | 1,165,551 | ||||
| Tonnes of ore processed per day | 8,625 | 6,686 | 8,231 | 6,776 | ||||
| Average grade of gold processed(4) | 1.11 | 0.89 | 1.34 | 0.91 | ||||
| Contained ounces milled | 28,386 | 17,571 | 129,385 | 33,941 | ||||
| Average recovery rate | 95 | % | 94 | % | 95 | % | 95 | % |
(1) Cost of sales includes mining and processing costs, royalties, and amortization.
(2) Refer to the “Non-GAAP Measures and Additional GAAP Measures” section at the end of this press release and associated MD&A for a description and calculation of these measures.
(3) For the purposes of calculating mine-site all-in sustaining costs, the Company does not include an allocation of corporate and administrative expense and corporate share-based compensation expense.
(4) Grams per tonne of gold.
(5) Mine-site free cash flow does not include lease payments which are classified as cash flows used in financing activities on the consolidated financial statements.
(6) Comparative figures reflect the inclusion of the
(7) Includes ore stockpiled during the periods.
(8) Total waste mined includes operating waste and capitalized stripping.
(9) Island Gold average milling rates exclude the period where mill was on care and maintenance
(10) Magino mill results include the processing of open pit ore from Magino and excess underground ore not processed within the Island Gold mill.
Island Gold Operational Review
Underground mining rates averaged 1,157 tpd in the fourth quarter, a 6% decrease from the prior year period and slightly below full year guidance reflecting additional rehabilitation work related to the seismic event in October, as well as downtime in late December due to severe winter weather. Severe snowstorms and subsequent road closures prevented delivery of supplies and access to site by personnel and emergency services. This required a stand down of underground mining operations for three days. For the full year, underground mining rates averaged 1,237 tpd, a 14% increase compared to the prior year and within the annual guidance range.
The majority of the underground rehabilitation work was completed during the quarter but was more extensive than originally anticipated, which impacted mining rates. With substantial progress made through the end of November, underground mining rates improved to average 1,220 tpd for the month of December. Excluding the impact of the three days of weather-related downtime near the end of the quarter, mining rates would have averaged approximately 1,350 tpd in December. Rehabilitation work required for the ramp up of mining rates through 2026 as part of the Phase 3+ Shaft Expansion has been substantially completed. Mining rates are expected to increase to average approximately 1,400 tpd in the first quarter, and continue increasing to average 2,000 tpd by the end of 2026, coinciding with the completion of the shaft infrastructure. A further increase to 2,400 tpd is expected early in 2027.
Underground grades mined averaged 10.61 g/t Au for the fourth quarter and 11.44 g/t Au for the full year, both in line with guidance. In 2026, grades are expected to increase through the year from 9.0 g/t Au in the first quarter to 11.5 g/t Au in the fourth quarter and average close to the Mineral Reserve grade for the year.
The Island Gold mill throughput averaged 1,176 tpd for the fourth quarter, consistent with mining rates. Mill throughput averaged 1,160 tpd for the full year, slightly below mining rates, with excess underground ore being processed at the Magino mill. Mill recoveries averaged 98% for the fourth quarter and full year, slightly above guidance.
As outlined in the IGD Expansion Study, the Island Gold mill will continue operating until early 2028 and process approximately 1,265 tpd of higher grade underground ore. The remaining underground ore mined beyond the Island Gold mill capacity will be blended at increasing rates with open pit ore and processed within the Magino mill. The Island Gold mill is expected to be shut down early 2028, after the completion of the larger Magino mill expansion to 20,000 tpd, when all underground and open pit ore will be processed within the larger and more cost-effective Magino mill.
Magino Operational Review
Total mining rates averaged 45,404 tpd during the fourth quarter. This included 16,592 tpd of ore, a 50% increase from the prior year period and above full year guidance. For the full year, ore mined averaged 14,973 tpd, in line with guidance. Grades mined of 0.83 g/t Au for the fourth quarter and 0.82 g/t Au for the full year were both consistent with annual guidance.
Milling rates averaged 8,625 tpd in the fourth quarter, up slightly from the third quarter and 29% higher than the prior year period. For the full year, milling rates averaged 8,231 tpd, below annual guidance. Through most of the quarter, milling rates averaged more than 9,000 tpd before being impacted by the above noted severe winter weather issues late in December. Additionally, an earlier than planned replacement of the liner within the discharge end of the SAG mill reduced mill throughput during the quarter.
The weather-related road closures impacted the regular delivery of compressed natural gas ("CNG") to the CNG plant, which currently supplies the mill with power. This resulted in three days of downtime to the mill. Excluding this impact, milling rates would have averaged nearly 9,000 tpd, a 7% improvement from the third quarter.
As part of the Phase 3+ Shaft Expansion, the Magino mill is expected to be connected to grid power in late 2026, which will eliminate the reliance on CNG going forward. The connection to lower cost grid power will not only provide a more reliable source of power, but also drive processing costs lower.
In addition to the improvements resulting from the connection to grid power, the Company has completed a restructuring of the maintenance and mill operating management teams, and continues to work with third-party specialists to implement additional modifications to improve reliability. This includes the addition of a temporary crusher during the first quarter to provide supplemental crushed ore feed after the existing secondary crusher arrangement. These modifications are expected to drive improved milling rates into the second quarter, with a further increase to consistent levels of 10,000 tpd from the third quarter onward.
As outlined in the IGD Expansion Study, further improvements are planned for the existing crushing and conveying circuit as part of a larger expansion to 20,000 tpd. These include the addition of a gyratory crusher, ore bins, and a new truck dump configuration allowing for the direct tipping of ore. In addition to the connection to grid power, these changes will significantly improve the performance of the existing crushing circuit by reducing ore rehandling and ensuring more consistent and higher ore flow to the mill.
Grades processed of 1.11 g/t Au during the fourth quarter were slightly above the annual guidance and reflect the inclusion of 5,000 tonnes of higher grade underground ore during the quarter. Combined grades from underground and open pit ore processed in the Magino mill during the full year were 1.34 g/t Au. Recoveries for the fourth quarter and full year were 95%, consistent with annual guidance.
Island Gold District Financial Review
Revenues of
Cost of sales of
Total cash costs of
Total capital expenditures were
Young-Davidson Financial and Operational Review
| Three Months Ended | Years Ended | |||||||
| 2025 | 2024 | 2025 | 2024 | |||||
| Gold production (ounces) | 41,400 | 45,700 | 153,400 | 174,000 | ||||
| Gold sales (ounces) | 42,287 | 45,441 | 153,382 | 173,274 | ||||
| Financial Review (in millions) | ||||||||
| Operating Revenues | ||||||||
| Cost of sales(1) | ||||||||
| Earnings from operations | ||||||||
| Cash provided by operating activities | ||||||||
| Capital expenditures (sustaining)(2) | ||||||||
| Capital expenditures (growth)(2) | ||||||||
| Capital expenditures (capitalized exploration)(2) | ||||||||
| Mine-site free cash flow(2) | ||||||||
| Cost of sales, including amortization per ounce of gold sold(1) | ||||||||
| Total cash costs per ounce of gold sold(2) | ||||||||
| Mine site all-in sustaining costs per ounce of gold sold(2),(3) | ||||||||
| Underground Operations | ||||||||
| Tonnes of ore mined | 655,972 | 738,717 | 2,586,691 | 2,786,639 | ||||
| Tonnes of ore mined per day | 7,130 | 8,030 | 7,087 | 7,614 | ||||
| Average grade of gold(4) | 2.10 | 2.10 | 2.01 | 2.08 | ||||
| Metres developed | 2,002 | 1,953 | 8,137 | 8,274 | ||||
| Mill Operations | ||||||||
| Tonnes of ore processed | 746,153 | 746,709 | 2,705,669 | 2,806,192 | ||||
| Tonnes of ore processed per day | 8,110 | 8,116 | 7,413 | 7,667 | ||||
| Average grade of gold(4) | 1.92 | 2.10 | 1.94 | 2.08 | ||||
| Contained ounces milled | 46,019 | 50,325 | 168,373 | 187,321 | ||||
| Average recovery rate | 90 | % | 91 | % | 91 | % | 91 | % |
(1) Cost of sales includes mining and processing costs, royalties and amortization.
(2) Refer to the “Non-GAAP Measures and Additional GAAP Measures” section at the end of this press release and associated MD&A for a description and calculation of these measures.
(3) For the purposes of calculating mine-site all-in sustaining costs, the Company does not include an allocation of corporate and administrative expense and corporate share-based compensation expense.
(4) Grams per tonne of gold.
Operational review
Mining rates averaged 7,130 tpd in the fourth quarter, below the prior year period and annual guidance reflecting severe winter weather conditions late in December, rehabilitation work required on one of three ore passes, and the failure of a small portion of a paste plug underground. For the full year, mining rates averaged 7,087 tpd, below the prior year and annual guidance.
Mining rates are expected to increase to average 7,600 tpd in the first quarter of 2026 reflecting additional ore pass availability and capacity. A new ore pass is also being commissioned during the first quarter, such that four will be available by the second quarter. This is expected to provide additional operational flexibility and support increased mining rates of approximately 8,000 tpd in the second quarter and through the rest of the year.
Grades mined of 2.10 g/t Au for the fourth quarter were consistent with the prior year period but lower than planned due to higher mining dilution within the stope impacted by the paste plug failure. Prior to this issue, grades mined averaged 2.20 g/t Au in October and November. Grades mined of 2.01 g/t Au for the full year were 3% lower than the prior year and slightly below the annual guidance range.
Milling rates averaged 8,110 tpd in the fourth quarter, consistent with the prior year period and above mining rates with low-grade stockpiled ore processed given the excess mill capacity. For the full year, milling rates averaged 7,413 tpd, 3% lower than the prior year. Milled grades averaged 1.92 g/t Au for the fourth quarter and 1.94 g/t Au for the full year, lower than mined grades reflecting the contribution of lower grade stockpiled ore. Mill recoveries averaged 90% for the fourth quarter and 91% for the full year, in-line with annual guidance.
Financial Review
Revenues increased to
Cost of sales of
Fourth quarter total cash costs of
Capital expenditures in the fourth quarter totaled
Mulatos District Financial and Operational Review
| Three Months Ended | Years Ended | |||||||
| 2025 | 2024 | 2025 | 2024 | |||||
| Gold production (ounces) | 40,100 | 38,900 | 141,600 | 205,000 | ||||
| Gold sales (ounces) | 37,858 | 39,717 | 136,489 | 203,519 | ||||
| Financial Review(in millions) | ||||||||
| Operating Revenues | ||||||||
| Cost of sales(1) | ||||||||
| Earnings from operations | ||||||||
| Cash provided by operating activities | ||||||||
| Capital expenditures (sustaining)(2) | ||||||||
| Capital expenditures (growth)(2) | ||||||||
| Capital expenditures (capitalized exploration)(2) | ||||||||
| Mine-site free cash flow(2) | ||||||||
| Cost of sales, including amortization per ounce of gold sold(1) | ||||||||
| Total cash costs per ounce of gold sold(2) | ||||||||
| Mine site all-in sustaining costs per ounce of gold sold(2),(3) | ||||||||
| Open Pit Operations | ||||||||
| Tonnes of ore mined - open pit | 1,071,540 | 965,182 | 4,078,875 | 3,951,240 | ||||
| Total waste mined - open pit | 4,221,982 | 4,188,162 | 16,337,196 | 16,185,032 | ||||
| Total tonnes mined - open pit | 5,293,522 | 5,153,345 | 20,416,071 | 20,136,272 | ||||
| Waste-to-ore ratio | 3.94 | 4.34 | 4.01 | 4.10 | ||||
| Crushing and Heap Leach Operations | ||||||||
| Tonnes of ore stacked | 1,091,255 | 991,160 | 4,141,466 | 3,960,225 | ||||
| Average grade of gold processed(4) | 1.30 | 0.93 | 1.26 | 1.27 | ||||
| Contained ounces stacked | 45,438 | 29,484 | 168,365 | 161,205 | ||||
| Average recovery rate | 69 | % | 98 | % | 64 | % | 98 | % |
| Ore crushed per day (tonnes) | 11,900 | 10,800 | 11,300 | 10,800 | ||||
(1) Cost of sales includes mining and processing costs, royalties, and amortization expense.
(2) Refer to the “Non-GAAP Measures and Additional GAAP Measures” section at the end of this press release and associated MD&A for a description and calculation of these measures.
(3) For the purposes of calculating mine-site all-in sustaining costs, the Company does not include an allocation of corporate and administrative expense and corporate share-based compensation expense.
(4) Grams per tonne of gold.
Mulatos District Operational Review
Production totaled 40,100 ounces in the fourth quarter, an 8% increase from the third quarter, reflecting strong stacking rates and the recovery of previously stacked ounces on the leach pad. Production for the full year totaled 141,600 ounces, in line with the revised annual guidance which had been increased in
La
Mulatos commenced residual leaching in
Mulatos District Financial Review
Revenues of
Cost of sales of
Total cash costs of
Capital expenditures totaled
Fourth Quarter 2025 Development Activities
Phase 3+ Shaft and IGD Expansion
In 2022, the Company announced the Phase 3+ Shaft Expansion at Island Gold to 2,400 tpd from the current rate of 1,200 tpd, which includes various infrastructure investments. These include the installation of a shaft, paste plant, as well as accelerated development to support the higher mining rates. Following the completion of the expansion late in 2026, the operation will transition from trucking ore and waste up the ramp to skipping ore and waste to surface through the new shaft infrastructure, driving production higher and costs significantly lower. As at
On
As outlined in the IGD Expansion Study, the Island Gold mill will continue operating and will be dedicated to processing approximately 1,265 tpd of higher grade underground ore until the expected completion of the Magino mill expansion in first quarter of 2028. The remaining underground ore mined, beyond the Island mill capacity of 1,265 tpd, will be blended at increasing rates with open pit ore and processed within the Magino mill.
During the fourth quarter of 2025, the Company spent
- Shaft sinking advanced to a depth of 1,350 m, or 98% of the planned depth of 1,379 m
- Advanced development activities on the loading pocket at shaft bottom
- Progressed mechanical and electrical outfitting for the water handling facility and shaft bin house
- Magino mill expansion to 20,000 tpd advancing with concrete foundation, mill building steel installation, and cladding activities underway
Paste plant construction progressing on plan with expected completion in second quarter of 2026 and commissioning in the fourth quarter- Completed concrete foundation for new administrative complex, with main structural steel installment and cladding underway
- Lateral development in support of higher mining rates ramp up through 2026
- Work advanced on the 115kV power line project in partnership with the Batchewana First Nation, including substantial completion of tree clearing and substation construction activities
The Phase 3+ Shaft Expansion is on schedule to be completed in the fourth quarter of 2026, and the IGD Expansion to 20,000 tpd is expected to be completed early in 2028.
| (in US$M) Growth capital (including indirects and contingency) | P3+ Estimate | Spent to date1,2 | Committed to date1 | % of Spent & Committed |
| 324 | 263 | 29 | 90% | |
| Mill Expansion3 | 67 | 64 | 29 | 139% |
| Paste Plant | 60 | 48 | 4 | 87% |
| Power Upgrade4 | 38 | 46 | 3 | 129% |
| General Indirect Costs | 91 | 76 | 4 | 88% |
| 98% | ||||
| Underground Equipment, Infrastructure & | 255 | 198 | — | 78% |
| 91% |
1. Reflects updated initial capital estimates released in
2. Amount spent to date accounted for on an accrual basis, including working capital movements.
3. Includes components for Magino mill expansion to 20,000 tpd which were not included in P3+ Estimate.
4. Power upgrade spent to-date is on a 100% basis and does not reflect partner’s contributions.
Island Gold shaft site area -

Island Gold paste plant -
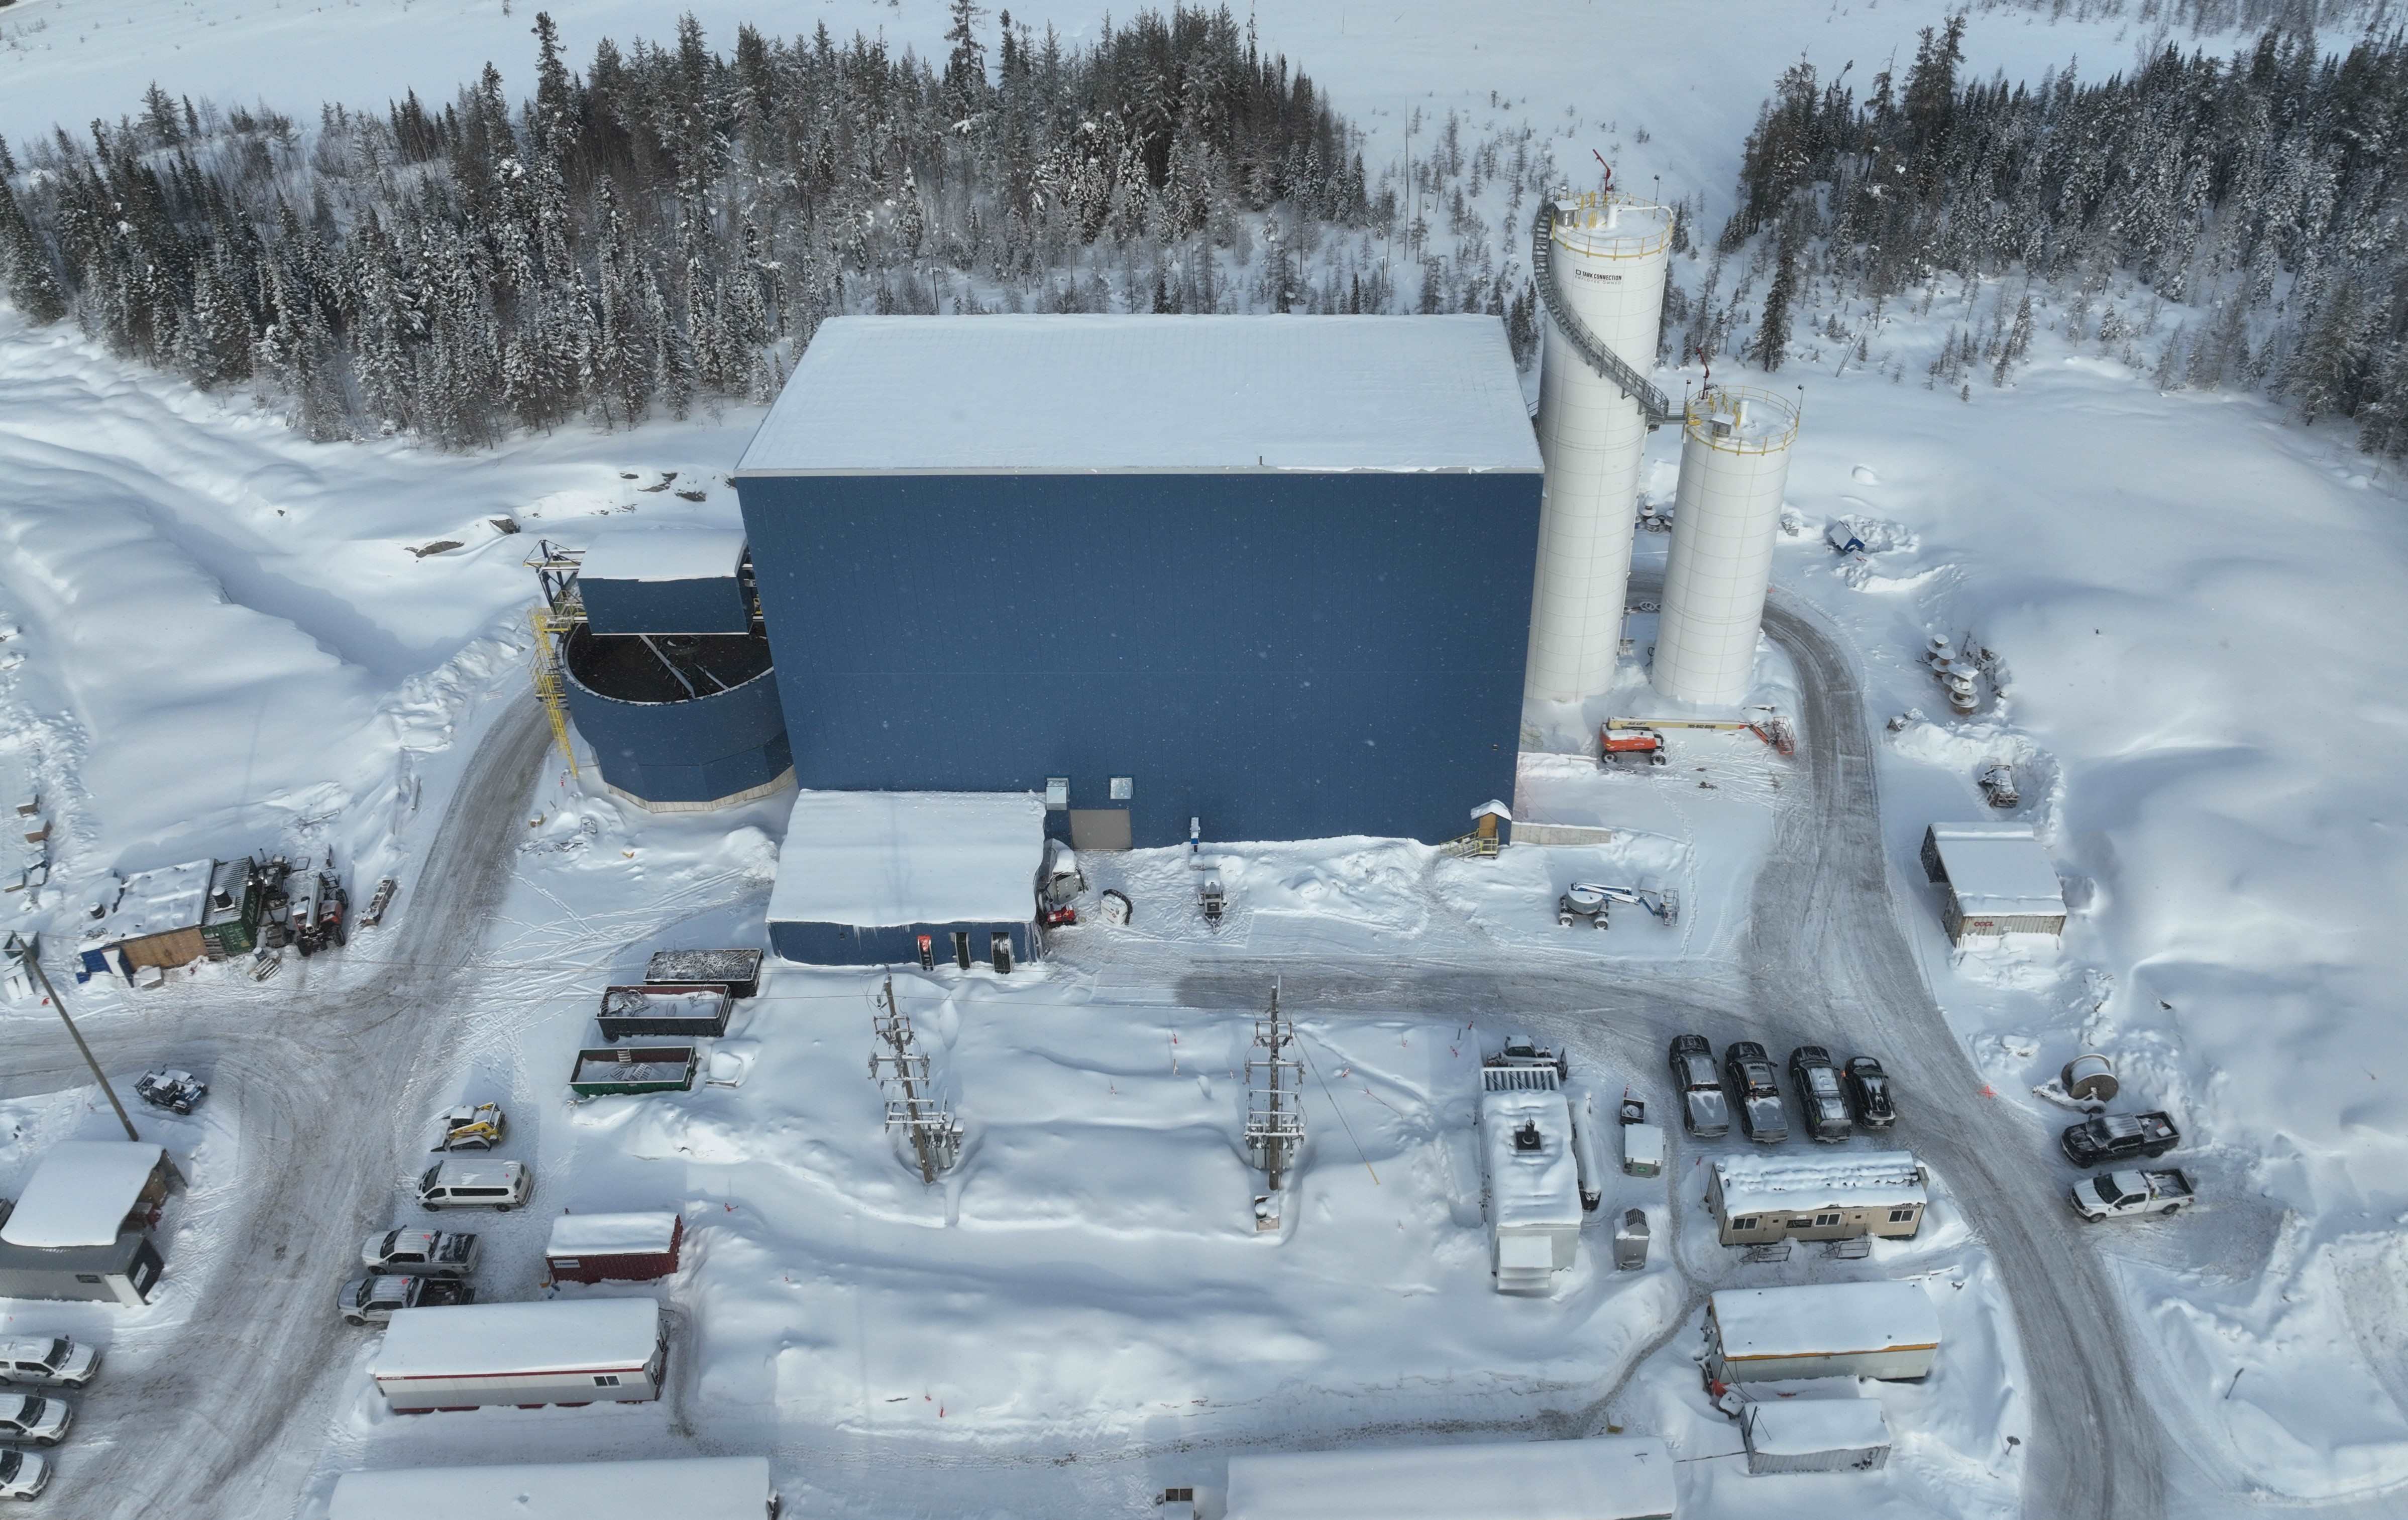
Island Gold 1350L shaft station (depth of 1,350 m) -

Magino mill expansion -
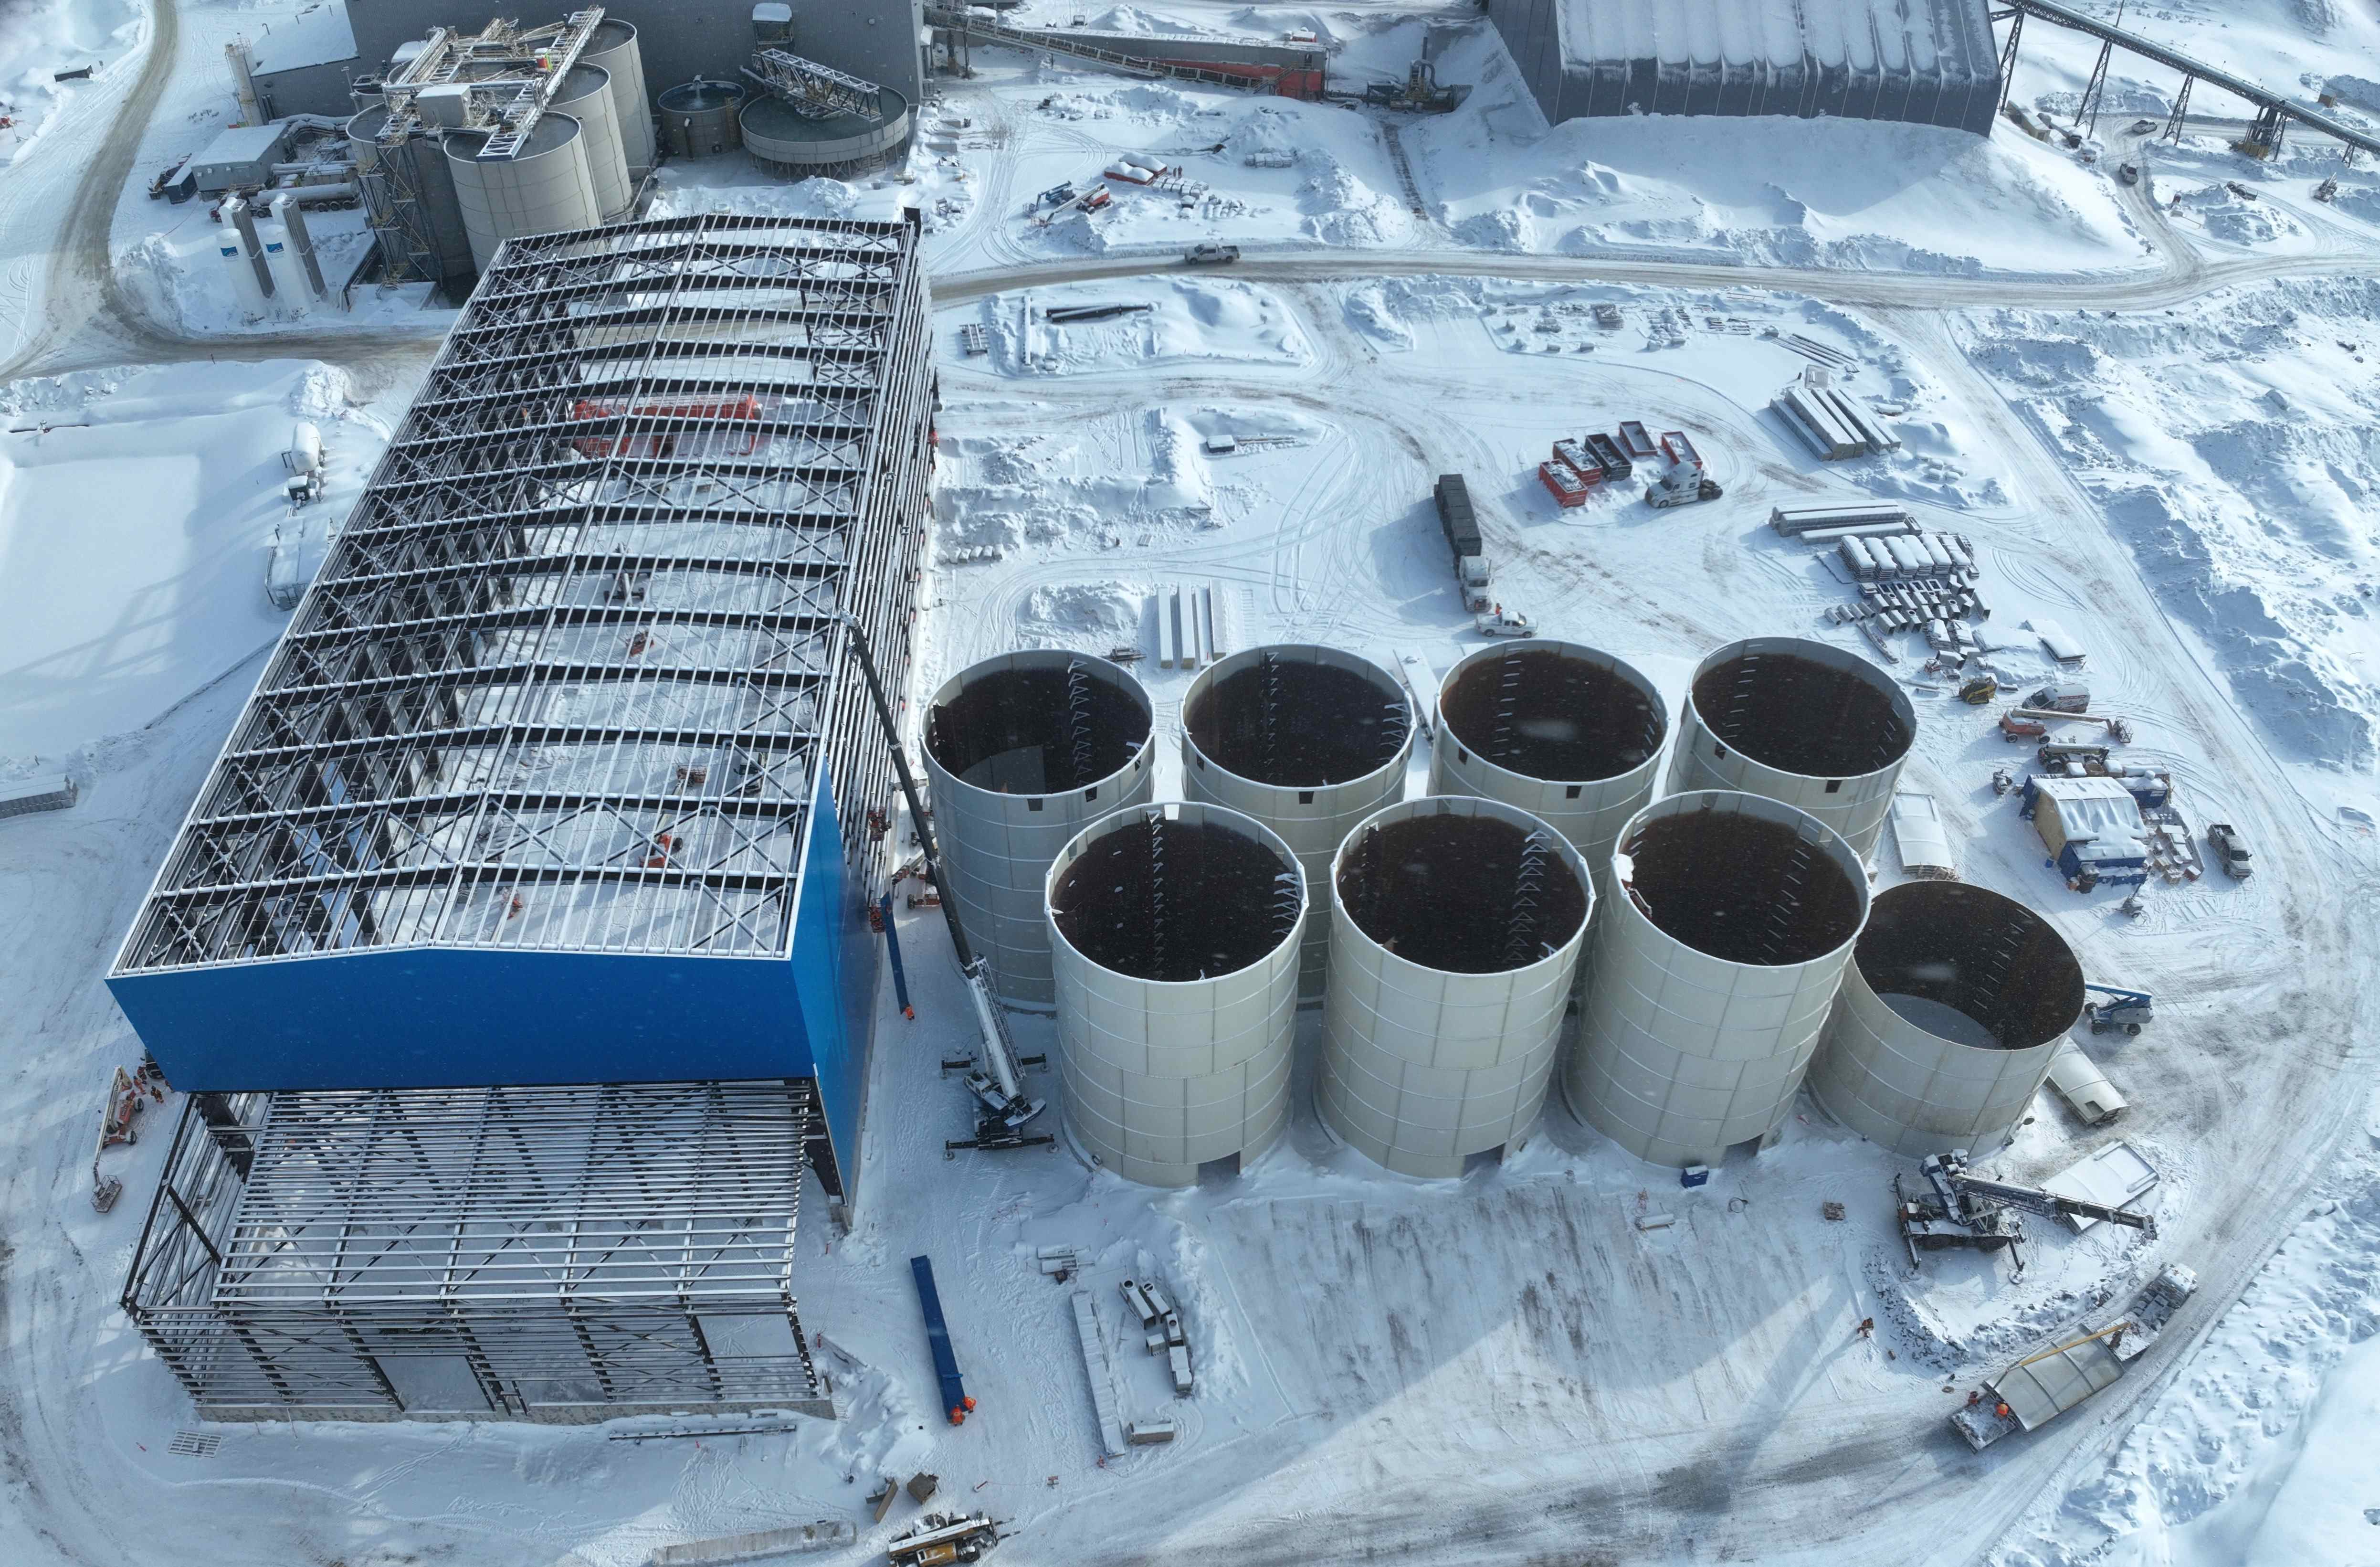
On
In
Given the impact of wildfires and evacuation orders in
With the delays in ramping up construction activities and significantly longer mine life, incorporating the BT and Linkwood deposits, the Company has re-engineered and optimized a number of elements within the broader
Reflecting scope changes to support a larger operation, three years of inflation since the 2023 Feasibility Study, and the longer construction timeline due to the 2025 wildfires, initial capital for the project has increased to
The updated parameters for the
- Average annual production of 186,000 ounces over the initial 10 years
- Low mine-site AISC of
$829 per ounce over the initial 10 years ($1,039 per ounce over the life of mine) - Long mine life of 25 years with total production of three million ounces (based on Mineral Reserves at the end of 2024)
- Attractive economics with significant near-mine and regional exploration upside
Capital spending on the
The majority of initial capital will be spent in 2027 and 2028, with first production expected in the first half of 2029. With attractive economics and significant exploration upside, the
Development spending (excluding exploration) was
PDA (
On
On
As outlined in the 2024 development plan, PDA is expected to produce an average of 127,000 ounces per year over the first four years and 104,000 ounces over the current mine life (based on Mineral Reserves as at
Reflecting the low cost structure and low initial capital, PDA is expected to be a high-return project with significant exploration upside. Based on the development plan released in
Development spending (excluding exploration) was
Fourth Quarter 2025 Exploration Activities
Total exploration expenditures during the fourth quarter of 2025 were
The program was successful on a number of fronts with total Mineral Reserves within the
A total of 46,889 m of underground drilling was completed in 180 holes in 2025 with a focus on defining new Mineral Reserves and Resources in proximity to existing production horizons and infrastructure. Additionally, 14,609 m of surface exploration drilling was completed in 15 holes targeting the area between the Island Gold and Magino deposits, as well as the down-plunge extension of the Island Gold deposit, below a depth of 1,500 m.
Additionally, a total of 33,964 m of underground delineation drilling was completed in 117 holes, and 12,269 m of surface delineation drilling was completed in 12 holes at Island Gold in 2025. A further 22,390 m of surface delineation drilling was completed in 51 holes at Magino. Delineation drilling within both deposits was focused on the conversion of a portion of the large Mineral Resource base to Mineral Reserves.
During the fourth quarter, 13,507 m of underground exploration drilling was completed in 55 holes, and 2,668 m of surface directional exploration drilling was completed in four holes at Island Gold. Additionally, 963 m of underground delineation drilling was completed in seven holes, focused on infill drilling to convert Mineral Resources to Mineral Reserves. Further, a total of 49 m of underground exploration drift development was completed during the fourth quarter.
As part of the regional exploration program, 4,679 m drilling was completed in 12 holes during the fourth quarter. The program focused on stepping out from high-grade mineralization intersected at the Cline-Pick deposit located approximately seven kilometres northeast of the Island Gold mine. A total of 11,060 m drilling was completed in 36 holes as part of regional exploration program at the
The Company provided a comprehensive exploration update on
Regional drilling within the past producing
As previously reported, one of the highlight intersections from Cline-Pick is drill hole 25IGX128, which targeted a 300 m gap in drilling, at approximately 430 m depth from surface, where a moderate east plunging ore shoot is associated with a subvertical east-west trending shear zone.
Within proximity to the shear zone, extensional veins hosting high-grade gold mineralization were intersected. As interpreted from the core angles and vein margins, a first extensional vein was drilled at a low-angle to core axis dip and intersected 15.28 g/t Au over 5.52 m. As a result, true width is estimated to be 10-20% of core length.
A second milky white vein with >75 occurrences of coarse visible gold was intersected which returned a composite interval of 178.07 g/t Au over 3.54 m. The vein has been interpreted as a moderate-steeply dipping shear-vein, with true width estimated at approximately 50% of core length.
Drilling is underway to follow up these intersections and step out within the shear zone to further define geometry and orientations of both the shear and the veins, as well as to determine the controls on gold mineralization. The hole represents one of the deeper holes drilled at Cline-Pick, with the main structure remaining open at depth and along strike.
Total exploration expenditures during the fourth quarter of 2025 were
To support the 2025 exploration program, 500 m of underground exploration development was planned for 2025, which included approximately 400 m to establish a hanging wall exploration drift to the south, from the 9620 level. By the end of the fourth quarter, 448 m had been completed in the hanging wall drift. This will allow for drill platforms with more optimal locations and orientations to test the higher grade mineralization discovered in the hanging wall.
During the fourth quarter, 12,786 m of underground exploration drilling was completed in 36 holes across multiple levels utilizing up to five drill rigs. Drilling is targeting syenite-hosted mineralization, as well as continuing to test mineralization in the hanging wall sediments and mafic-ultramafic stratigraphy. For the full year, 34,080 metres of exploration drilling was completed in 81 holes. Of the 81 holes drilled in 2025, more than half were completed in the latter part of year and after the cut off date for year-end 2025 Mineral Reserve and Resource reporting.
Drilling from the 9305-level and 9440-level ("
The 2025 program successfully increased Measured and Indicated Mineral Resources by 26% to 1.5 million ounces, with the average grade increasing 10% to 3.15 g/t Au, primarily reflecting growth within multiple hanging wall zones. Mineral Reserves decreased slightly to 3.0 million ounces grading 2.20 g/t Au with Mineral Reserve additions offsetting the majority of mining depletion over the past year.
A total of 4,716 m of regional surface exploration drilling was also completed in 15 holes in the fourth quarter (and full year) focused on evaluating the Otisse NE and Biralger targets. A comprehensive data compilation project is also underway on the Wydee and
Total exploration expenditures during the fourth quarter were
The planned addition of a mill to process higher-grade sulfides has created new opportunities for growth within the
In 2025, drilling at
The program was successful in nearly doubling the size of the Measured and Indicated Mineral Resource at
As previously reported, drilling commenced in the eastern portion of the Halcon target area early in 2025 as part of the regional scout drilling program. Drilling initially tested a new geological interpretation in an area that had only tested near-surface gold mineralization associated with oxides. As exploration drilling advanced, wide intervals of significant sulphide-hosted gold mineralization were intersected within a new area of focus at Halcon. The mineralized hydrothermal breccia is currently interpreted to dip to the northeast, and gold intercepts range from 38 m below surface in the west, to 282 m below surface down dip to the northeast. Mineralization remains open to the north, south and down dip.
The Halcon target is located 2 km north of the La
During 2025, limited exploration activities were completed at PDA with the focus shifting to construction of the project. Exploration drilling at PDA will resume from underground as development advances and drill platforms are established.
Exploration spending totaled
BT and Linkwood are satellite deposits to the
Qiqavik (
Qiqavik is a camp-scale property covering 63,474 ha in the
Exploration spending was
A total of 8,736 m of diamond drilling was completed in 29 holes across five target areas during the third quarter. Geological mapping, prospecting, till sampling, and 1,619-line kilometers of drone magnetics surveys were also completed in several target areas with the goal of continuing to explore and develop new target areas for future work. There was no exploration activity at Qiqavik in the fourth quarter.
Drilling in all five target areas in 2025 intersected gold mineralization, with 72% of the holes reporting gold grades above 1.0 g/t Au. Additionally, the program successfully intersected gold mineralization associated with several previously identified high-grade gold boulder trends, confirming proximal bedrock sources and short glacial transport distances. The success of this early-stage greenfield drilling program across multiple target areas continues to support the significant gold endowment potential of the
Review of Fourth Quarter Financial Results
During the fourth quarter of 2025, the Company sold 142,147 ounces of gold for record operating revenues of
The average realized gold price in the fourth quarter was
Cost of sales (which includes mining and processing costs, royalties, and amortization) were
Mining and processing costs were
Total cash costs of
Royalty expense was
Amortization of
The Company recognized earnings from operations of
The Company completed the sale of the Turkish projects as well as the
In the fourth quarter, losses on commodity derivatives of
The Company eliminated 50,000 ounces of legacy Argonaut hedges, scheduled to mature in the first half of 2026, in the fourth quarter. The cost to eliminate the hedges was
The Company reported net earnings of
Review of 2025 Financial Results
During the year ended
Cost of sales (which includes mining and processing costs, royalties, and amortization) for the full year were
Mining and processing costs were
Total cash costs of
Royalty expense was
Amortization of
A reversal of an impairment of
The Company recognized record earnings from operations of approximately
The Company completed the sale of the Turkish projects as well as the
For the full year, losses on commodity derivatives of
The Company eliminated 50,000 ounces of legacy Argonaut hedges, scheduled to mature in the first half of 2026, in the fourth quarter. The cost to eliminate the hedges was
The Company reported net earnings of approximately
Associated Documents
This press release should be read in conjunction with the Company’s consolidated financial statements for the year ended
Reminder of Fourth Quarter and Year-End 2025 Results Conference Call
Senior management will host a conference call on
Via Webcast:
To view the live webcast, please register at www.alamosgold.com, or through the following link view webcast.
Via Phone:
| (647) 495-7514 | |
| Toll free ( | (888) 596-4144 |
| Participant passcode: | 1813237# |
Alternatively, you may register your phone number here within 30 minutes of the scheduled start of the call to receive an instant automated call back.
A playback will be available until
Qualified Persons
About Alamos
Alamos is a Canadian-based intermediate gold producer with diversified production from three operations in
FOR FURTHER INFORMATION, PLEASE CONTACT:
| Senior Vice-President, Corporate Development & Investor Relations |
| (416) 368-9932 x 5439 |
| Vice President, |
| (416) 368-9932 x 5427 |
The TSX and NYSE have not reviewed and do not accept responsibility for the adequacy or accuracy of this release.
Cautionary Note Regarding Forward-Looking Statements
This press release contains or incorporates by reference “forward-looking statements” and “forward-looking information” as defined under applicable Canadian and
Such statements in this press release may include (without limitation) information, assumptions, expectations and guidance as to strategy, plans, and future financial and operating performance, such as those regarding: free cash flow; mine-site free cash flow; costs (including total cash costs, AISC, mine-site AISC, capital expenditures, growth and sustaining capital, capitalized exploration, exploration spending); budgets; tax rates and the payment of taxes; IRR; NPV; gold prepayment facility; total liquidity; returns to stakeholders; impacts of inflation; mine plans; mine life; Mineral Reserve life; Mineral Reserves and Resources; gold and other metal price assumptions; foreign exchange rates; size, value and profitability of operations and the Company's balanced approach to capital allocation; project economics; project risks; mining methodologies; underground development rates; mining, milling and processing rates; total mill feed and throughput rates; recovery rates; anticipated gold production, production rates, timing of production, further production potential and growth; gold grades; exploration potential, budgets, focuses, programs, targets, and projected results; investment in and funding of growth initiatives and projects; operational impacts on the natural environment; the Company's approach to reduction of its environmental footprint, greenhouse gas emissions, and related investments in new initiatives; the Company's climate change strategy and goals; community relations, engagement activities, and initiatives; corporate governance; plans with respect to health and safety; outlooks for each of the
Alamos cautions that forward-looking statements are necessarily based upon several factors and assumptions that, while considered reasonable by the Company at the time of making such statements, are inherently subject to significant business, economic, technical, legal, political and competitive uncertainties and contingencies. Known and unknown factors could cause actual results to differ materially from those projected in the forward-looking statements and undue reliance should not be placed on such statements and information.
Risk factors that may affect Alamos’ ability to achieve the expectations set forth in the forward-looking statements in this document include, but are not limited to: the actual results of current exploration activities; changes to current estimates of Mineral Reserves and Resources; changes to production estimates (which assume accuracy of projected ore grade, mining rates, recovery timing and recovery rate estimates which may be impacted by unscheduled maintenance, weather issues, labour and contractor availability and other operating or technical difficulties in connection with mining or development activities, including geotechnical challenges); conclusions of economic and geological evaluations; the costs and timing of exploration, construction and development of new deposits; changes in project parameters as plans continue to be refined; operations may be exposed to illnesses, diseases, epidemics and pandemics which may impact, among other things, the broader market and the trading price of the Company's shares; the duration of any regulatory responses to any illness, disease, epidemic or pandemic; government and the Company’s attempts to reduce the spread of any illness, disease, epidemic or pandemic which may affect many aspects of the Company's operations including the ability to transport personnel to and from site, contractor and supply availability and the ability to sell or deliver gold doré bars; provincial, state and federal orders or mandates (including with respect to mining operations generally or auxiliary businesses or services required for the Company’s operations) in
Additional risk factors and details with respect to risk factors that may affect the Company’s ability to achieve the expectations set forth in the forward-looking statements contained in this press release are set out in the Company's latest 40-F/Annual Information Form and Management’s Discussion and Analysis, each under the heading “Risk Factors”, available on the SEDAR+ website at www.sedarplus.ca or on EDGAR at www.sec.gov. The foregoing should be reviewed in conjunction with the information, risk factors and assumptions found in this press release.
The Company disclaims any intention or obligation to update or revise any forward-looking statements whether as a result of new information, future events or otherwise, except as required by applicable law.
Cautionary Note to U.S. Investors Concerning Measured, Indicated and Inferred Resources
Measured, Indicated and Inferred Resources: All resource and reserve estimates included in this MD&A or documents referenced in this MD&A have been prepared in accordance with Canadian National Instrument 43-101 - Standards of Disclosure for Mineral Projects ("NI 43-101") and the
Investors are cautioned that while the above terms are “substantially similar” to CIM Definitions, there are differences in the definitions under Regulation S-K 1300 and the CIM Standards. Accordingly, there is no assurance any mineral reserves or mineral resources that the Company may report as “proven mineral reserves”, “probable mineral reserves”, “measured mineral resources”, “indicated mineral resources” and “inferred mineral resources” under NI 43-101 would be the same had the Company prepared the mineral reserve or mineral resource estimates under the standards adopted under Regulation S-K 1300. U.S. investors are also cautioned that while the
International Financial Reporting Standards: The consolidated financial statements of the Company have been prepared by management in accordance with IFRS, as issued by the IASB (note 2 and 3 to the consolidated financial statements for the years ended
Non-GAAP Measures and Additional GAAP Measures
The Company has included certain non-GAAP financial measures to supplement its consolidated financial statements for the years ended
- adjusted net earnings and adjusted earnings per share;
- cash flow from operating activities before changes in working capital and taxes paid;
- Company-wide free cash flow;
- total mine-site free cash flow;
- mine-site free cash flow;
- total cash costs per ounce of gold sold;
- AISC per ounce of gold sold;
- Mine-site AISC per ounce of gold sold;
- sustaining and non-sustaining capital expenditures; and
- adjusted earnings before interest, taxes, depreciation, and amortization ("Adjusted EBITDA")
The Company believes that these measures, together with measures determined in accordance with IFRS, provide investors with an improved ability to evaluate the underlying performance of the Company. Non-GAAP financial measures do not have any standardized meaning prescribed under IFRS, and therefore they may not be comparable to similar measures employed by other companies. The data is intended to provide additional information and should not be considered in isolation or as a substitute for measures of performance prepared in accordance with IFRS. Management's determination of the components of non-GAAP and additional measures are evaluated on a periodic basis influenced by new items and transactions, a review of investor uses and new regulations as applicable. Any changes to the measures are duly noted and retrospectively applied as applicable.
Adjusted Net Earnings and Adjusted Earnings per Share
“Adjusted net earnings” and “adjusted earnings per share” are non-GAAP financial measures with no standard meaning under IFRS which exclude the following from net earnings:
- Foreign exchange gains or losses
- Items included in other loss
- Impairment expense/reversal of impairment
- Unrealized gain or loss on commodity derivatives
- Certain non-recurring items
- Foreign exchange gain or loss recorded in deferred tax expense
- The income and mining tax impact of items included in other loss
The Company uses adjusted net earnings for its own internal purposes. Management’s internal budgets and forecasts and public guidance do not reflect the items which have been excluded from the determination of adjusted net earnings. Consequently, the presentation of adjusted net earnings enables shareholders to better understand the underlying operating performance of the core mining business through the eyes of management. Management periodically evaluates the components of adjusted net earnings based on an internal assessment of performance measures that are useful for evaluating the operating performance of our business and a review of the non-GAAP measures used by mining industry analysts and other mining companies.
Adjusted net earnings is intended to provide additional information only and does not have any standardized meaning under IFRS and may not be comparable to similar measures presented by other companies. It should not be considered in isolation or as a substitute for measures of performance prepared in accordance with IFRS. The measure is not necessarily indicative of operating profit or cash flows from operations as determined under IFRS. The following table reconciles this non-GAAP measure to the most directly comparable IFRS measure.
| (in millions) | ||||||||||
| Three Months Ended | Years Ended | |||||||||
| 2025 | 2024 | 2025 | 2024 | 2023 | ||||||
| Net earnings | ||||||||||
| Adjustments: | ||||||||||
| Foreign exchange loss (gain) | (2.6 | ) | (6.6 | ) | 5.1 | (8.0 | ) | (1.9 | ) | |
| Impairment reversals and gain on sale of assets, net of tax | (226.7 | ) | — | (419.6 | ) | (38.6 | ) | — | ||
| Loss (gain) on commodity derivatives, net of tax | 34.9 | (4.4 | ) | 152.1 | 18.2 | 0.7 | ||||
| Other loss | 2.5 | 16.1 | 9.6 | 39.7 | 22.9 | |||||
| Unrealized foreign exchange loss (gain) recorded in deferred tax expense | (3.4 | ) | 26.2 | (32.5 | ) | 49.7 | (16.3 | ) | ||
| Other income and mining tax adjustments | (12.0 | ) | (15.7 | ) | (13.4 | ) | (16.4 | ) | (7.0 | ) |
| Adjusted net earnings | ||||||||||
| Adjusted earnings per share - basic | ||||||||||
Cash Flow from Operating Activities before Changes in Working Capital and Cash Taxes
“Cash flow from operating activities before changes in working capital and cash taxes” is a non-GAAP performance measure that could provide an indication of the Company’s ability to generate cash flows from operations, and is calculated by adding back the change in working capital and cash taxes to cash flow from operating activities. “Cash flow from operating activities before changes in working capital and cash taxes” is a non-GAAP financial measure with no standard meaning under IFRS. The following table reconciles this non-GAAP measure to the most directly comparable IFRS measure.
| (in millions) | ||||
| Three Months Ended | Years Ended | |||
| 2025 | 2024 | 2025 | 2024 | |
| Cash flow from operating activities | ||||
| Add: Changes in working capital and taxes paid | 33.8 | 15.7 | 129.0 | 65.1 |
| Cash flow from operating activities before changes in working capital and taxes paid | ||||
Company-wide Free Cash Flow
“Company-wide free cash flow" is a non-GAAP performance measure calculated from cash flow from operating activities, less mineral property, plant and equipment expenditures and non-recurring costs. The Company believes this to be a useful indicator of our ability to operate without reliance on additional borrowing or usage of existing cash company-wide. Company-wide free cash flow is intended to provide additional information only and does not have any standardized meaning under IFRS and may not be comparable to similar measures of performance presented by other mining companies. Company-wide free cash flow should not be considered in isolation or as a substitute for measures of performance prepared in accordance with IFRS.
| (in millions) | ||||||||
| Three Months Ended | Years Ended | |||||||
| 2025 | 2024 | 2025 | 2024 | |||||
| Cash flow from operating activities | 795.3 | |||||||
| Less: mineral property, plant and equipment expenditures | (157.5 | ) | (138.7 | ) | (507.1 | ) | (417.6 | ) |
| Add: early settlement of Argonaut legacy hedges(1) | 113.5 | — | 113.5 | — | ||||
| Less: proceeds from gold prepayment(2) | (50.0 | ) | — | (50.0 | ) | — | ||
| Add: expenditures incurred by Alamos post close of the transaction(3) | — | — | — | 28.8 | ||||
| Company-wide free cash flow | ||||||||
(1) Represents the early settlement of 50,000 ounces under the Argonaut legacy hedge for the first half of 2026.
(2) Reflects the gold sale prepayment for the delivery of 12,255 ounces in the first half of 2026.
(3) Relates to overdue payables at the Magino mine and transaction costs incurred by Argonaut and paid by Alamos.
Mine-site Free Cash Flow
"Mine-site free cash flow" is a non-GAAP financial performance measure calculated as cash flow from operating mine-sites, less mine-site mineral property, plant and equipment expenditures. The Company believes this to be a useful indicator of our ability to operate without reliance on additional borrowing or usage of existing cash. Mine-site free cash flow is intended to provide additional information only and does not have any standardized meaning under IFRS and may not be comparable to similar measures of performance presented by other mining companies. Mine-site free cash flow should not be considered in isolation or as a substitute for measures of performance prepared in accordance with IFRS.
| Consolidated | Three Months Ended | Years Ended | ||||||
| 2025 | 2024 | 2025 | 2024 | |||||
| (in millions) | ||||||||
| Cash flow from operating activities | ||||||||
| Add: operating cash flow used by non-mine site activity(1) | 140.0 | 21.3 | 334.8 | 82.9 | ||||
| Cash flow from operating mine-sites | ||||||||
| Mineral property, plant and equipment expenditure | ||||||||
| Less: capital expenditures from development projects, and corporate | (10.0 | ) | ( | ) | (53.4 | ) | (26.4 | ) |
| Capital expenditure and capital advances from mine-sites | ||||||||
| Total mine-site free cash flow | ||||||||
| Island Gold District Mine-Site Free Cash Flow | Three Months Ended | Years Ended | ||||||
| 2025 | 2024 | 2025 | 2024 | |||||
| (in millions) | ||||||||
| Cash flow from operating activities(1) | ||||||||
| Mineral property, plant and equipment expenditures | (103.1 | ) | (103.2 | ) | (330.0 | ) | (285.0 | ) |
| Mine-site free cash flow | ( | ( | ||||||
| Young-Davidson Mine-Site Free Cash Flow | Three Months Ended | Years Ended | ||||||
| 2025 | 2024 | 2025 | 2024 | |||||
| (in millions) | ||||||||
| Cash flow from operating activities(1) | ||||||||
| Mineral property, plant and equipment expenditures | (33.2 | ) | (21.3 | ) | (93.6 | ) | (86.1 | ) |
| Mine-site free cash flow | ||||||||
| Mulatos District Free Cash Flow | Three Months Ended | Years Ended | ||||||
| 2025 | 2024 | 2025 | 2024 | |||||
| (in millions) | ||||||||
| Cash flow from operating activities | ||||||||
| Mineral property, plant and equipment expenditure | (11.2 | ) | (5.3 | ) | (30.1 | ) | (20.1 | ) |
| Mine-site free cash flow | ||||||||
(1) Cash from operating activities for the Canadian operations excludes the impact of the 12,346 ounces and 49,384 ounces delivered into the gold prepayment arrangement for the three months and year ended
(2) Comparative figures reflect the inclusion of the
Total Cash Costs per ounce
Total cash costs per ounce is a non-GAAP term typically used by gold mining companies to assess the level of gross margin available to the Company by subtracting these costs from the unit price realized during the period. This non-GAAP term is also used to assess the ability of a mining company to generate cash flow from operating activities. Total cash costs per ounce includes mining and processing costs plus applicable royalties, and net of by-product revenue and net realizable value adjustments. Total cash costs per ounce is exclusive of exploration costs. As well, the Company excludes mark-to-market adjustments for the revaluation of previously issued share-based compensation, therefore, total cash costs will incorporate the cost of long term incentives associated with the grant date fair value for instruments issued.
Total cash costs per ounce is intended to provide additional information only and does not have any standardized meaning under IFRS and may not be comparable to similar measures presented by other mining companies. It should not be considered in isolation or as a substitute for measures of performance prepared in accordance with IFRS. The measure is not necessarily indicative of cash flow from operating activities under IFRS or operating costs presented under IFRS.
All-in Sustaining Costs per ounce and Mine-site All-in Sustaining Costs
The Company adopted an “all-in sustaining costs per ounce” non-GAAP performance measure in accordance with the
For the purposes of calculating "mine-site all-in sustaining costs" at the individual mine-sites, the Company does not include an allocation of corporate and administrative costs and share-based compensation, as detailed in the reconciliations below.
Sustaining capital expenditures are expenditures that do not increase annual gold ounce production at a mine site and excludes all expenditures at the Company’s development projects as well as certain expenditures at the Company’s operating sites that are deemed expansionary in nature. Non-sustaining capital expenditures or growth capital are expenditures primarily incurred at development projects and costs related to major projects at existing operations, where these projects will materially benefit the mine site. Capitalized exploration expenditures are expenditures that meet the IFRS definition for capitalization and are incurred to further expand the known Mineral Reserves and Resources at existing operations or development projects. For each mine-site reconciliation, corporate and administrative costs, and non-site specific costs are not included in the all-in sustaining cost per ounce calculation.
All-in sustaining costs per gold ounce is intended to provide additional information only and does not have any standardized meaning under IFRS and may not be comparable to similar measures presented by other mining companies. It should not be considered in isolation or as a substitute for measures of performance prepared in accordance with IFRS. The measure is not necessarily indicative of cash flow from operating activities under IFRS or operating costs presented under IFRS.
Total Cash Costs and All-in Sustaining Costs per Ounce Reconciliation Tables
The following tables reconciles these non-GAAP measures to the most directly comparable IFRS measures on a Company-wide and individual mine-site basis.
| Total Cash Costs and AISC Reconciliation - Company-wide | ||||||||||
| Three Months Ended | Years Ended | |||||||||
| 2025 | 2024 | 2025 | 2024 | 2023 | ||||||
| (in millions, except ounces and per ounce figures) | ||||||||||
| Mining and processing | ||||||||||
| Share-based compensation mark-to-market allocated to sites (included in mining and processing)(3) | (0.8 | ) | — | (10.1 | ) | — | — | |||
| Silver by-product credits | (7.2 | ) | (4.0 | ) | (17.6 | ) | (13.4 | ) | — | |
| Royalties | 8.4 | 4.7 | 27.0 | 13.8 | 10.2 | |||||
| Total cash costs | 157.9 | 138.6 | 572.1 | 519.3 | 447.5 | |||||
| Gold ounces sold | 142,147 | 141,258 | 531,230 | 560,234 | 526,258 | |||||
| Total cash costs per ounce | ||||||||||
| Total cash costs | ||||||||||
| Corporate and administrative(1) | 9.7 | 9.1 | 39.3 | 32.6 | 27.6 | |||||
| Sustaining capital expenditures(2) | 49.5 | 30.0 | 144.6 | 110.1 | 104.2 | |||||
| Sustaining finance leases | 3.9 | 5.2 | 16.5 | 10.6 | — | |||||
| Interest of sustaining finance leases | 0.6 | — | 2.3 | — | ||||||
| Share-based compensation | 7.9 | 1.9 | 55.0 | 31.7 | 21.7 | |||||
| Share-based compensation mark-to-market allocated to corporate(3) | (6.3 | ) | (0.8 | ) | (31.7 | ) | (16.4 | ) | (7.4 | ) |
| Sustaining exploration | 0.5 | 1.2 | 2.0 | 4.4 | 2.7 | |||||
| Accretion of decommissioning liabilities | 2.6 | 2.3 | 9.6 | 8.9 | 6.8 | |||||
| Total all-in sustaining costs | ||||||||||
| Gold ounces sold | 142,147 | 141,258 | 531,230 | 560,234 | 526,258 | |||||
| All-in sustaining costs per ounce | ||||||||||
(1) Corporate and administrative expenses exclude expenses incurred at development properties.
(2) Comparative figures reflect the inclusion of the
(3) Share-based compensation included in total cash costs and AISC excludes the impact of mark-to-market adjustments for changes in the Company’s share price in the periods allocated to sites (included in mining and processing costs) and corporate head office (included in share-based compensation expense). The prior year comparatives have been restated to exclude the impact. See Note 19 (d) of the consolidated financial statements for the years ended
(4) Sustaining capital expenditures are defined as those expenditures which do not increase annual gold ounce production at a mine site and exclude all expenditures at growth projects and certain expenditures at operating sites which are deemed expansionary in nature. Total sustaining capital expenditures for the periods are as follow:
| Three Months Ended | Years Ended | |||||||||
| 2025 | 2024 | 2025 | 2024 | 2023 | ||||||
| (in millions) | ||||||||||
| Mineral property, plant and equipment expenditures | ||||||||||
| Less: non-sustaining capital expenditures at: | ||||||||||
| (79.4 | ) | (85.1 | ) | (246.8 | ) | (225.0 | ) | (189.2 | ) | |
| (7.9 | ) | (10.7 | ) | (34.5 | ) | (40.4 | ) | (18.2 | ) | |
| (10.7 | ) | (4.0 | ) | (27.8 | ) | (15.7 | ) | (19.1 | ) | |
| Corporate and other | (10.0 | ) | (8.9 | ) | (53.4 | ) | (26.4 | ) | (18.2 | ) |
| Sustaining capital expenditures | ||||||||||
| Island Gold District Total Cash Costs and Mine-site AISC Reconciliation | ||||||||
| Three Months Ended | Years Ended | |||||||
| 2025 | 2024 | 2025 | 2024 | |||||
| (in millions, except ounces and per ounce figures) | ||||||||
| Mining and processing | ||||||||
| Share-based compensation mark-to-market allocated to sites (included in mining and processing)(1) | — | — | (3.5 | ) | — | |||
| Silver by-product credits | (1.2 | ) | (0.5 | ) | (2.3 | ) | (1.2 | ) |
| Royalties | 4.4 | 2.4 | 14.1 | 5.2 | ||||
| Total cash costs | ||||||||
| Gold ounces sold | 62,002 | 56,100 | 241,359 | 183,441 | ||||
| Mine-site total cash costs per ounce | ||||||||
| Total cash costs | ||||||||
| Sustaining capital expenditures | 23.7 | 18.1 | 83.2 | 60.0 | ||||
| Sustaining finance leases | 3.9 | 5.2 | 16.5 | 10.6 | ||||
| Interest on sustaining finance leases | 0.6 | — | 2.3 | — | ||||
| Sustaining exploration | — | 0.4 | — | 0.7 | ||||
| Accretion of decommissioning liabilities | 0.4 | 0.5 | 1.5 | 1.2 | ||||
| Total all-in sustaining costs | ||||||||
| Gold ounces sold | 62,002 | 56,100 | 241,359 | 183,441 | ||||
| Mine-site all-in sustaining costs per ounce | ||||||||
| Young-Davidson Total Cash Costs and Mine-site AISC Reconciliation | ||||||||
| Three Months Ended | Years Ended | |||||||
| 2025 | 2024 | 2025 | 2024 | |||||
| (in millions, except ounces and per ounce figures) | ||||||||
| Mining and processing | ||||||||
| Share-based compensation mark-to-market allocated to sites (included in mining and processing)(1) | (0.3 | ) | — | (3.4 | ) | — | ||
| Silver by-product credits | (2.4 | ) | (0.9 | ) | (4.6 | ) | (3.1 | ) |
| Royalties | 2.4 | 1.8 | 8.0 | 6.2 | ||||
| Total cash costs | ||||||||
| Gold ounces sold | 42,287 | 45,441 | 153,382 | 173,274 | ||||
| Total cash costs per ounce | ||||||||
| Total cash costs | ||||||||
| Sustaining capital expenditures | 25.3 | 10.6 | 59.1 | 45.7 | ||||
| Accretion of decommissioning liabilities | 0.1 | 0.1 | 0.5 | 0.5 | ||||
| Total all-in sustaining costs | ||||||||
| Gold ounces sold | 42,287 | 45,441 | 153,382 | 173,274 | ||||
| Mine-site all-in sustaining costs per ounce | ||||||||
| Mulatos District Total Cash Costs and Mine-site AISC Reconciliation | ||||||||
| Three Months Ended | Years Ended | |||||||
| 2025 | 2024 | 2025 | 2024 | |||||
| (in millions, except ounces and per ounce figures) | ||||||||
| Mining and processing | ||||||||
| Share-based compensation mark-to-market allocated to sites (included in mining and processing)(1) | (0.5 | ) | — | (3.2 | ) | — | ||
| Silver by-product credits | (3.6 | ) | (2.5 | ) | (10.7 | ) | (9.1 | ) |
| Royalties | 1.6 | 0.5 | 4.9 | 2.4 | ||||
| Total cash costs | ||||||||
| Gold ounces sold | 37,858 | 39,717 | 136,489 | 203,519 | ||||
| Total cash costs per ounce | ||||||||
| Total cash costs | ||||||||
| Sustaining capital expenditures | 0.5 | 1.3 | 2.3 | 4.4 | ||||
| Sustaining exploration | — | 0.4 | — | 2.1 | ||||
| Accretion of decommissioning liabilities | 1.8 | 1.7 | 7.3 | 7.0 | ||||
| Total all-in sustaining costs | ||||||||
| Gold ounces sold | 37,858 | 39,717 | 136,489 | 203,519 | ||||
| Mine-site all-in sustaining costs per ounce | ||||||||
(1) Share-based compensation included in mine-site total cash costs and mine-site AISC excludes the impact of mark-to-market adjustments for changes in the Company’s share price in the periods allocated to sites included in mining and processing costs.
Adjusted EBITDA
Adjusted EBITDA represents net earnings before interest, taxes, depreciation, and amortization and removes the effects of certain items that the Company believes are not reflective of the Company's underlying performance for the reporting period. The measure also removes the impact of non-cash items such as impairment loss charges or reversals, and realized and unrealized gains or losses on derivative financial instruments. Adjusted EBITDA is an indicator of the Company’s ability to generate liquidity by producing operating cash flow to fund working capital needs, service debt obligations, and fund capital expenditures.
Adjusted EBITDA does not have any standardized meaning under IFRS and may not be comparable to similar measures presented by other mining companies. It should not be considered in isolation or as a substitute for measures of performance prepared in accordance with IFRS. The following table reconciles this non-GAAP measure to the most directly comparable IFRS measure.
| (in millions) | ||||||||
| Three Months Ended | Years Ended | |||||||
| 2025 | 2024 | 2025 | 2024 | |||||
| Net earnings | ||||||||
| Add back: | ||||||||
| Reversal of impairment | — | — | (218.8 | ) | (57.1 | ) | ||
| Gain on sale of assets | (231.0 | ) | — | (231.0 | ) | — | ||
| Finance (income) expense | (5.2 | ) | (2.4 | ) | (6.4 | ) | 3.8 | |
| Amortization | 53.6 | 58.3 | 209.7 | 218.4 | ||||
| Unrealized loss on commodity derivatives(1) | 56.3 | (5.9 | ) | 230.5 | 24.2 | |||
| Deferred income tax (recovery) expense | 48.1 | 22.6 | 83.4 | 119.2 | ||||
| Current income tax expense | 27.9 | 47.0 | 120.5 | 98.7 | ||||
| EBITDA | ||||||||
Additional GAAP Measures
Additional GAAP measures are presented on the Company’s condensed interim consolidated financial statements and are not meant to be a substitute for other subtotals or totals presented in accordance with IFRS, but rather should be evaluated in conjunction with such IFRS measures. The following additional GAAP measures are used and are intended to provide an indication of the Company’s mine and operating performance:
- Earnings from operations - represents the amount of earnings before net finance expense/income, foreign exchange loss/gain, other loss, unrealized loss on commodity derivatives and income tax expense
Consolidated Statements of Financial Position, Comprehensive
Income, and Cash Flow
Consolidated Statements of Financial Position
(Stated in millions of
| A S S E T S | |||
| Current Assets | |||
| Cash and cash equivalents | |||
| Equity securities | 58.9 | 24.0 | |
| Deferred payment consideration | 157.1 | — | |
| Amounts receivable | 45.0 | 46.7 | |
| Inventories | 225.4 | 232.8 | |
| Other current assets | 26.0 | 17.9 | |
| Total Current Assets | 1,135.5 | 648.6 | |
| Non-Current Assets | |||
| Mineral property, plant and equipment | 4,957.5 | 4,618.0 | |
| Deferred income taxes | 34.0 | 12.2 | |
| Inventories | 84.9 | 25.3 | |
| Deferred payment consideration | 142.0 | — | |
| Other non-current assets | 30.7 | 32.0 | |
| Total Assets | |||
| L I A B I L I T I E S | |||
| Current Liabilities | |||
| Accounts payable and accrued liabilities | |||
| Derivative liabilities | 128.0 | 9.1 | |
| Deferred revenue | 50.0 | 116.6 | |
| Income taxes payable | 53.6 | 50.5 | |
| Current portion of lease liabilities | 11.8 | 15.2 | |
| Current portion of decommissioning liabilities | 8.1 | 6.5 | |
| Total Current Liabilities | 567.6 | 430.9 | |
| Non-Current Liabilities | |||
| Deferred income taxes | 873.3 | 760.6 | |
| Derivative liabilities | 129.1 | 140.0 | |
| Debt and financing obligations | 200.0 | 250.0 | |
| Lease liabilities | 11.2 | 21.4 | |
| Decommissioning liabilities | 153.4 | 145.1 | |
| Other non-current liabilities | 4.2 | 3.9 | |
| Total Liabilities | 1,938.8 | 1,751.9 | |
| E Q U I T Y | |||
| Share capital | |||
| Contributed surplus | 87.7 | 89.3 | |
| Accumulated other comprehensive income (loss) | 0.3 | (37.4) | |
| Retained earnings (deficit) | 217.2 | (606.2) | |
| Total Equity | 4,445.8 | 3,584.2 | |
| Total Liabilities and Equity |
Consolidated Statements of Comprehensive Income
(Stated in millions of
| For three months ended | For twelve months ended | |||||||||
| 2025 | 2024 | 2025 | 2024 | |||||||
| OPERATING REVENUES | ||||||||||
| COST OF SALES | ||||||||||
| Mining and processing | 157.5 | 137.9 | 572.8 | 518.9 | ||||||
| Royalties | 8.4 | 4.7 | 27.0 | 13.8 | ||||||
| Amortization | 53.6 | 58.3 | 209.7 | 218.4 | ||||||
| 219.5 | 200.9 | 809.5 | 751.1 | |||||||
| EXPENSES | ||||||||||
| Exploration | 7.3 | 5.5 | 26.3 | 26.7 | ||||||
| Corporate and administrative | 9.7 | 9.1 | 39.3 | 32.6 | ||||||
| Share-based compensation | 7.9 | 1.9 | 55.0 | 31.7 | ||||||
| Reversal of impairment | — | — | (218.8 | ) | (57.1 | ) | ||||
| 244.4 | 217.4 | 711.3 | 785.0 | |||||||
| EARNINGS FROM OPERATIONS | 330.9 | 158.4 | 1,097.5 | 561.9 | ||||||
| OTHER EXPENSES | ||||||||||
| Gain on sale of assets | 231.0 | — | 231.0 | — | ||||||
| (Loss) gain on commodity derivatives | (56.3 | ) | 5.9 | (230.5 | ) | (24.2 | ) | |||
| Finance income (expense) | 5.2 | 2.4 | 6.4 | (3.8 | ) | |||||
| Foreign exchange gain (loss) | 2.6 | 6.6 | (5.1 | ) | 8.0 | |||||
| Other loss | (2.5 | ) | (16.1 | ) | (9.6 | ) | (39.7 | ) | ||
| EARNINGS BEFORE INCOME | ||||||||||
| INCOME TAXES | ||||||||||
| Current income tax expense | (27.9 | ) | (47.0 | ) | (120.5 | ) | (98.7 | ) | ||
| Deferred income tax expense | (48.1 | ) | (22.6 | ) | (83.4 | ) | (119.2 | ) | ||
| NET EARNINGS | ||||||||||
| Items that may be subsequently reclassified to net earnings: | ||||||||||
| Net change in fair value of currency hedging instruments, net of taxes | 1.1 | (6.0 | ) | 8.2 | (11.7 | ) | ||||
| Net change in fair value of fuel hedging instruments, net of taxes | — | 0.2 | — | (0.1 | ) | |||||
| Items that will not be reclassified to net earnings: | ||||||||||
| Unrealized gain on equity securities, net of taxes | 6.5 | 1.4 | 34.9 | 26.4 | ||||||
| Total other comprehensive income (loss) | ( | |||||||||
| COMPREHENSIVE INCOME | ||||||||||
| EARNINGS PER SHARE | ||||||||||
| – basic | ||||||||||
| – diluted | ||||||||||
Consolidated Statements of Cash Flows
(Stated in millions of
| For three months ended | For twelve months ended | ||||||||||
| 2025 | 2024 | 2025 | 2024 | ||||||||
| CASH PROVIDED BY (USED IN): | |||||||||||
| OPERATING ACTIVITIES | |||||||||||
| Net earnings | |||||||||||
| Adjustments for items not involving cash: | |||||||||||
| Amortization | 53.6 | 58.3 | 209.7 | 218.4 | |||||||
| Reversal of Impairment | — | — | (218.8 | ) | (57.1 | ) | |||||
| Foreign exchange (gain) loss | (2.6 | ) | (6.6 | ) | 5.1 | (8.0 | ) | ||||
| Current income tax expense | 27.9 | 47.0 | 120.5 | 98.7 | |||||||
| Deferred income tax expense | 48.1 | 22.6 | 83.4 | 119.2 | |||||||
| Share-based compensation | 9.6 | 1.9 | 67.6 | 31.7 | |||||||
| Finance (income) expense | (5.2 | ) | (2.4 | ) | (6.4 | ) | 3.8 | ||||
| Loss (gain) on commodity derivatives | 56.3 | (5.9 | ) | 230.5 | 24.2 | ||||||
| Gain on sale of assets | (231.0 | ) | — | (231.0 | ) | — | |||||
| Deferred revenue recognized | (31.1 | ) | — | (124.6 | ) | — | |||||
| Settlement of Argonaut legacy gold hedges | (113.5 | ) | — | (113.5 | ) | — | |||||
| Proceeds from gold sale prepayment | 50.0 | — | 50.0 | — | |||||||
| Other items | (12.3 | ) | 5.4 | (34.0 | ) | 11.0 | |||||
| Changes in working capital and taxes paid | (33.8 | ) | (15.7 | ) | (129.0 | ) | (65.1 | ) | |||
| 250.9 | 192.2 | 795.3 | 661.1 | ||||||||
| INVESTING ACTIVITIES | |||||||||||
| Mineral property, plant and equipment | (157.5 | ) | (138.7 | ) | (507.1 | ) | (417.6 | ) | |||
| Interest capitalized to mineral, property and equipment | (3.9 | ) | (7.7 | ) | (17.1 | ) | (7.7 | ) | |||
| Repurchase of royalty on | — | — | (2.0 | ) | — | ||||||
| Investment in Argonaut, net of cash acquired | — | — | — | (30.2 | ) | ||||||
| Proceeds from sale of assets net of transaction costs | 160.0 | — | 160.0 | — | |||||||
| Proceeds from disposition of equity securities | 2.4 | 1.0 | 9.8 | 1.0 | |||||||
| Investment in equity securities | (0.3 | ) | (0.5 | ) | (0.5 | ) | (11.6 | ) | |||
| Transaction costs arising on asset disposition and acquisitions | 0.2 | — | — | (1.0 | ) | ||||||
| 0.9 | (145.9 | ) | (356.9 | ) | (467.1 | ) | |||||
| FINANCING ACTIVITIES | |||||||||||
| Proceeds from draw down of credit facility | — | — | — | 250.0 | |||||||
| Repayment of credit facility | (50.0 | ) | — | (50.0 | ) | — | |||||
| Repayment of debt and accrued interest assumed on Argonaut acquisition | — | — | — | (308.3 | ) | ||||||
| Dividends paid | (10.1 | ) | (9.1 | ) | (39.5 | ) | (35.1 | ) | |||
| Repurchase and cancellation of common shares | (28.8 | ) | — | (38.8 | ) | — | |||||
| Credit facility transaction, standby fees and interest | (0.4 | ) | 2.9 | (2.6 | ) | (2.7 | ) | ||||
| Lease payments | (3.9 | ) | (5.2 | ) | (16.5 | ) | (10.6 | ) | |||
| Proceeds from issuance of flow-through shares | 1.0 | — | 4.1 | 10.5 | |||||||
| Proceeds from the exercise of options and warrants | — | 1.0 | — | 6.8 | |||||||
| (92.2 | ) | (10.4 | ) | (143.3 | ) | (89.4 | ) | ||||
| Effect of exchange rates on cash and cash equivalents | 0.4 | (0.3 | ) | 0.8 | (2.2 | ) | |||||
| Net increase in cash and cash equivalents | 160.0 | 35.6 | 295.9 | 102.4 | |||||||
| Cash and cash equivalents - beginning of period | 463.1 | 291.6 | 327.2 | 224.8 | |||||||
| CASH AND CASH EQUIVALENTS - END OF PERIOD | |||||||||||
Photos accompanying this announcement are available at:
https://www.globenewswire.com/NewsRoom/AttachmentNg/c1fa006e-6431-495f-9f3f-d46c24eb2b52
https://www.globenewswire.com/NewsRoom/AttachmentNg/3b3c14a2-117a-4522-bb4e-9e9a447590e2
https://www.globenewswire.com/NewsRoom/AttachmentNg/13514559-f40b-4caf-a3e2-913bf0d10a2c
https://www.globenewswire.com/NewsRoom/AttachmentNg/1445700d-1b4e-41be-8e7a-60a1c87242a5


Island Gold shaft site area - February 2026

Island Gold shaft site area - February 2026
Island Gold Paste Plant _ February 2026
Island Gold Paste Plant _ February 2026
Island Gold 1350L shaft station (depth of 1,350 m) - January 2026

Island Gold 1350L shaft station (depth of 1,350 m) - January 2026
Magino mill expansion - February 2026