Operations
- Site operating cash flow of
$189 million for the quarter. - Q3 FY26 record gold production of 45,776 AuEq oz @ AISC of
$2,928 /AuEq oz.1,2 - Full Year Group Guidance remains at 160-175kozs AuEq at AISC
$2,600-2,900 /AuEq oz reflects production from Costerfield and Björkdal fromJuly 2025 .3
Exploration
- At Costerfield, extension and infill drilling above the current workings at Youle and Shepherd have defined 25 additional veins within the Kendall prospect in the immediate surrounds of the historic Costerfield mine. Highlighted results include 132.2 g/t gold and 19.8 % antimony over 1.94 m with an estimated true width ETW of 1.04 m, and 267.5 g/t gold and 5.6 % antimony over 2.3 m (ETW 1.22 m).4
- At
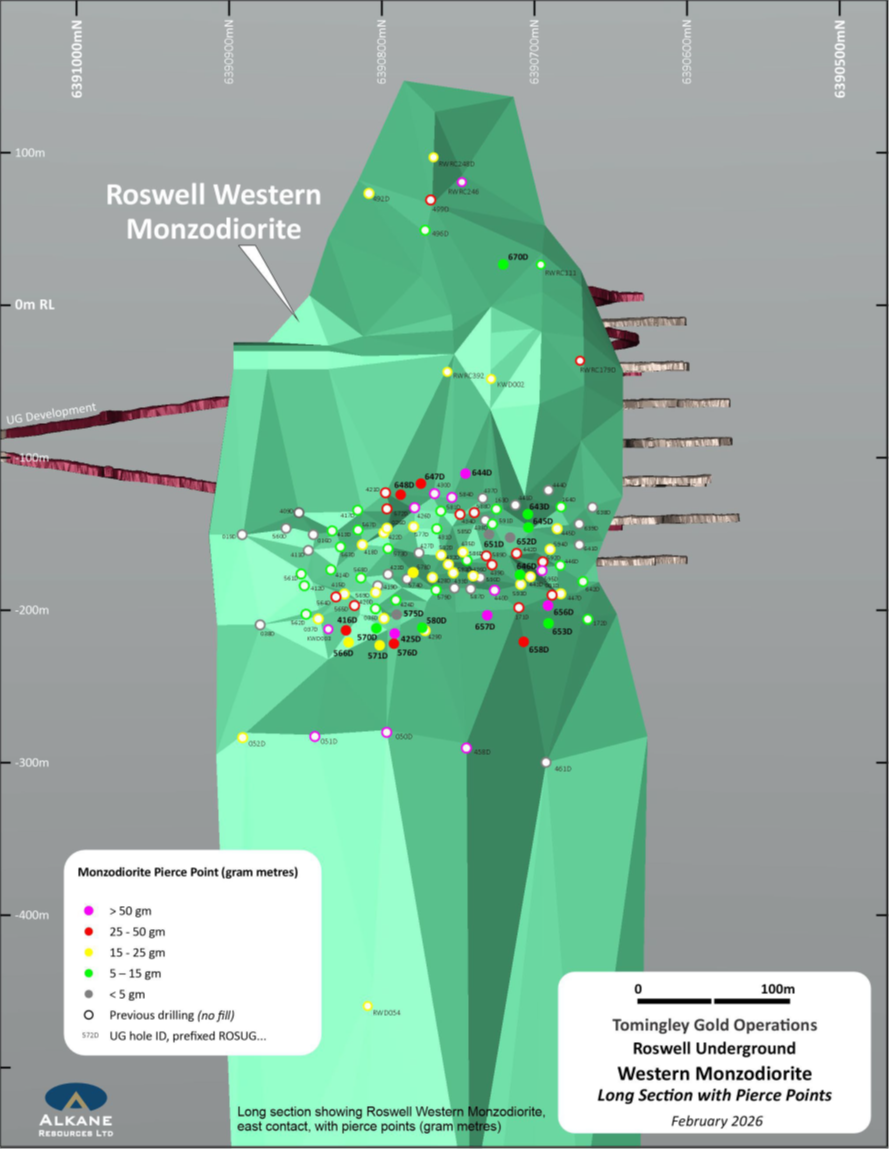
Tomingley , deep drilling identified a seismic reflector as a gold bearing structure 400m below the Roswell current resources.5
Finance and Corporate
- Gold equivalent sales for the quarter of 43,373 ounces1 for revenue of
$275 million at an average gold price of$6 ,330oz and an average antimony price of$34,394 /t. - Cash, bullion and listed investment balance of
$374 million after$16 million of corporate income tax payments during the quarter. - 8,700 ounces of hedges filled during the quarter.
- Executed
$110 million revolving credit facility and$40 million contingent instrument facility during the quarter. - Post quarter end,
S&P Dow Jones Indices announced that they would include Alkane in the S&P/ASX 200 effective prior to the open of trading on Wednesday,22 April 2026 .
Managing Director and CEO,
GROUP SUMMARY STATUTORY REPORTING PERIOD1,2
Gold-Antimony Production
Alkane produced 44,669 ounces of gold and 377 tonnes of antimony in Q3 FY26, its highest quarterly gold and antimony production yet, resulting in a Group record quarterly production of 45,776 gold equivalent ounces (Q2 FY26: 43,663 AuEq oz) at an AISC of
Production during the quarter was higher than Q2 FY26, driven by improved output at Björkdal due to increased mill grades coupled with stable quarter-over-quarter production at
Alkane processed 674,011 tonnes of ore in total at an average gold grade of 2.40g/t Au producing 44,669oz of gold.
| Table 1: | |||||||||
| Operations | Units | Costerfield | Björkdal | Total | |||||
| Ore mined | t | 36,086 | 338,016 | 246,019 | 620,121 | ||||
| Mined ore gold grade | g/t | 9.42 | 2.32 | 1.32 | 2.33 | ||||
| Mined ore antimony grade | % | 1.12 | - | - | 1.12 | ||||
| Processed ore | t | 35,598 | 314,997 | 323,417 | 674,011 | ||||
| Processed ore - milled head grade gold | g/t | 10.21 | 2.41 | 1.52 | 2.40 | ||||
| Processed ore - milled head grade antimony | % | 1.21 | - | - | 1.21 | ||||
| Recovery gold | % | 93.58 | % | 90.11 | % | 90.43 | % | 91.38 | % |
| Recovery antimony | % | 85.93 | % | - | - | 85.93 | % | ||
| Gold produced | oz | 10,584 | 21,652 | 12,433 | 44,669 | ||||
| Antimony produced | t | 377 | - | - | 377 | ||||
| Gold equivalent produced | oz | 11,691 | 21,652 | 12,433 | 45,776 | ||||
| Ore stockpiles - contained gold | oz | 7,520 | 8,363 | 18,922 | 34,805 | ||||
| Ore stockpiles - contained antimony | t | 301 | - | - | 301 | ||||
| Gold equivalent in circuit, finished concentrate and bullion | oz | 3,496 | 8,599 | 2,151 | 14,246 | ||||
| Table 2: FY26 statutory reporting period operational performance summary6 | |||||||||
| Operations | Units | Costerfield | Björkdal | Total | |||||
| Ore mined | t | 100,616 | 914,787 | 665,539 | 1,680,942 | ||||
| Mined ore gold grade | g/t | 8.77 | 2.39 | 1.29 | 2.33 | ||||
| Mined ore antimony grade | % | 0.96 | - | - | 0.96 | ||||
| Processed ore | t | 93,000 | 948,818 | 886,857 | 1,928,676 | ||||
| Processed ore - milled head grade gold | g/t | 9.87 | 2.35 | 1.19 | 2.18 | ||||
| Processed ore - milled head grade antimony | % | 0.97 | - | - | 0.97 | ||||
| Recovery gold | % | 93.50 | % | 88.58 | % | 88.09 | % | 90.05 | % |
| Recovery antimony | % | 85.26 | % | - | - | 85.26 | % | ||
| Gold produced | oz | 27,017 | 62,076 | 28,308 | 117,401 | ||||
| Antimony produced | t | 768 | - | - | 768 | ||||
| Gold equivalent produced | oz | 29,566 | 62,076 | 28,308 | 119,950 | ||||
| Ore stockpiles - contained gold | oz | 7,520 | 8,363 | 18,922 | 34,805 | ||||
| Ore stockpiles - contained antimony | t | 301 | - | - | 301 | ||||
| Gold equivalent in circuit, finished concentrate and bullion | oz | 3,496 | 8,599 | 2,151 | 14,246 | ||||
Revenue
Gold equivalent sales for the quarter of 43,373 ounces1 (Q2 FY26: 44,084 AuEq oz) for revenue of
Björkdal´s and Costerfield´s average realised gold price at
Operating Costs, Cash Operating Costs per Gold Equivalent Ounce Produced, All-In Sustaining Costs (“AISC”) per Gold Equivalent Ounce Produced and Capital Expenditures
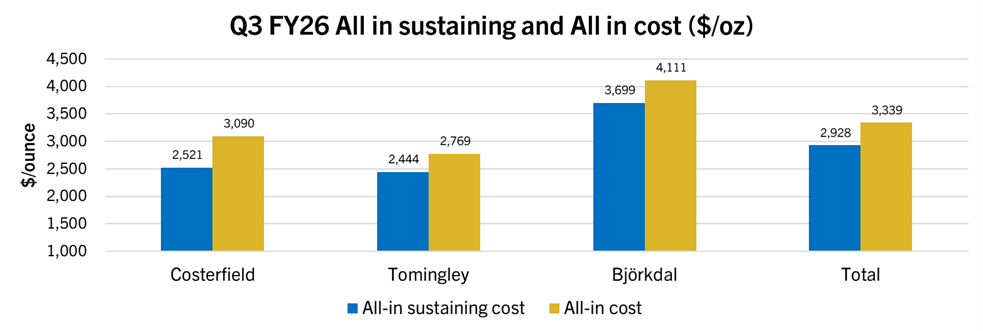
Group AISC was
Total operational sustaining, growth and exploration capital expenditure during Q3 FY26 was
Sustaining capital was
Growth capital of
Exploration expenditure of
| Table 3: | ||||||||
| Financials | Units | Costerfield | Björkdal | Total | ||||
| Gold equivalent sold | oz | 12,190 | 18,949 | 12,234 | 43,373 | |||
| Average realised gold price | $/oz | 7,204 | 5,096 | 7,430 | 6,330 | |||
| Average realised antimony price | $/t | 34,394 | - | - | 34,394 | |||
| Revenue for the quarter | $'000 | 86,705 | 96,570 | 81,570 | 264,845 | |||
| Gold provisional pricing adjustments | $'000 | 1,185 | - | 9,332 | 10,518 | |||
| Antimony provisional pricing adjustments | $'000 | (327 | ) | - | - | (327 | ) | |
| Total revenue from mining operations | $'000 | 87,564 | 96,570 | 90,902 | 275,036 | |||
| Mining | $'000 | 11,847 | 24,987 | 19,764 | 56,598 | |||
| Processing | $'000 | 3,605 | 15,460 | 7,138 | 26,203 | |||
| G&A | $'000 | 2,870 | 3,318 | 4,261 | 10,449 | |||
| Cash cost | $'000 | 18,322 | 43,765 | 31,163 | 93,250 | |||
| Inventory movements | $'000 | 3,702 | (773 | ) | 191 | 3,120 | ||
| Royalties | $'000 | 2,342 | 4,015 | 100 | 6,457 | |||
| Corporate costs | $'000 | - | - | - | 5,635 | |||
| Rehabilitation | $'000 | 557 | 610 | 87 | 1,255 | |||
| Sustaining Capital | $'000 | 4,525 | 5,298 | 14,453 | 24,276 | |||
| All-in sustaining cost | $'000 | 29,450 | 52,914 | 45,994 | 133,993 | |||
| Exploration | $'000 | 6,645 | 100 | 2,790 | 9,536 | |||
| Growth capital | $'000 | 28 | 6,936 | 2,333 | 9,297 | |||
| All-in cost | $'000 | 36,123 | 59,950 | 51,117 | 152,826 | |||
| Gold produced | oz | 10,584 | 21,652 | 12,433 | 44,669 | |||
| Antimony produced | t | 377 | - | - | 377 | |||
| Gold equivalent produced | oz | 11,691 | 21,652 | 12,433 | 45,776 | |||
| Cash cost | $/oz | 1,567 | 2,021 | 2,506 | 2,037 | |||
| All-in sustaining cost | $/oz | 2,519 | 2,444 | 3,699 | 2,927 | |||
| All-in cost | $/oz | 3,090 | 2,769 | 4,111 | 3,339 | |||
| Mine operating cash flow | $'000 | 80,130 | 54,372 | 54,724 | 189,227 | |||
| Table 4: FY26 statutory reporting period financial performance summary | ||||||||
| Financials | Units | Costerfield | Björkdal | Total | ||||
| Gold equivalent sold | oz | 29,880 | 59,896 | 27,691 | 117,467 | |||
| Average realised gold price | $/oz | 6,522 | 4,828 | 7,016 | 5,758 | |||
| Average realised antimony price | $/t | 38,578 | - | - | 38,578 | |||
| Revenue for the quarter | $'000 | 194,092 | 289,161 | 170,783 | 654,036 | |||
| Gold provisional pricing adjustments | $'000 | 2,921 | - | 23,496 | 26,417 | |||
| Antimony provisional pricing adjustments | $'000 | (1,467 | ) | - | - | (1,467 | ) | |
| Total revenue from mining operations | $'000 | 195,546 | 289,161 | 194,279 | 678,986 | |||
| Mining | $'000 | 31,340 | 71,084 | 47,026 | 149,450 | |||
| Processing | $'000 | 9,889 | 41,784 | 18,499 | 70,172 | |||
| G&A | $'000 | 9,671 | 9,771 | 11,201 | 30,643 | |||
| Cash cost | $'000 | 50,901 | 122,638 | 76,726 | 250,265 | |||
| Inventory movements | $'000 | 2,986 | 141 | (1,453 | ) | 1,674 | ||
| Royalties | $'000 | 5,248 | 10,426 | 264 | 15,938 | |||
| Corporate costs | $'000 | - | - | - | 14,261 | |||
| Rehabilitation | $'000 | 1,597 | 2,032 | 201 | 3,831 | |||
| Sustaining Capital | $'000 | 10,183 | 14,808 | 34,865 | 59,856 | |||
| All-in sustaining cost | $'000 | 70,914 | 150,046 | 110,603 | 345,824 | |||
| Exploration | $'000 | 16,227 | 1,495 | 5,463 | 23,185 | |||
| Growth capital | $'000 | 1,537 | 19,354 | 3,972 | 24,863 | |||
| All-in cost | $'000 | 88,678 | 170,895 | 120,039 | 393,872 | |||
| Gold produced | oz | 27,017 | 62,076 | 28,308 | 117,401 | |||
| Antimony produced | t | 768 | - | - | 768 | |||
| Gold equivalent produced | oz | 29,566 | 62,076 | 28,308 | 119,950 | |||
| Cash cost | $/oz | 1,722 | 1,976 | 2,710 | 2,086 | |||
| All-in sustaining cost | $/oz | 2,399 | 2,417 | 3,907 | 2,883 | |||
| All-in cost | $/oz | 2,999 | 2,753 | 4,240 | 3,284 | |||
| Mine operating cash flow | $'000 | 130,141 | 160,783 | 106,012 | 396,936 | |||
Cash flow
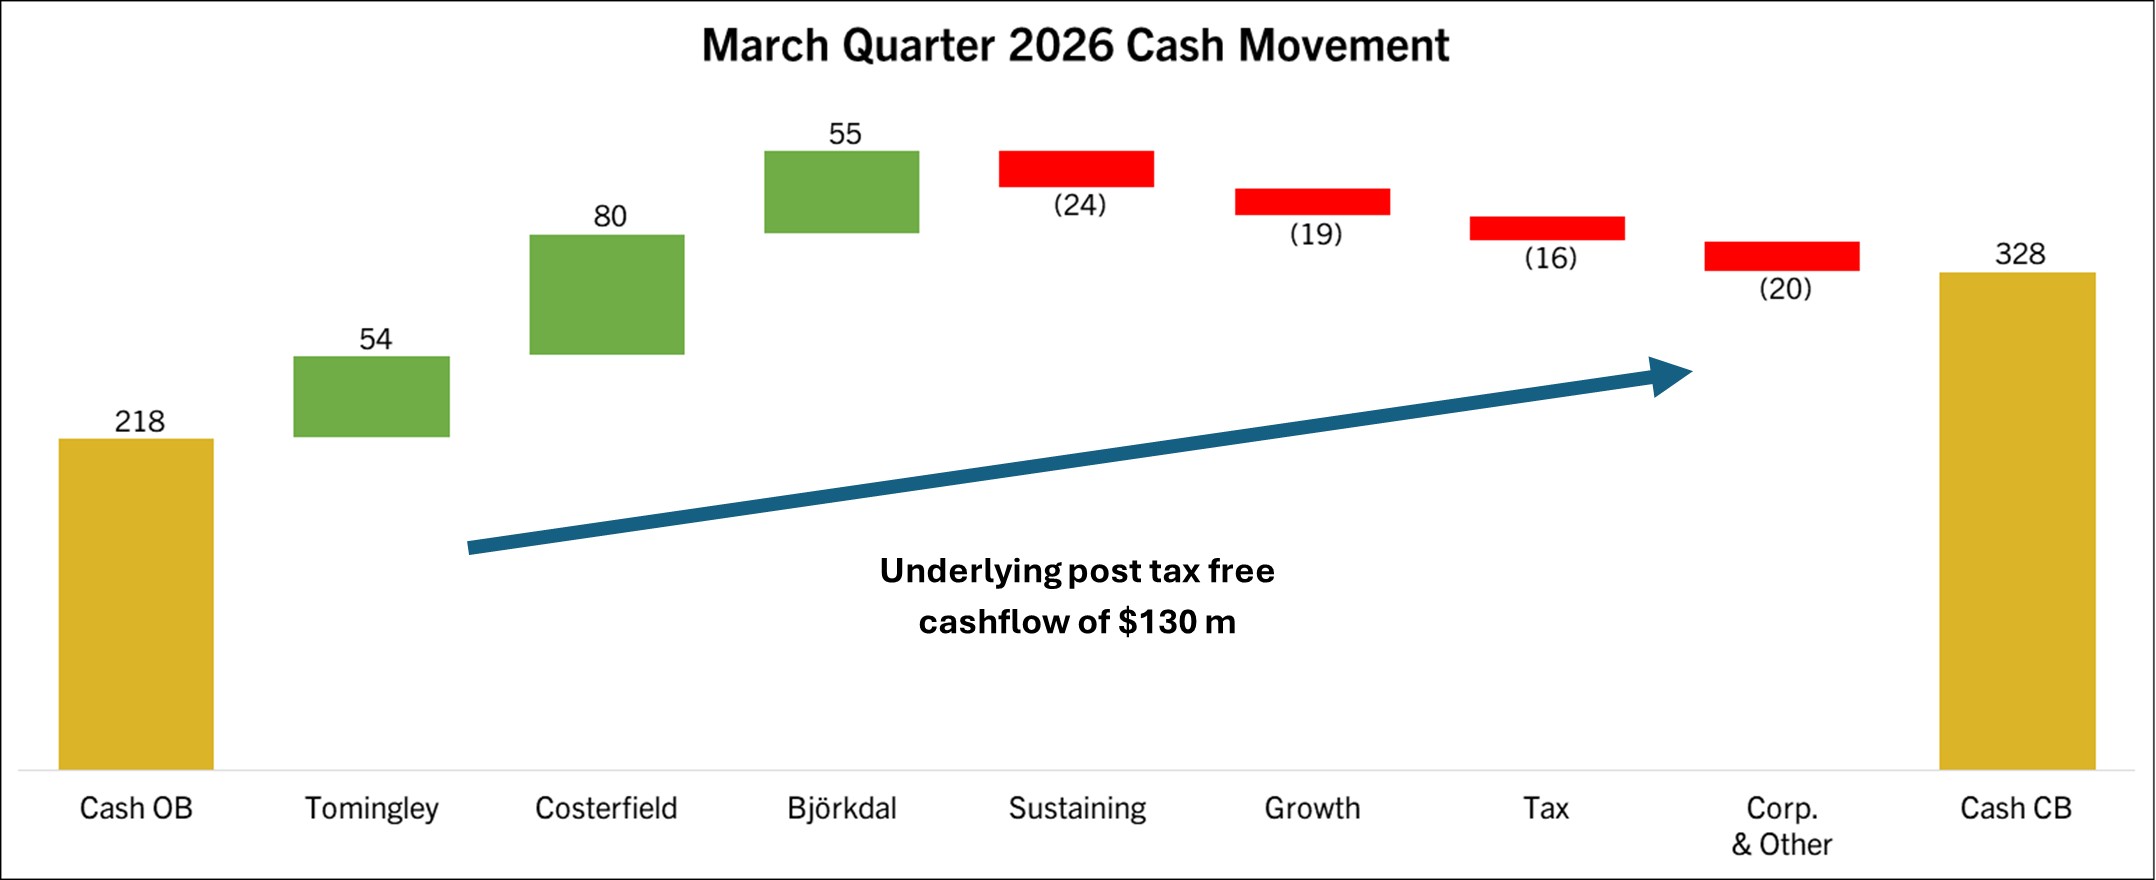
Alkane closed the quarter with cash, bullion and liquid investments of
Tax outflows were
OPERATIONS AND PROJECTS
Costerfield Gold-Antimony Operations -
Costerfield Gold-Antimony Operations (Costerfield) is a wholly owned operation of Alkane. Costerfield is located within the Costerfield mining district of
The property encompasses the underground infrastructure supporting the Augusta,
Operations Performance
Costerfield delivered steady operational performance during the quarter, with both ore mining and milling rates exceeding planned rates. Costerfield had strong mining performance in terms of tonnes mined for the quarter, however grades were different to those aimed for, despite complying reasonably well with forecast mining advance per area each month. Some mined areas did not perform as well as expected in forecast models due to grade variability.
The operation continues to work on targeted improvement programs including drill and blast optimisation, capital development optimisation, enhanced operator training, and the transition to emulsion explosives to improve recovery and reduce dilution.
Processing continued to focus on blend control to maximise throughput, recoveries and produced metal. Successful trials occurred during the quarter with respect to pre-crushing ore feed and screening lower grade ore stockpiles to further improve throughput, crusher downtime and blend control. Work will continue in this area in Q4.
Processing operations performed reliably, with higher mill throughput supported by successful pre-crushing trials. Continuous optimisation of blending and recovery remains a focus. Work continues to prioritise operational consistency across all aspects of the operation.
A total of 11,691 gold equivalent ounces1 was produced during the quarter (Q2 FY26: 11,686 AuEq oz). The site cash costs for the quarter were
Exploration
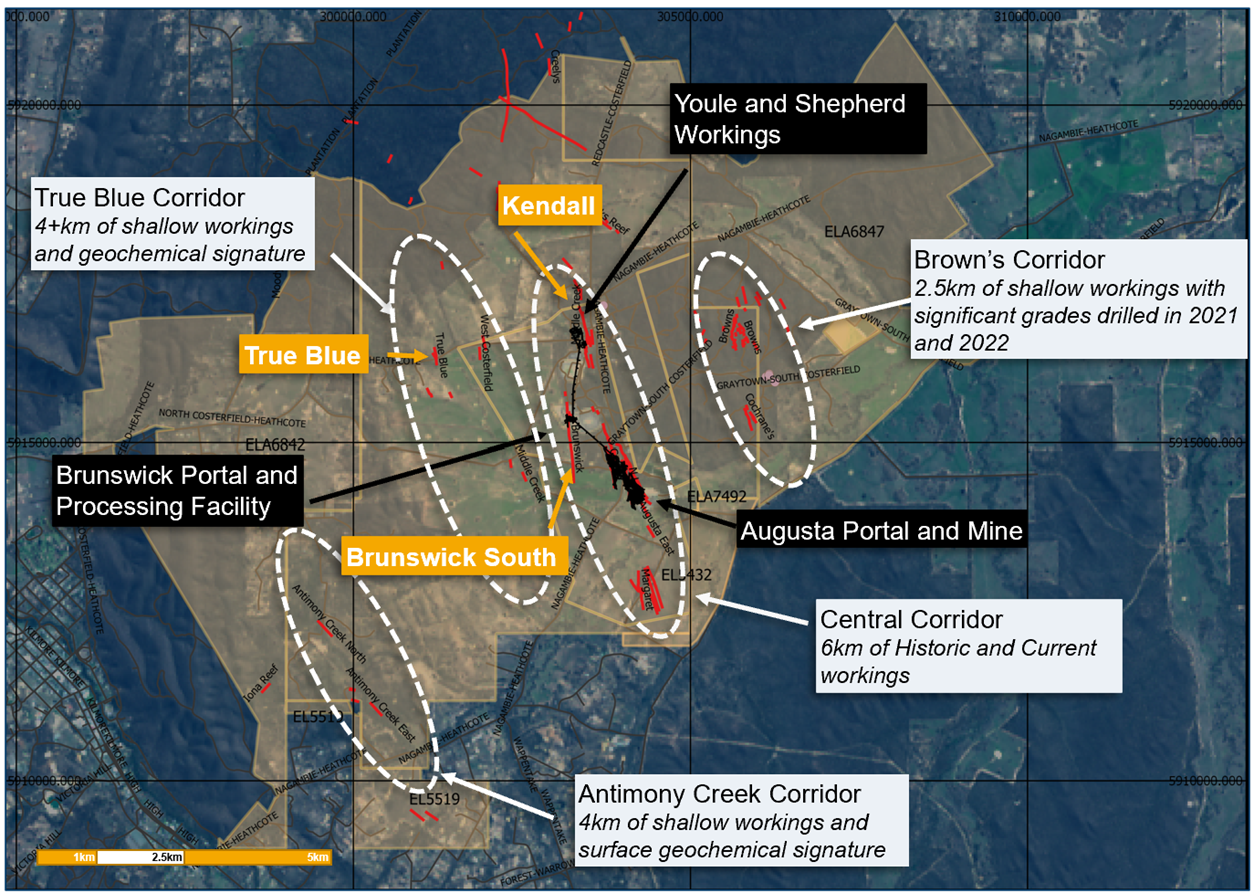
At Costerfield during the quarter three main programs progressed.4 Close to current workings, the Brunswick South and Kendall programs were continued into infill the drilling stage with additional drill rigs mobilised to Brunswick to accelerate the program. The third program continued was True Blue, approximately 2km east of the current mining at Costerfield. The Sub KC drilling program was put on hold during the quarter in preference of the advancing Brunswick South in to infill drilling.
Additionally, during the quarter Alkane reported on the progress of the Kendal drilling program, highlighting that 25 individual veins have now been identified and modelled immediately above the currently mined Youle and Shepherd orebodies and surrounding the historically mined Costerfield deposit.4 Significant assays of the program include: 132.2 g/t gold and 19.8 % antimony over 1.94 m with an estimated true width ETW of 1.04 m, and 267.5 g/t gold and 5.6 % antimony over 2.3 m (ETW 1.22 m).4
Map of Costerfield showing areas of exploration during Q3 FY26.
Operations Performance
The primary source of ore continues to be from Roswell. Underground Ore mined was slightly below plan at 338,016t primarily due to stope performance issues on several stopes requiring rework, however this was off-set by higher development ore tonnages.
Processing continues to perform well with milling exceeding plan primarily as a result of the insertion of a mobile crusher to pre-crush material prior to entering the processing circuit. Mill grade was above plan and recovery was in line with expectations. Pre-crushing of material to different sizes prior to entering the circuit continues and has seen a nominal increase in milling rates to approximately 1.3mtpa, work continues in this area.
A total of 21,652 ounces of gold was poured for the quarter (Q2 FY26: 22,089oz). The site cash costs for the quarter were
Works continued on the
Exploration
Exploration drilling at
Björkdal Gold Operations -
Björkdalsgruvan AB (100%)
Björkdal Gold Operations (Björkdal) is a wholly owned operation of Alkane. The Björkdal property, containing both the Björkdal mine and the Storheden and Norrberget deposits, is located in Västerbotten County in northern
Operations Performance
Björkdal delivered another quarter of consistent mining performance. Resources were allocated to capital development activities in preference to operating development in some areas. Mined grade was in line with planned grades, with a higher mining contribution from below the marble mining area.
Mill throughput increased slightly and recoveries also improved, albeit in line with increased head grade. During the quarter a trial of processing a parcel of off-site ore from a small mine to the west of Björkdal was successfully conducted.
Capital works on several lifts to the tailings dam facility have commenced as the area thawed post winter.
A total of 12,433 gold ounces was produced during the quarter (Q2 FY26: 9,888 oz). The site cash costs for the quarter were
Exploration
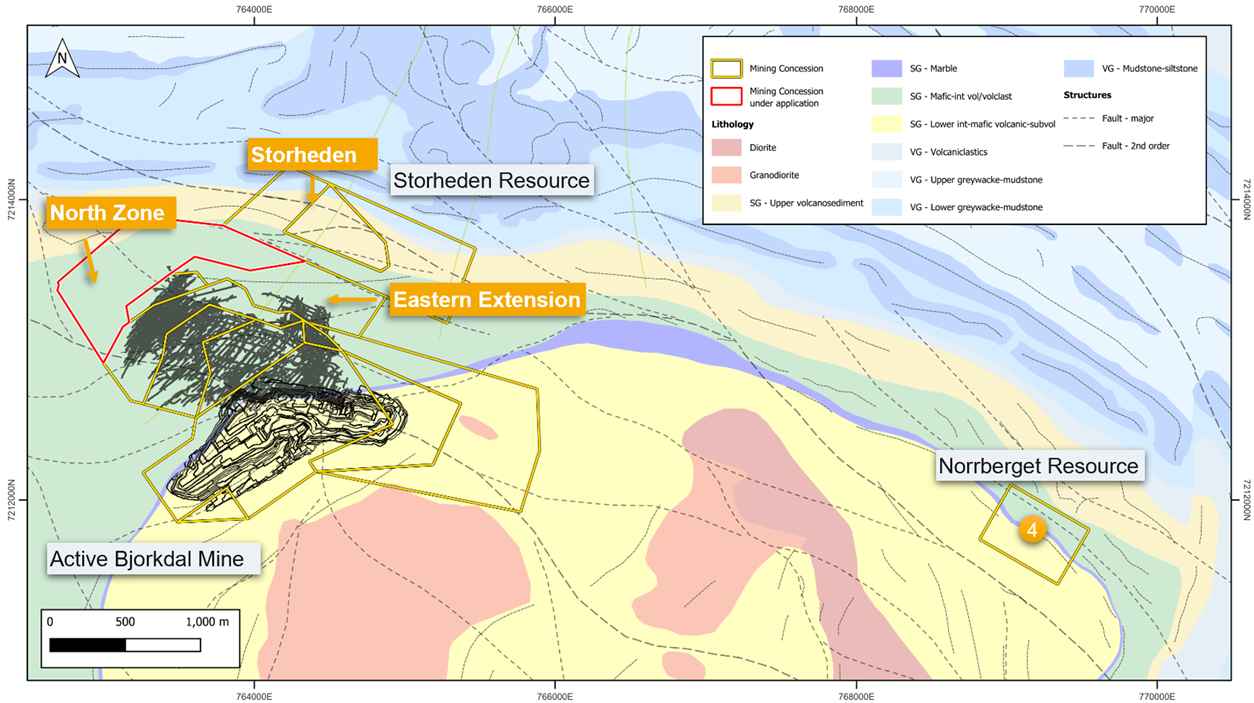
At Björkdal during the quarter three exploration targets were progressed. Drilling at
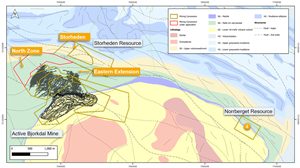
Geological map of Björkdal showing areas of exploration during Q3 FY26.
Exploration on the
Environmental baseline studies to inform the development approval of the Boda-Kaiser Au-Cu resources continued in the quarter.
Lupin is currently in the process of final closure and reclamation with progressive security reductions to be released in the future as the work is completed, providing partial funding. During the quarter, expenditures were incurred for winter road planning, construction, and maintenance, as well as costs related to procurement, engineering and project management services, site operations, and equipment maintenance.
Reclamation work to achieve the majority of closure obligations is expected to take place in the 2026 calendar year. As at
Minera Mandalay Limitada 100%
The Company divested this non-core asset by the sale of all shares in Minera Mandalay Limitada to
CORPORATE
Cash, Bullion and Listed Investments
| Units | Q1 2026 | Q2 2026 | Q3 2026 | |
| Cash | $M | 160 | 218 | 328 |
| Bullion | $M | 14 | 14 | 34 |
| Cash and bullion sub-total | $M | 174 | 232 | 362 |
| Listed Investments | $M | 17 | 14 | 12 |
| Total cash, listed investments and bullion | $M | 191 | 246 | 374 |
Banking Facilities
At the end of the quarter, the Company had
Following the early repayment of the
Investments
At the end of the quarter, Alkane held ~9 million shares in Sky Metals (ASX:SKY) valued at
Gold Forward Sale Contracts
| Quarter | Average Forward Price $/oz | Ounces |
| 2,870 | 8,500 | |
| 2,884 | 7,800 | |
| 2,896 | 7,200 | |
| 2,821 | 7,300 | |
| 2,844 | 6,650 | |
| Total | 2,863 | 37,450 |
The Björkdal operation has 31,500 ounces of put options with expiry dates over the period
Share Capital
Alkane closed the quarter with the following capital structure:
| As at 31 March, | |
| 2026 | |
| Fully Paid Ordinary Shares | 1,366,204,821 |
| Performance Rights | 11,751,603 |
| Total | 1,377,956,424 |
Inclusion into the ASX 200
GROUP SUMMARY FULL YEAR1,2,6
| Table 5: FY26 YTD operational performance summary | |||||||||
| Operations | Units | Costerfield | Björkdal | Total | |||||
| Ore mined | t | 110,618 | 914,787 | 734,579 | 1,759,984 | ||||
| Mined ore gold grade | g/t | 8.75 | 2.39 | 1.27 | 2.32 | ||||
| Mined ore antimony grade | % | 0.93 | - | - | 0.93 | ||||
| Processed ore | t | 105,164 | 948,818 | 1,007,417 | 2,061,399 | ||||
| Processed ore - milled head grade gold | g/t | 9.67 | 2.35 | 1.15 | 2.13 | ||||
| Processed ore - milled head grade antimony | % | 0.95 | - | - | 0.95 | ||||
| Recovery gold | % | 93.40 | % | 88.58 | % | 87.43 | % | 89.80 | % |
| Recovery antimony | % | 85.14 | % | - | - | 85.14 | % | ||
| Gold produced | oz | 29,986 | 62,076 | 30,901 | 122,963 | ||||
| Antimony produced | t | 842 | - | - | 842 | ||||
| Gold equivalent produced | oz | 32,869 | 62,076 | 30,901 | 125,846 | ||||
| Ore stockpiles - contained gold | oz | 7,520 | 8,363 | 18,922 | 34,805 | ||||
| Ore stockpiles - contained antimony | t | 301 | - | - | 301 | ||||
| Gold equivalent in circuit, finished concentrate and bullion | oz | 3,496 | 8,599 | 2,151 | 14,246 | ||||
| Table 6: FY26 YTD financial performance summary | |||||
| Financials | Units | Costerfield | Björkdal | Total | |
| Gold equivalent sold | oz | 32,864 | 59,896 | 29,656 | 122,416 |
| Average realised gold price | $/oz | 6,398 | 4,828 | 6,903 | 5,737 |
| Average realised antimony price | $/t | 40,517 | - | - | 40,517 |
| Revenue | $'000 | 211,944 | 289,161 | 204,709 | 705,815 |
| Mining | $'000 | 35,463 | 71,084 | 51,446 | 157,992 |
| Processing | $'000 | 11,656 | 41,784 | 20,530 | 73,970 |
| G&A | $'000 | 10,920 | 9,771 | 12,510 | 33,201 |
| Cash cost | $'000 | 58,039 | 122,638 | 84,486 | 265,163 |
| Inventory movements | $'000 | 3,721 | 141 | (389) | 3,473 |
| Royalties | $'000 | 5,479 | 10,426 | 284 | 16,189 |
| Corporate costs | $'000 | - | - | - | 14,261 |
| Rehabilitation | $'000 | 1,803 | 2,032 | 216 | 4,051 |
| Sustaining Capital | $'000 | 11,332 | 14,808 | 36,804 | 62,944 |
| All-in sustaining cost | $'000 | 80,373 | 150,046 | 121,402 | 366,081 |
| Exploration | $'000 | 17,982 | 1,495 | 5,935 | 25,413 |
| Growth capital | $'000 | 1,508 | 19,354 | 3,972 | 24,834 |
| All-in cost | $'000 | 99,863 | 170,895 | 131,309 | 416,328 |
| Gold produced | oz | 29,986 | 62,076 | 30,901 | 122,963 |
| Antimony produced | t | 842 | - | - | 842 |
| Gold equivalent produced | oz | 32,869 | 62,076 | 30,901 | 125,846 |
| Cash cost | $/oz | 1,766 | 1,976 | 2,734 | 2,107 |
| All-in sustaining cost | $/oz | 2,445 | 2,417 | 3,929 | 2,909 |
| All-in cost | $/oz | 3,038 | 2,753 | 4,249 | 3,308 |
| Mine operating cash flow | $'000 | 133,952 | 160,782 | 98,937 | 393,672 |
This document has been authorised for release to the market by Nic Earner, Managing Director and CEO.
ABOUT ALKANE - alkres.com - ASX:ALK | TSX: ALK | OTCQX: ALKRY
Alkane’s wholly owned producing assets are the
Alkane also owns the very large gold-copper porphyry
Interactive Analyst Centre™
Comprehensive financial, operational, resource and reserve information for
Competent Person
As an
Alkane is also subject to certain Canadian disclosure requirements and standards as a result of its secondary listing on the
Unless otherwise advised above or in the ASX Announcements referenced, the information in this report that relates to exploration results, mineral resources and ore reserves is based on information compiled by Mr
The information in this announcement that relates to previously reported exploration results, mineral resources and ore reserves is extracted from the Company’s ASX announcements noted in the text of the announcement and available to view on the Company’s website. The Company confirms that it is not aware of any new information or data that materially affects the information included in the original announcements and that the form and context in which the Competent Person’s findings are presented have not been materially altered.
Cautionary Note Regarding Forward-Looking Information and Statements
This announcement contains certain forward-looking information and forward-looking statements within the meaning of applicable securities legislation and may include future-oriented financial information or financial outlook information (collectively Forward-Looking Information). Actual results and outcomes may vary materially from the amounts set out in any Forward-Looking Information. As well, Forward-Looking Information may relate to: future outlook and anticipated events; expectations regarding exploration potential; production capabilities and future financial or operating performance, including AISC, investment returns, margins and share price performance; production and cost guidance and the timing thereof; issuing updated resources and reserves estimate and the timing thereof; the potential of Alkane to meet industry targets, public profile and expectations; and future plans, projections, objectives, estimates and forecasts and the timing related thereto.
Forward-Looking Information is generally identified by the use of words like "will", "create", ", "create", "enhance", "improve", "potential", "expect", "upside", "growth" and similar expressions and phrases or statements that certain actions, events or results "may", "could", or "should", or the negative connotation of such terms, are intended to identify Forward-Looking Information.
Although Alkane believes that the expectations reflected in the Forward-Looking Information are reasonable, undue reliance should not be placed on Forward-Looking Information since no assurance can be provided that such expectations will prove to be correct. Forward-Looking Information is based on information available at the time those statements are made and/or good faith belief of the officers and directors of Alkane as of that time with respect to future events and are subject to risks and uncertainties that could cause actual results to differ materially from those expressed in or suggested by the Forward-Looking Information. Forward-Looking Information involves numerous risks and uncertainties. Such factors include, without limitation: risks relating to changes in the gold and antimony price.
Forward-Looking Information is designed to help readers understand Alkane’s views as of that time with respect to future events and speak only as of the date they are made. Except as required by applicable law, Alkane assumes no obligation to update or to publicly announce the results of any change to any forward-looking statement contained or incorporated by reference herein to reflect actual results, future events or developments, changes in assumptions or changes in other factors affecting the Forward-looking Information. If Alkane updates any one or more forward-looking statements, no inference should be drawn that the company will make additional updates with respect to those or other Forward-looking Information. All Forward-Looking Information contained in this announcement is expressly qualified in its entirety by this cautionary statement.
Disclaimer
Alkane has prepared this announcement based on information available to it. No representation or warranty, express or implied, is made as to the fairness, accuracy, completeness or correctness of the information, opinions or conclusions contained in this announcement. To the maximum extent permitted by law, none of Alkane, its directors, officers, employees, associates, advisers and agents, nor any other person accepts any liability, including, without limitation, any liability arising from fault or negligence on the part of any of them or any other person, for any loss arising from the use of this announcement or its contents or otherwise arising in connection with it.
This announcement is not an offer, invitation, solicitation, or other recommendation with respect to the subscription for, purchase or sale of any security, and neither this announcement nor anything in it shall form the basis of any contract or commitment whatsoever.
Non-IFRS Performance Measures
This announcement contains references to all-in sustaining costs which is a non-IFRS measure and does not have a standardised meaning under IFRS. Therefore, this measure may not be comparable to similar measures presented by other companies. All-in sustaining costs include total cash operating costs, sustaining mining capital, royalty expense and accretion of reclamation provision. Sustaining capital reflects the capital required to maintain a site’s current level of operations. All-in sustaining cost per ounce of gold equivalent in a period equals the all-in sustaining cost divided by the equivalent gold ounces produced in the period.
____________________
1 Gold equivalent ounces calculated by multiplying quantities of gold and antimony in period by respective average market price of commodities in period, adding the two amounts to get ‘total contained value based on market price’ and dividing that total contained value by the average market price of gold in period. I.e., AuEq = ((Au Produced x Au $/oz) + (Sb Produced pre-payability x 70% payability x Sb $/t)) / (Au $/oz). The average market prices for the March quarter were
2 AISC is a non-IFRS measure and does not have a standardised meaning under IFRS and might not be comparable to similar financial measures disclosed by other companies. Refer to "Non-IFRS Performance Measures" at the end of this announcement.
3 Refer to ALK Announcement dated
4 Refer to ALK Announcement dated
5 Refer to ALK Announcement dated
6 As the merger with
CONTACT: NIC EARNER, MANAGING DIRECTOR & CEO,
INVESTORS & MEDIA:
Photos accompanying this announcement are available at
https://www.globenewswire.com/NewsRoom/AttachmentNg/91345541-df51-430e-bc9f-fff0cf6dd0f2
https://www.globenewswire.com/NewsRoom/AttachmentNg/8509df16-23cb-48b6-ae98-66270f3ebede
https://www.globenewswire.com/NewsRoom/AttachmentNg/d396d2d5-ce10-4a69-85b2-bbd2d3079c68
https://www.globenewswire.com/NewsRoom/AttachmentNg/d22cf41c-e90f-418b-9a08-73e589a071ef
https://www.globenewswire.com/NewsRoom/AttachmentNg/57763c6b-e089-4c0c-ac54-38363e259a1a
https://www.globenewswire.com/NewsRoom/AttachmentNg/22fa80a7-4e41-47ef-a9fe-1af34b342755
https://www.globenewswire.com/NewsRoom/AttachmentNg/06c6665d-415c-4d42-8d0e-9aadff01e4e9

Figure 1
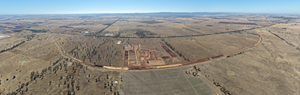
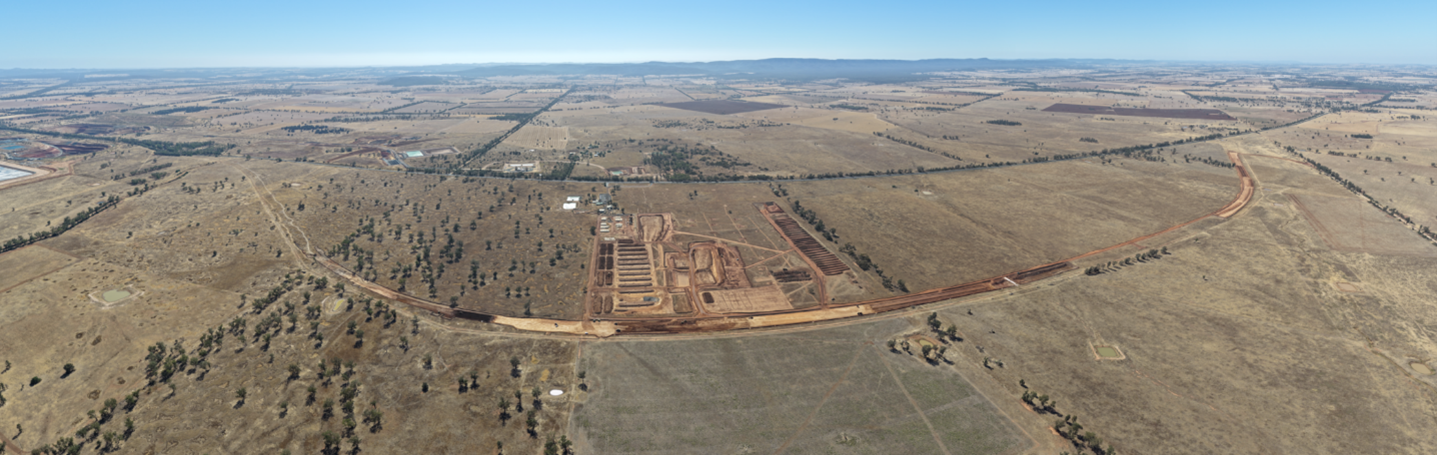
Newell Highway works looking east.
Q3 FY26 All in sustaining and All in cost ($/oz)

Q3 FY26 All in sustaining and All in cost ($/oz)
March Quarter 2026 Cash Movement
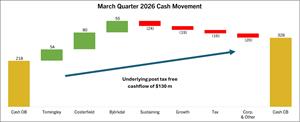
March Quarter 2026 Cash Movement
Figure 2
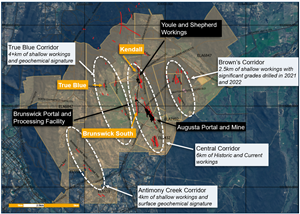
Map of Costerfield showing areas of exploration during Q3 FY26.
Figure 3
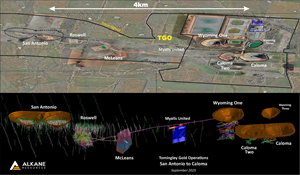
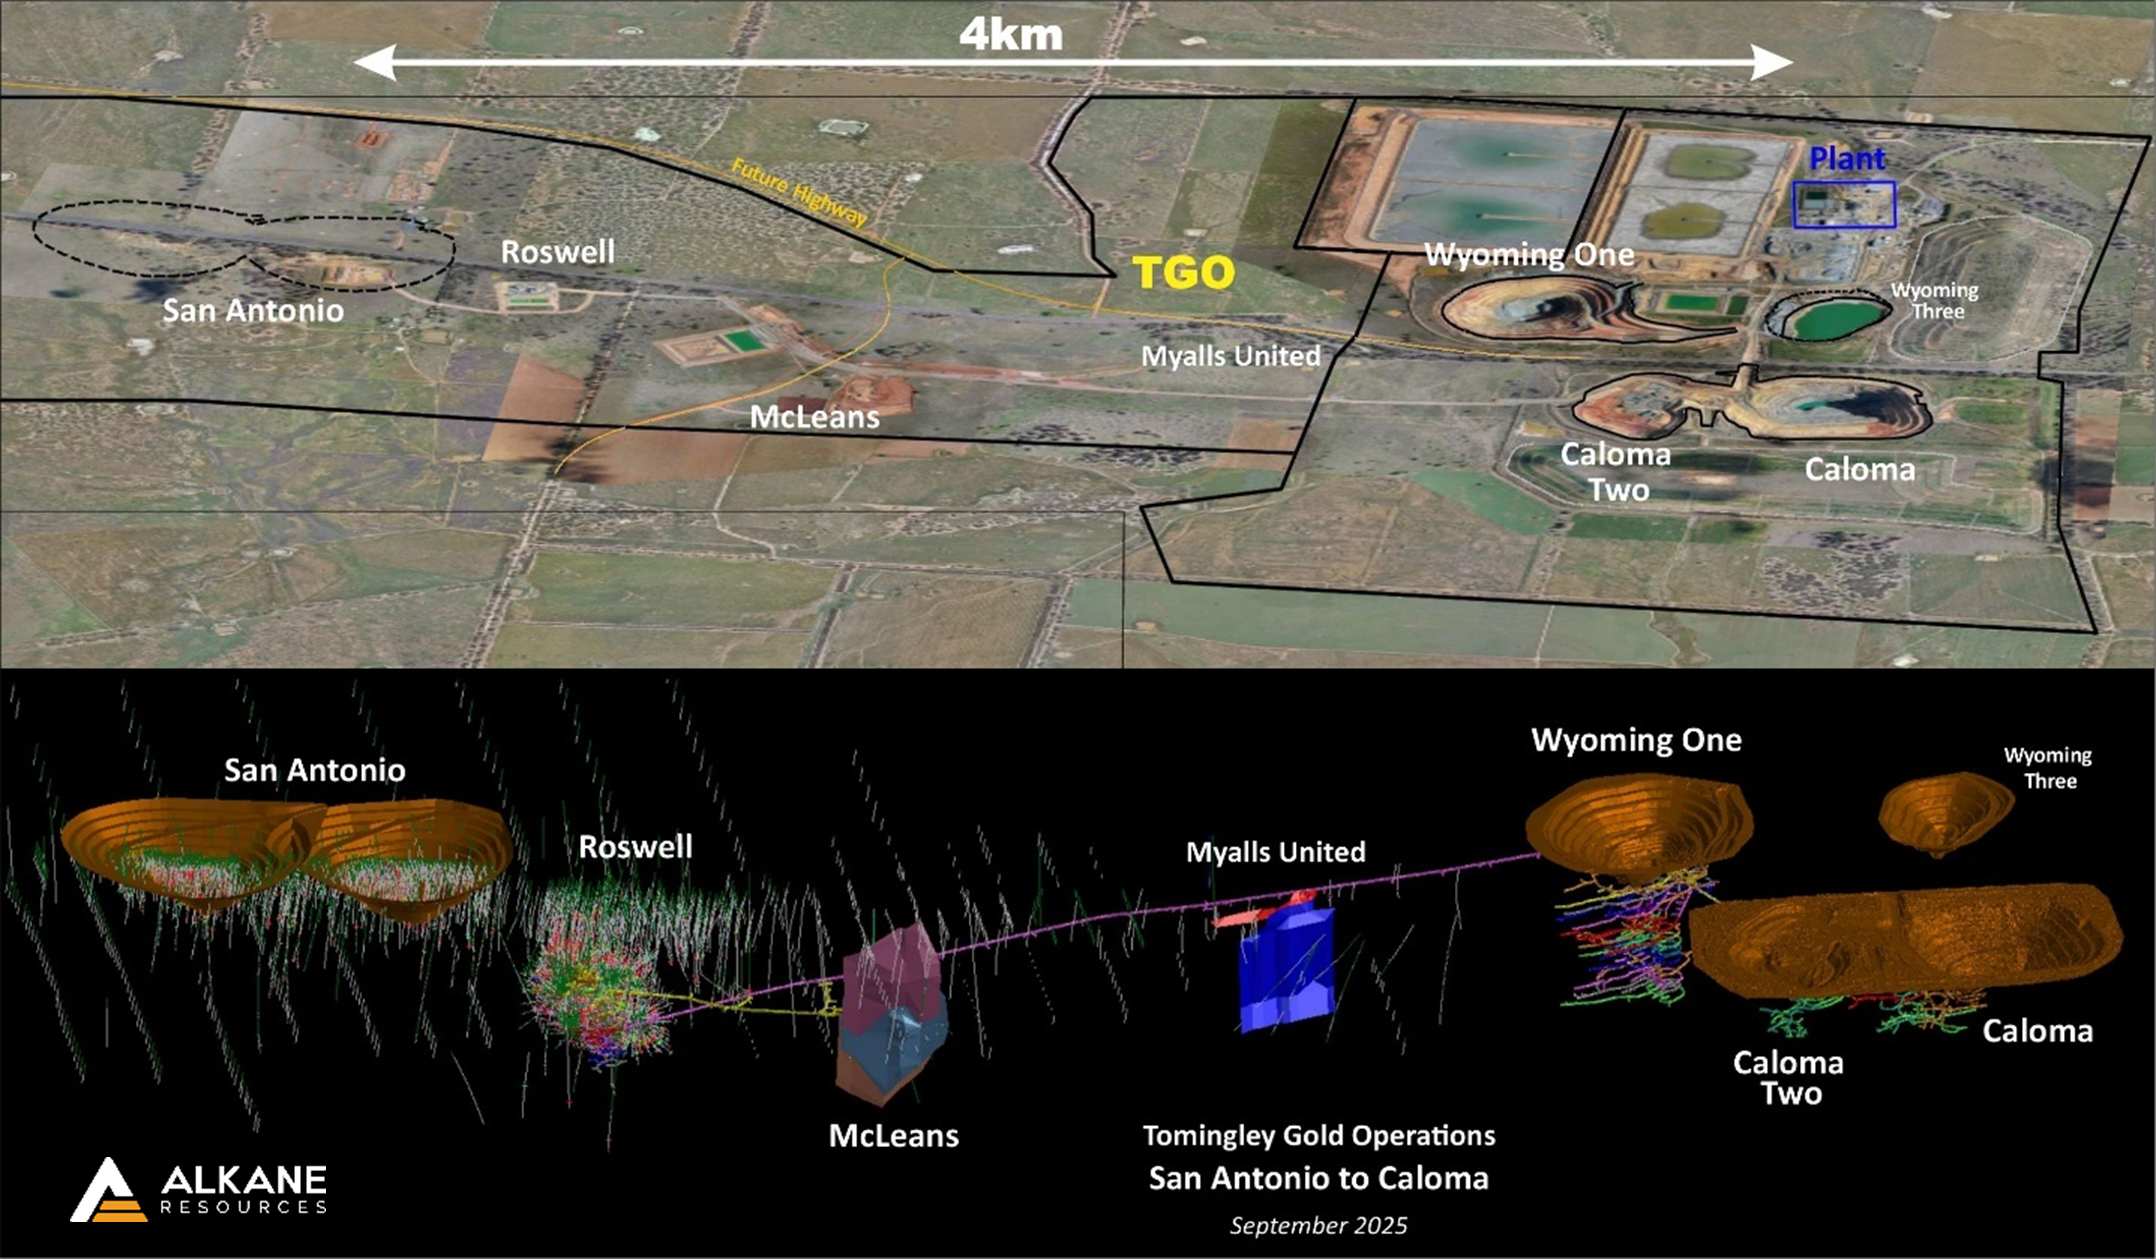
Tomingley Gold Operations , San Antonio to Caloma, September 2025
Figure 4
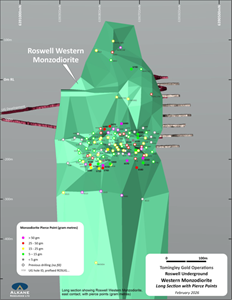
Roswell Western Monzodiorite
Figure 5