

| KEY HIGHLIGHTS | ||||||||
| Operating results | | 3Q26 | | 3Q25 | | YTD 3Q26 | | YTD 3Q25 |
| Net loss attributable to Alexandria's common stockholders – diluted: | | | | | ||||
| In millions | | $ (638.5) | (1) | $ (234.9) | | $ (351.4) | | $ (356.1) |
| Per share | | $ (3.74) | | $ (1.38) | | $ (2.06) | | $ (2.09) |
| Funds from operations attributable to Alexandria's common stockholders – diluted, as adjusted: | ||||||||
| In millions | | $ 264.4 | | $ 377.8 | | $ 856.5 | | $ 1,166.3 |
| Per share | | $ 1.54 | | $ 2.22 | | $ 5.00 | | $ 6.85 |
| | |
| (1) | Includes |
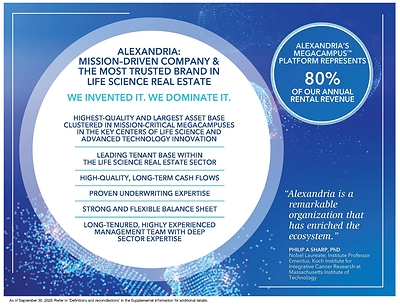
A best-in-class REIT with a high-quality and diverse tenant base, strong margins, and long lease terms
| (As of or for the three months ended September 30, 2026, unless stated otherwise) | | | |
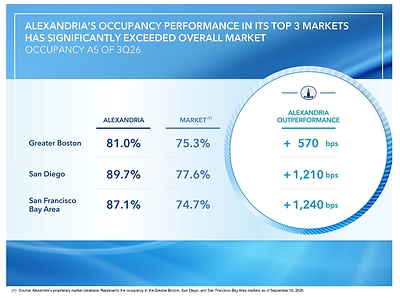
| Occupancy of operating properties | | 87.1 % | |
| Occupancy of operating properties, including executed leases with future occupancy | | 90.8 % | |
| Percentage of annual rental revenue in effect from Megacampus platform | | 80 % | |
| Percentage of annual rental revenue in effect from investment-grade or publicly | | 57 % | |
| Operating margin | | 66 % | |
| Adjusted EBITDA margin | | 65 % | |
| Percentage of leases containing annual rent escalations | | 97 % | |
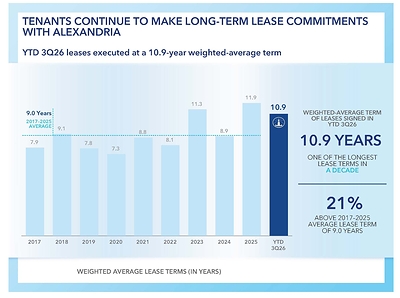
| Weighted-average remaining lease term: | | | |
| All tenants | | 7.7 | years |
| Top 20 tenants | | 10.0 | years |
| Strong 3Q26 tenant collections: | | | |
| 3Q26 rents and receivables collected as of | | 99.9 % | |
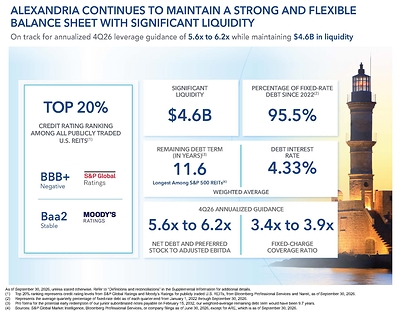
Strong and flexible balance sheet with significant liquidity; top 20% credit rating ranking among all publicly traded U.S. REITs; long-duration remaining debt term (as of 9/30/26)
$21.01 billion in total market capitalization and$8.11 billion in total equity capitalization.- Net debt and preferred stock to Adjusted EBITDA:
- 4Q26 annualized target: 5.6x–6.2x.
- 3Q26 annualized: 6.9x; 6.6x on a pro forma basis reflecting the
October 2026 closing of the sale of our partial interest in theCampus Point by Alexandria joint venture.
- Significant liquidity of
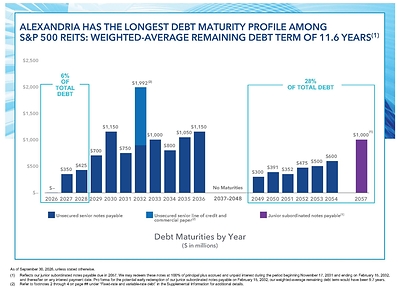
$4.56 billion and closed extension of our$5.0 billion unsecured senior line of credit to 2032. - Only 6% of our total debt matures through 2028.
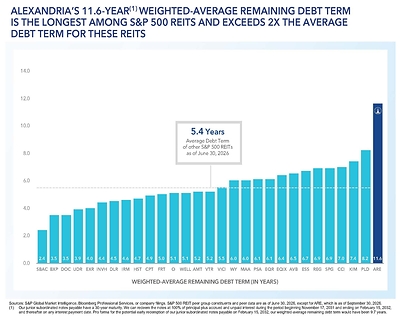
- 11.6-year weighted-average remaining debt term, the longest among S&P 500 REITs.
- Total debt and preferred stock, as adjusted, to gross assets of 30%.
- Intermediate-term goal for leverage: mid-5x range.
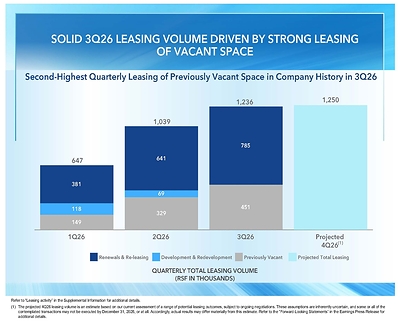
Solid 3Q26 total leasing volume exceeding 1.2 million RSF; highest total quarterly volume since 4Q24
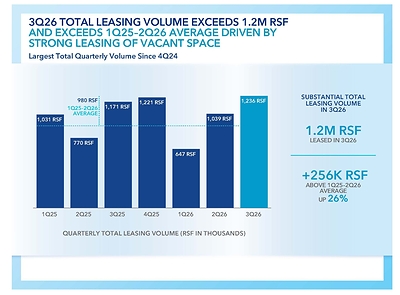
- 3Q26 total leasing volume surpassed 1.2 million RSF, exceeding the 1Q25–2Q26 quarterly average of 979,822 RSF by approximately 256,000 RSF, and representing the highest quarterly volume since 4Q24.
- Includes 450,961 RSF of leasing of previously vacant space, the second-highest quarterly amount in company history.
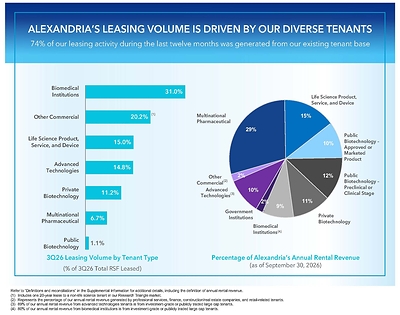
- 74% of our leasing activity during the last twelve months was generated from our existing tenant base.
| | | | Leasing Volume in RSF: | | 3Q26 | | 2Q26 | | 1Q26 | | YTD 3Q26 |
| | | | Leasing of previously vacant space | | 450,961 | | 329,148 | | 148,734 | | 928,843 |
| | | | Leasing of development and | | — | | 68,771 | | 117,935 | | 186,706 |
| | | | | | 450,961 | | 397,919 | | 266,669 | | 1,115,549 |
| | | | Lease renewals and re-leasing of space | | 785,069 | | 640,998 | | 380,687 | | 1,806,754 |
| | | | Total leasing volume | | 1,236,030 | | 1,038,917 | | 647,356 | | 2,922,303 |
| | | | Lease renewals and re-leasing of space: | | | | | | | | |
| | | | Rental rate changes | | (2.4) % | | (0.7) % | | (15.0) % | | (5.1) % |
| | | | Rental rate changes (cash basis) | | (3.3) % | | (4.3) % | | (15.8) % | | (6.9) % |
Ongoing execution of Alexandria's capital recycling strategy
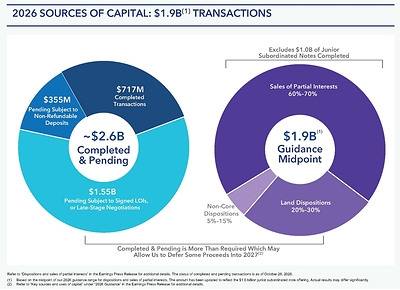
We plan to continue funding a significant portion of our capital requirements for the year ending
| Sources of capital: transactions | | Sales Price |
| (dollars in millions) | | |
| Non-core and land dispositions | | $ 242 |
| Sales of partial interests | | 475 |
| Completed as of | | 717 |
| Pending transactions subject to: | | |
| Non-refundable deposits | | 355 |
| Signed letters of intent and/or purchase and sale agreement late-stage negotiations | | 1,548 |
| | | 2,620 |
| Proceeds from dispositions and sales of partial interests in excess of 2026 guidance | | (720) |
| 2026 guidance midpoint for dispositions and sales of partial interests | | $ 1,900 |
Refer to "Definitions and reconciliations" in the Supplemental Information.
Occupancy of operating properties and leasing progress
| Occupancy of operating properties as of | 86.9 % | |
| Key changes to occupancy of operating properties: | | |
| Reclassification of 339,020 RSF at | (0.9) | (1) |
| Reclassification of held-for-sale properties with vacancy | 0.6 | |
| Net increase in occupancy primarily due to lease commencements during 3Q26 | 0.5 | |
| Occupancy of operating properties as of | 87.1 | |
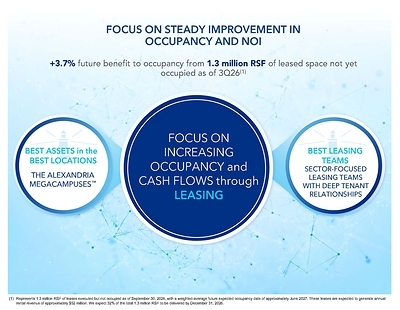
| Vacant operating space with executed leases and future occupancy | 3.7 | (2) |
| Occupancy of operating properties as of | 90.8 % | |
| | |
| (1) | Refer to "Resolution of certain construction projects under evaluation and reduction of capital spend and funding needs" in this Earnings Press Release for additional details. |
| (2) | Represents executed leases aggregating 1.3 million RSF within our operating portfolio, with occupancy expected upon completion of building and/or tenant improvements. The weighted-average expected occupancy date is approximately |
KEY OPERATING METRICS
| Operating metrics | | 3Q26 | | YTD 3Q26 | |
| Same property performance: | | | | | |
| Net operating income changes | | (6.7) % | (1) | (9.2) % | (1) |
| Net operating income changes (cash basis) | | (2.8) % | (1) | (8.4) % | (1) |
| Occupancy – current-period average | | 88.1 % | | 88.6 % | |
| Occupancy – same-period prior-year average | | 91.7 % | | 92.8 % | |
| | | | | | |
| Refer to "Same property comparisons" and "Net operating income" under "Definitions and reconciliations" in the Supplemental Information for additional details and their respective reconciliations from the most directly comparable financial measures presented in accordance with GAAP. | |
| | |
| (1) | The decline was due to a decrease in same property occupancy, primarily driven by previously disclosed key lease expirations with expected downtime aggregating 282,878 RSF and 1.2 million RSF in 3Q26 and YTD 3Q26, respectively, with weighted-average lease expiration dates of |
Resolution of certain construction projects under evaluation and reduction of capital spend and funding needs
- We entered into a purchase and sale agreement with an institutional user for the sale of
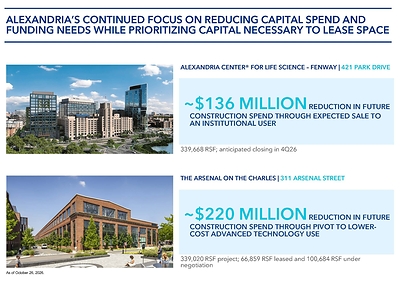
421 Park Drive on the Alexandria Center® for Life Science – Fenway Megacampus, aggregating 339,668 RSF, which represents substantially all of our development project at this location. The disposition is expected to generate significant sales proceeds and to reduce future potential construction spend by approximately$136 million , with closing anticipated in 4Q26. - We have executed leases of 66,859 RSF and have additional leases under negotiation of 100,684 RSF for advanced technology use at our project at
311 Arsenal Street on The Arsenal on the Charles Megacampus. This activity enables us to pivot the redevelopment project to a lower-cost advanced technology use, reducing future potential construction spend by approximately$220 million . As a result of this leasing progress, the entire project aggregating 339,020 RSF was reclassified from redevelopment to operating as of 3Q26. - We continue to evaluate the business and financial strategy for three remaining projects aggregating 667,002 RSF, including options that could further reduce future construction funding requirements.
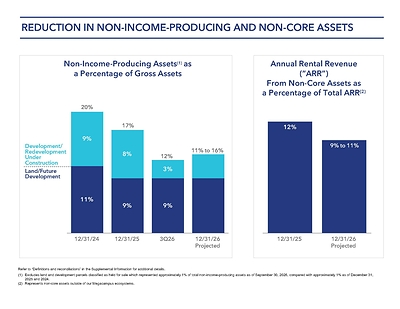
- Non-income-producing assets for 3Q26 are 12% of gross assets, a reduction of 800 bps since 4Q24.
Alexandria's development and redevelopment pipeline delivered incremental annual net operating income of
- During 3Q26, we placed into service 529,061 RSF of development and redevelopment projects across multiple submarkets. The projects were 84% occupied at delivery and generated incremental annual net operating income aggregating
$40 million . 3Q26 key deliveries included:- 198,992 RSF to Novo Nordisk for its R&D Center at
60 Sylvan Road on the Alexandria Center® for Life Science – Waltham Megacampus. - 174,662 RSF at
99 Coolidge Avenue located on a Megacampus in Watertown.
- 198,992 RSF to Novo Nordisk for its R&D Center at
- Annual net operating income (cash basis) from recently delivered projects is expected to increase by
$67 million upon the burn-off of initial free rent, which has a weighted-average remaining period of approximately four months. - 80% of the RSF in our total development and redevelopment pipeline is within our Megacampus ecosystems.
| | | | Development and Redevelopment | | Incremental Annual Net | | RSF | | Occupied/ Percentage | ||
| | | | (dollars in millions) | | | | | | | | |
| | | | Placed into service: | | | | | | | | |
| | | | 1H26 | | $ 58 | | 532,219 | | | 91 % | |
| | | | 3Q26 | | 40 | | 529,061 | | | 84 | |
| | | | Placed into service in YTD 3Q26 | | $ 98 | (1) | 1,061,280 | | | 87 % | |
| | | | | | | | | | | | |
| | | | Expected to be placed into service:(2) | | | | | | | | |
| | | | 2027 | | $ 24 | | 905,582 | | 77 % | ||
| | | | 2028 | | 61 | | | ||||
| | | | | | $ 85 | | | ||||
| | |
| (1) | Excludes future incremental annual net operating income from spaces placed into service that were vacant and/or unleased at delivery. |
| (2) | Excludes 667,002 RSF of redevelopment projects currently under evaluation. |
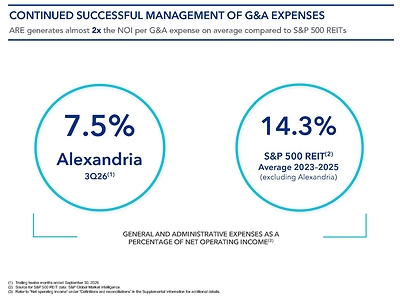
Continued successful management of general and administrative expenses
- For the trailing twelve months ended
September 30, 2026 , our general and administrative expenses represented 7.5% of net operating income, nearly half the average of other S&P 500 REITs for 2023–2025. - Compared to 2024, we continue to expect approximately
$76 million of cumulative general and administrative expense savings for the two-year period 2025 and 2026 (based on the midpoint of our 2026 guidance range). Some of the cost savings in 2025 were temporary, and approximately half of the cost reductions achieved in 2025 are expected to continue in 2026 (based on the midpoint of our 2026 guidance range).
Key capital events
- In
August 2026 , we completed a public offering of$1.00 billion aggregate principal amount of 7.250% Series A fixed-to-fixed reset rate junior subordinated notes due 2057. The notes will initially bear interest at 7.250% per year through, but excluding,February 15, 2032 . Thereafter, the interest rate will reset every five years to the five-yearU.S .Treasury rate plus 2.889%, subject to a minimum interest rate of 7.250%. We may elect to defer interest payments for up to five consecutive years, subject to the terms of the notes, including certain restrictions on paying dividends and repurchasing equity. We may also redeem at 100% of principal plus accrued and unpaid interest during the period beginningNovember 17, 2031 and ending onFebruary 15, 2032 , and thereafter on any interest payment date. This issuance supports our liquidity, capital structure, and deleveraging objectives while receiving 50% equity treatment from key rating agencies for purposes of the computations of leverage, fixed charges, and other credit metrics. - In
September 2026 , we closed our amended and restated$5.0 billion unsecured senior line of credit which, among other changes, extended the maturity date fromJanuary 22, 2030 toJanuary 22, 2032 , including extension options that we control. The amendment also reduced the applicable borrowing rate to SOFR plus 0.725% from SOFR plus 0.835%. In connection with the amendment, we recognized a loss on early extinguishment of debt of approximately$3.3 million related to the partial write-off of unamortized loan fees. - Under our common stock repurchase program authorized in
December 2025 , we may repurchase up to$500.0 million of our common stock throughDecember 31, 2026 . As ofSeptember 30, 2026 , no shares have been repurchased under this program and$500.0 million remains available for future share repurchases.
Dividend strategy to share net cash flows from operating activities with stockholders while retaining a significant portion for reinvestment
- Common stock dividend declared of
$0.72 per share for 3Q26, consistent with the preceding quarter. The declared dividend per common share reflects our commitment to maintaining the strength of our balance sheet, enhancing financial flexibility, supporting liquidity, and sharing cash flows with our stockholders. - Significant net cash provided by operating activities, as adjusted, retained for reinvestment aggregating
$2.55 billion for the years endedDecember 31, 2022 through 2025 and the midpoint of our 2026 guidance range. - Dividend yield of 6.1% as of
September 30, 2026 and dividend payout ratio of 47% for the three months endedSeptember 30, 2026 .
Investments
- As of
September 30, 2026 :- Our non-real estate investments aggregated
$1.74 billion . - Unrealized gains presented in our consolidated balance sheet were
$243.9 million , comprising gross unrealized gains and losses aggregating$322.4 million and$78.5 million , respectively.
- Our non-real estate investments aggregated
- Investment income of
$24.0 million for 3Q26, presented in our consolidated statement of operations, consisted of$16.0 million of realized gains,$21.6 million of unrealized gains, and$13.6 million of impairment charges.
2026 Guidance
(Dollars in millions, except per share amounts)
Guidance for 2026 has been updated to reflect our current view of existing market conditions and assumptions for the year ending
| Projected 2026 Funds From Operations per Share Attributable to Alexandria's Common Stockholders – Diluted | | As of | | As of | | Key Changes | ||||
| | | | | | | | | | | |
| Funds from operations per share, as adjusted(1) | | | | | | No change to the midpoint, range narrowed by | ||||
| Midpoint | | | | | | |||||
| | | | | | | | | | | |
| Key Credit Metrics Targets | | As of | | As of | | Key Changes |
| | | | | | | |
| Net debt and preferred stock to Adjusted EBITDA – 4Q26 annualized | | 5.6x to 6.2x | | 5.6x to 6.2x | | No Change |
| Fixed-charge coverage ratio – 4Q26 annualized | | 3.4x to 3.9x | | 3.6x to 4.1x | | 0.2x reduction(2) |
| | | | | | | |
| | | As of | | As of | ||||||||
| Key Sources and Uses of Capital | | Range | | Midpoint | | Certain | | |||||
| Sources of capital: | | | | | | | | | | | | |
| Net cash provided by operating activities, as adjusted | | $ 475 | | $ 575 | | $ 525 | | | | | | $ 525 |
| Dispositions and sales of partial interests | | 1,100 | | 2,700 | | 1,900 | | | (3) | | | 2,900 |
| Total sources of capital | | $ 1,575 | | $ 3,275 | | $ 2,425 | | | | | | $ 3,425 |
| Uses of capital: | | | | | | | | | | | | |
| Construction(4) | | $ 1,500 | | $ 2,000 | | $ 1,750 | | | | | | $ 1,750 |
| Reduction in unsecured debt | | 75 | | 1,275 | | 675 | | | See below | | | 1,675 |
| Total uses of capital | | $ 1,575 | | $ 3,275 | | $ 2,425 | | | | | | $ 3,425 |
| Reduction in unsecured debt (included above): | | | | | | | | | | | | |
| Repayment of unsecured senior notes payable with 2026 maturities | | $ 650 | | $ 650 | | $ 650 | | $ | 650 | | | $ 650 |
| Tender offers for partial principal repayments of unsecured senior notes payable | | 952 | | 952 | | 952 | | $ | 952 | | | 952 |
| Issuance of unsecured senior notes payable | | (750) | | (750) | | (750) | | $ | (750) | | | (750) |
| Issuance of junior subordinated notes payable(3) | | (1,000) | | (1,000) | | (1,000) | | $ | (1,000) | | | — |
| Unsecured senior line of credit, commercial paper, and other | | 223 | | 1,423 | | 823 | | | | | | 823 |
| Reduction in unsecured debt | | $ 75 | | $ 1,275 | | $ 675 | | | | | | $ 1,675 |
| | | | | | | | | | | | | |
Refer to "Definitions and reconciliations" in the Supplemental Information for additional details on key credit metrics.
| (1) | Refer to "Funds from operations and funds from operations, as adjusted, attributable to |
| (2) | Reduction primarily reflects the |
| (3) | In |
| (4) | We continue to apply a disciplined approach to reduce construction spending for 2027 and seek to prioritize leased projects with high incremental returns. We expect 2027 construction spending to primarily focus on: (i) revenue- and non-revenue-enhancing capital expenditures, which are expected to represent the majority of spend, approximately half of which is associated with space that is already leased or under lease negotiations, in order to support the leasing of vacant space and renewals and re-leasing of space at our operating properties and (ii) construction spending required to complete our development and redevelopment projects that are expected to stabilize through 2028 and are 77% leased/negotiating. |
| | | As of | | As of | | Key Changes to Midpoint | |||||
| Key Assumptions | | Low | | High | | Low | | High | | ||
| | | | | | | | | | | | |
| Occupancy of operating properties as of | | 86.2 % | | 87.8 % | | 86.2 % | | 87.8 % | | No Change | |
| Same property performance: | | | | | | | | | | | |
| Net operating income changes | | (10.5) % | | (8.5) % | | (10.5) % | | (8.5) % | | | |
| Net operating income changes (cash basis) | | (10.5) % | | (8.5) % | | (10.5) % | | (8.5) % | | | |
| Lease renewals and re-leasing of space: | | | | | | | | | | | |
| Rental rate changes | | (9.0) % | | (1.0) % | | (9.0) % | | (1.0) % | | | |
| Rental rate changes (cash basis) | | (15.0) % | | (7.0) % | | (15.0) % | | (7.0) % | | | |
| Straight-line rent revenue | | $ 40 | | $ 70 | | $ 45 | | $ 75 | | | |
| General and administrative expenses | | $ 134 | | $ 154 | | $ 134 | | $ 154 | | No Change | |
| Capitalization of interest | | $ 220 | | $ 260 | | $ 220 | | $ 260 | | | |
| Interest expense | | $ 260 | | $ 300 | | $ 260 | | $ 300 | | No Change(2) | |
| Realized gains on non-real estate investments(3) | | $ 50 | | $ 80 | | $ 60 | | $ 90 | | | |
| | | | | | | | | | | | |
| (1) | Reduction driven primarily by write-offs and reserves of deferred rent related to tenant wind-downs. Our 2026 guidance assumes a |
| (2) | We expect 2026 interest expense to be near the high-end of the range, reflecting, in part, interest expense associated with the |
| (3) | Represents realized gains and losses included in funds from operations per share – diluted, as adjusted. Excludes unrealized gains and losses and significant gains and impairments realized on non-real estate investments, if any. The midpoint of our revised guidance range for 2026 realized gains on non-real estate investments was reduced by |
Summary of key items that may impact 2026 and 2027 results
1) Potential tenant wind-downs
- Our 2026 guidance includes a
$30 million to$35 million reduction in funds from operations for potential tenant wind-downs, of which approximately$30 million was recognized during the nine months endedSeptember 30, 2026 , including approximately$16 million recognized in 3Q26. - Based upon current market conditions, we preliminarily estimate at least a similar level of reduction in funds from operations may be necessary in 2027.
- Depending on the timing and magnitude of the specific tenant wind-downs, we anticipate that 2027 occupancy may also be negatively impacted.
2) Development-related other income
- During the nine months ended
September 30, 2026 , we recognized development fees and other related revenues of approximately$8.0 million , or$11 million annualized, most of which are expected to cease by the end of 2026 as we complete the respective projects.
3) Development and redevelopment projects under business and financial strategy evaluation
- We have three redevelopment projects for which the business and financial strategies continue to be evaluated, including whether to continue construction of laboratory improvements, pause construction, pursue lower-investment construction alternatives (including a pivot to advanced technology use), or pursue a disposition. Refer to "New Class A/A+ development and redevelopment properties: under construction" in the Supplemental Information for additional details.
- If we elect to continue to pursue construction of laboratory improvements for these projects, the earliest deliveries of these projects are in 2028.
- If we elect to pursue lower-investment construction alternatives (including a pivot to advanced technology use), we expect these projects would have lower rental rates and stabilized yields compared to our initial underwriting. The incremental capital required for alternative-use construction and corresponding rental rates earned are generally lower than those associated with laboratory improvements.
- As of 3Q26, we have executed leases for 66,859 RSF and have additional leases under negotiation for 100,684 RSF for advanced technology use at our project at
311 Arsenal Street in The Arsenal on the Charles Megacampus. This activity enables us to pivot the redevelopment project to a lower-cost alternative use at lower rental rates and stabilized yields than our initial underwriting. Therefore, we placed this project, aggregating 339,020 RSF, into operation during 3Q26 and included it in our operating occupancy as ofSeptember 30, 2026 . Refer to the Earnings Press Release and "Leasing Activity" in the Supplemental Information for additional details. - In addition, we entered into a purchase and sale agreement with an institutional user for the sale of our development project at
421 Park Drive on the Alexandria Center® for Life Science – Fenway Megacampus aggregating 339,668 RSF. The disposition is expected to close in 4Q26, resulting in significant sales proceeds and reducing future construction spending by approximately$136 million .
4) Capitalization of interest
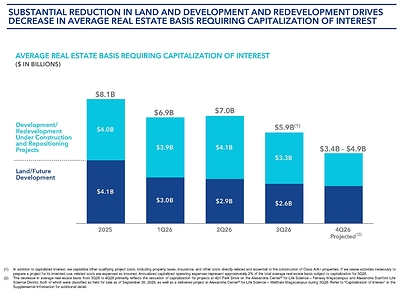
- Our average real estate basis capitalized during 3Q26 was
$5.87 billion . As ofSeptember 30, 2026 , our real estate basis that continued to qualify for capitalization declined to$4.46 billion , primarily driven by the cessation of capitalization on our projects at421 Park Drive on the Alexandria Center® for Life Science – Fenway Megacampus andAlexandria Stanford Life Science District , both of which were classified as held for sale as ofSeptember 30, 2026 , as well as a delivered project at Alexandria Center® for Life Science – Waltham Megacampus inSeptember 2026 . During 4Q26, we expect the average real estate basis capitalized to range from$3.4 billion to$4.9 billion . Refer to "Capitalization of interest" in the Supplemental Information for additional detail. - At each milestone date, we evaluate, on an asset-by-asset basis, whether to (i) proceed with additional pre-construction and/or construction activities based on leasing demand and/or market conditions, (ii) pause future investments, or (iii) consider potential dispositions or sales of partial interests of these real estate assets. If we cease the activities necessary to prepare a project for its intended use, costs related to such project, including interest, payroll, property taxes, insurance, and other costs directly related and essential to the construction of Class A/A+ properties, are expensed as incurred. During 3Q26, annualized capitalized operating expenses represented approximately 2% of the total average real estate basis subject to capitalization.
5) 2027 Key lease expirations
- We estimate that 1.4 million RSF of leases expiring in 2027, with approximately
$100 .5 million of annual rental revenue, will have downtime after lease expiration. These 2027 expirations have a weighted-average contractual lease expiration date inMarch 2027 and an expected weighted-average downtime ranging from 9 to 24 months. Refer to "Contractual lease expirations" in the Supplemental Information for additional details.
| 2027 Key Lease Expirations | ||||||
| RSF | | Annual Rental | | Weighted-Average | | Weighted-Average |
| 1,377,960 | | | | | | 9 to 24 months |
We expect to introduce 2027 guidance and related key assumptions, and 2027 key sources and uses of capital at our Investor Day on
Summary of key items that may impact 2027 and 2028 results
The following key considerations for 2027 and 2028 reflect our preliminary expectations based on current market conditions. These expectations could change materially and are subject to a variety of factors, including industry, governmental, geopolitical, and macroeconomic conditions, including changes in interest rates, as well as other factors described in our
1) Operating occupancy
- For the year ending
December 31, 2027 , we expect average operating occupancy to temporarily decline relative to our projected operating occupancy as ofDecember 31, 2026 , primarily due to expected downtime associated with the 1.4 million RSF of 2027 key lease expirations disclosed in "Contractual lease expirations" in the Supplemental Information, as well as the potential for tenant wind-downs. - For the year ending
December 31, 2028 , we expect average operating occupancy to improve relative to our projected average operating occupancy for the year endingDecember 31, 2027 , driven by the lease-up of temporary vacancy partially offset by approximately 718 thousand RSF of 2028 key lease expirations with expected downtime as disclosed in "Contractual lease expirations" in the Supplemental Information.
2) Same property performance
- For the year ending
December 31, 2027 , we expect same property net operating income performance to improve compared with the midpoint of our guidance range for 2026 but remain negative, primarily due to the expected temporary year-over-year decline in average operating occupancy, including the impact of expected downtime associated with 1.4 million RSF of 2027 key lease expirations. - For the year ending
December 31, 2028 , we expect same property net operating income performance to improve compared with 2027, primarily driven by operating occupancy growth and the lease-up of vacant space, subject to leasing and market conditions.
3) Construction spending
- For 2027, we continue to apply a disciplined approach to reduce construction spending and we seek to prioritize leased projects with high incremental returns. We expect 2027 construction spending to primarily focus on (i) revenue- and non-revenue-enhancing capital expenditures, which are expected to represent the majority of spend, approximately half of which is associated with space that is leased or under lease negotiations, in order to support the leasing of vacant space and renewals and re-leasing of space at our operating properties and (ii) construction spending required to complete our development and redevelopment projects that are expected to stabilize through 2028 and are 77% leased/negotiating as of
October 26, 2026 . - For 2028, we expect a further decline in construction spending relative to 2027, primarily driven by lower development and redevelopment spending. Construction spending on revenue- and non-revenue-enhancing capital expenditures related to our operating portfolio is expected to continue to support the lease-up of temporary vacancy, subject to leasing and market conditions.
4) Transactional and other capital sources
- For 2027, capital will be required to fund construction spending as we continue to prudently manage our key credit metrics, including net debt and preferred stock to Adjusted EBITDA ratio. In general, we expect to rely on asset recycling transactions, and other sources of cost-effective capital to support the achievement of our 2027 key credit metric ratio targets, including net debt and preferred stock to Adjusted EBITDA.
- For 2028, if we have growth in Adjusted EBITDA, we may use incremental long-term debt to fund a portion of our capital needs on a leverage neutral basis. In addition, we may use asset recycling and other sources of cost-effective capital to support the achievement of our 2028 key credit metric ratio targets, including net debt and preferred stock to Adjusted EBITDA.
Dispositions and Sales of Partial Interests
(Dollars in thousands)
| | | | | Date of | | Interest | | Square Footage | | Price (Our Share) | | ||
| Property | | Submarket/Market | | | | Operating | | Future | | | |||
| Completed in 1H26 | | | | | | | | | | | | $ 7,350 | |
| | | | | | | | | | | | | | |
| Non-core and land dispositions completed in 3Q26: | | | | | | | | | | | | | |
| 3825 and 3875 Fabian Way(1) | | | | | | 100 % | | 228,000 | | 250,000 | | 163,000 | |
| One Hampshire Street(2) | | | | | | 100 % | | 104,956 | | — | | 44,900 | |
| 3911, 3931, 4025, 4031, 4045, and | | | | | | 100 % | | 95,814 | | 144,000 | | 26,500 | |
| Dispositions completed in 3Q26 | | | | | | | | | | | | 234,400 | (4) |
| Total dispositions completed in YTD 3Q26 | | | | | | | | | | | | 241,750 | |
| | | | | | | | | | | | | | |
| Completed in | | | | | | | | | | | | | |
| Sales of partial interests: | | | | | | | | | | | | | |
| Campus Point by Alexandria(5) | | | | | | (5) | | 1,586,697 | | 366,816 | | 475,000 | |
| Total completed 2026 dispositions and sales of partial interests as of | | | | | | | | | | | | 716,750 | |
| Our share of pending dispositions and sales of partial interests subject to: | | | | | | | | | | | | | |
| Non-refundable deposits | | | | | | | | | | | | 355,400 | |
| Signed letters of intent and/or purchase and sale agreement late-stage negotiations | | | | | | | | | | | | 1,547,850 | |
| | | | | | | | | | | | | 2,620,000 | |
| Proceeds from dispositions and sales of partial interests in excess of 2026 guidance | | | | | | | | | | | | (720,000) | |
| 2026 guidance midpoint for dispositions and sales of partial interests | | | | | | | | | | | | $ 1,900,000 | |
| | | | | | | | | | | | | | |
| 2026 guidance range for dispositions and sales of partial interests | | | | | | | | | | ||||
| Weighted-average projected completion date of 2026 dispositions and sales of partial interests | | | | | | | (7) | ||||||
| | | | | | | | | | | | | | |
| (1) | Represents one future development project aggregating 250,000 SF at |
| (2) | Represents one vacant office property that was originally acquired with the intent to redevelop for life science use and expand our Megacampus ecosystem. The asset was sold due to the macroeconomic outlook for the project and the significant capital required to redevelop and lease the property. |
| (3) | Represents five operating properties, primarily comprising non-laboratory space, and one land parcel. As of 2Q26, these operating properties were 30% occupied with a weighted-average lease term of 2.4 years, and were sold due to the significant capital that would have been required to convert these properties through redevelopment for laboratory use and their misalignment with our Megacampus strategy. |
| (4) | Our share of dispositions completed during the three months ended |
| (5) | In |
| (6) | Refer to "Key Sources and Uses of Capital" under "2026 Guidance" in the Earnings Press Release for additional details. |
| (7) | Including the impact of the |
Earnings Call Information and About the Company
We will host a conference call on
Additionally, a copy of this Earnings Press Release and Supplemental Information for the third quarter ended
For any questions, please contact corporateinformation@are.com;
About the Company
Forward-Looking Statements
This document includes "forward-looking statements" within the meaning of Section 27A of the Securities Act of 1933, as amended, and Section 21E of the Securities Exchange Act of 1934, as amended. Such forward-looking statements include, without limitation, statements regarding our projected 2026 funds from operations per share, projected 2026 funds from operations per share, as adjusted, projected net operating income, and our projected sources and uses of capital. You can identify the forward-looking statements by their use of forward-looking words, such as "forecast," "guidance," "goals," "projects," "estimates," "anticipates," "believes," "expects," "intends," "may," "plans," "seeks," "should," "targets," or "will," or the negative of those words or similar words. These forward-looking statements are based on our current expectations, beliefs, projections, future plans and strategies, anticipated events or trends, and similar expressions concerning matters that are not historical facts, as well as a number of assumptions concerning future events. There can be no assurance that actual results will not be materially higher or lower than these expectations. These statements are subject to risks, uncertainties, assumptions, and other important factors that could cause actual results to differ materially from the results discussed in the forward-looking statements. Factors that might cause such a difference include, without limitation, our failure to obtain capital (debt, construction financing, and/or equity) or refinance debt maturities, lower than expected yields, increased interest rates and operating costs, adverse economic or real estate developments in our markets, our failure to successfully place into service and lease any properties undergoing development or redevelopment and our existing space held for future development or redevelopment (including new properties acquired for that purpose), our failure to successfully operate or lease acquired properties, decreased rental rates, increased vacancy rates or failure to renew or replace expiring leases, defaults on or non-renewal of leases by tenants, our failure to complete planned dispositions and sales of partial interests on anticipated terms or timing, adverse general and local economic conditions, an unfavorable capital market environment, decreased leasing activity or lease renewals, failure to obtain LEED and other healthy building certifications and efficiencies, and other risks and uncertainties detailed in our filings with the Securities and Exchange Commission ("
This document is not an offer to sell or a solicitation to buy securities of
| Consolidated Statements of Operations | ||||||||||||||
| | | Three Months Ended | | Nine Months Ended | ||||||||||
| | | | | | | | | | | | | | | |
| Revenues: | | | | | | | | | | | | | | |
| Income from rentals | | $ 653,618 | | $ 643,210 | | $ 653,013 | | $ 728,872 | | $ 735,849 | | $ 1,949,841 | | $ 2,216,303 |
| Other income | | 17,564 | | 19,574 | | 18,009 | | 25,542 | | 16,095 | | 55,147 | | 55,839 |
| Total revenues | | 671,182 | | 662,784 | | 671,022 | | 754,414 | | 751,944 | | 2,004,988 | | 2,272,142 |
| | | | | | | | | | | | | | | |
| Expenses: | | | | | | | | | | | | | | |
| Rental operations | | 227,931 | | 207,336 | | 224,142 | | 232,543 | | 239,234 | | 659,409 | | 690,062 |
| General and administrative | | 40,915 | | 36,861 | | 34,685 | | 28,020 | | 29,224 | | 112,461 | | 89,027 |
| Interest | | 79,687 | | 64,342 | | 64,584 | | 65,674 | | 54,852 | | 208,613 | | 161,024 |
| Depreciation and amortization | | 304,419 | | 304,384 | | 305,441 | | 322,063 | | 340,230 | | 914,244 | | 1,028,415 |
| Impairment of real estate | | 637,904 | (1) | 222,470 | | 5,499 | | 1,717,188 | | 323,870 | | 865,873 | | 485,630 |
| Total expenses | | 1,290,856 | | 835,393 | | 634,351 | | 2,365,488 | | 987,410 | | 2,760,600 | | 2,454,158 |
| | | | | | | | | | | | | | | |
| Equity in earnings (losses) of unconsolidated real estate joint ventures | | 75 | | 413 | | (147) | | (304) | | 201 | | 341 | | (9,327) |
| Investment income (losses) | | 23,990 | | 133,227 | | (4,582) | | (3,890) | | 28,161 | | 152,635 | | (52,453) |
| (Loss) gain on early extinguishment of debt | | (3,323) | | — | | 366,435 | | — | | (107) | | 363,112 | | (107) |
| Gain on sales of real estate | | — | | — | | — | | 619,914 | | 9,366 | | — | | 22,531 |
| Net (loss) income | | (598,932) | | (38,969) | | 398,377 | | (995,354) | | (197,845) | | (239,524) | | (221,372) |
| Net income attributable to noncontrolling interests | | (38,754) | | (33,814) | | (36,724) | | (85,521) | | (34,909) | | (109,292) | | (127,323) |
| Net (loss) income attributable to | | (637,686) | | (72,783) | | 361,653 | | (1,080,875) | | (232,754) | | (348,816) | | (348,695) |
| Net income attributable to unvested restricted stock awards | | (766) | | (908) | | (2,779) | | (965) | | (2,183) | | (2,603) | | (7,452) |
| Net (loss) income attributable to | | $ (638,452) | | $ (73,691) | | $ 358,874 | | $ (1,081,840) | | $ (234,937) | | $ (351,419) | | $ (356,147) |
| | | | | | | | | | | | | | | |
| Net (loss) income per share attributable to | | | | | | | | | | | | | | |
| Basic | | $ (3.74) | | $ (0.43) | | $ 2.10 | | $ (6.35) | | $ (1.38) | | $ (2.06) | | $ (2.09) |
| Diluted | | $ (3.74) | | $ (0.43) | | $ 2.10 | | $ (6.35) | | $ (1.38) | | $ (2.06) | | $ (2.09) |
| | | | | | | | | | | | | | | |
| Weighted-average shares of common stock outstanding: | | | | | | | | | | | | | | |
| Basic | | 170,751 | | 170,718 | | 170,598 | | 170,394 | | 170,181 | | 170,689 | | 170,278 |
| Diluted | | 170,751 | | 170,718 | | 170,867 | | 170,394 | | 170,181 | | 170,689 | | 170,278 |
| | | | | | | | | | | | | | | |
| Dividends declared per share of common stock | | $ 0.72 | | $ 0.72 | | $ 0.72 | | $ 0.72 | | $ 1.32 | | $ 2.16 | | $ 3.96 |
| |
| (1) Refer to "Funds from operations and funds from operations per share" in the Earnings Press Release for additional details regarding impairment of real estate. |
| |
| Consolidated Balance Sheets | ||||||||||
| | | | | | | | | | | |
| Assets | | | | | | | | | | |
| Investments in real estate | | $ 28,426,999 | | $ 29,125,895 | | $ 28,830,116 | | $ 28,689,996 | | $ 31,743,917 |
| Investments in unconsolidated real estate joint ventures | | 28,580 | | 28,910 | | 30,520 | | 30,677 | | 39,601 |
| Cash and cash equivalents | | 508,855 | | 470,449 | | 418,720 | | 549,062 | | 579,474 |
| Restricted cash | | 4,908 | | 4,690 | | 4,665 | | 4,693 | | 4,705 |
| Tenant receivables | | 6,168 | | 7,661 | | 7,362 | | 6,672 | | 6,409 |
| Deferred rent | | 1,210,911 | | 1,209,722 | | 1,200,047 | | 1,179,403 | | 1,257,378 |
| Deferred leasing costs | | 452,164 | | 453,761 | | 456,405 | | 458,311 | | 505,241 |
| Investments | | 1,735,673 | | 1,685,695 | | 1,536,419 | | 1,501,249 | | 1,537,638 |
| Other assets | | 1,677,464 | | 1,645,443 | | 1,683,143 | | 1,661,772 | | 1,700,785 |
| Total assets | | $ 34,051,722 | | $ 34,632,226 | | $ 34,167,397 | | $ 34,081,835 | | $ 37,375,148 |
| | | | | | | | | | | |
| Liabilities, Noncontrolling Interests, and Equity | | | | | | | | | | |
| Unsecured senior notes payable | | $ 10,820,687 | | $ 10,818,366 | | $ 11,166,009 | | $ 12,047,394 | | $ 12,044,999 |
| Junior subordinated notes payable | | 985,143 | | — | | — | | — | | — |
| Unsecured senior line of credit and commercial paper | | 1,091,166 | | 1,994,508 | | 1,353,986 | | 353,161 | | 1,548,542 |
| Accounts payable, accrued expenses, and other liabilities | | 2,604,418 | | 2,513,526 | | 2,154,782 | | 2,397,073 | | 2,432,726 |
| Dividends payable | | 131,999 | | 130,468 | | 128,880 | | 127,771 | | 230,603 |
| Total liabilities | | 15,633,413 | | 15,456,868 | | 14,803,657 | | 14,925,399 | | 16,256,870 |
| | | | | | | | | | | |
| Commitments and contingencies | | | | | | | | | | |
| | | | | | | | | | | |
| Redeemable noncontrolling interests | | 9,119 | | 9,119 | | 9,234 | | 58,788 | | 58,662 |
| | | | | | | | | | | |
| | | | | | | | | | | |
| Common stock | | 1,708 | | 1,707 | | 1,707 | | 1,705 | | 1,703 |
| Additional paid-in capital | | 14,839,182 | | 15,585,296 | | 15,763,321 | | 15,497,760 | | 16,669,802 |
| Accumulated other comprehensive loss | | (33,691) | | (33,027) | | (30,936) | | (29,395) | | (32,203) |
| | | 14,807,199 | | 15,553,976 | | 15,734,092 | | 15,470,070 | | 16,639,302 |
| Noncontrolling interests | | 3,601,991 | | 3,612,263 | | 3,620,414 | | 3,627,578 | | 4,420,314 |
| Total equity | | 18,409,190 | | 19,166,239 | | 19,354,506 | | 19,097,648 | | 21,059,616 |
| Total liabilities, noncontrolling interests, and equity | | $ 34,051,722 | | $ 34,632,226 | | $ 34,167,397 | | $ 34,081,835 | | $ 37,375,148 |
| Funds From Operations and Funds From Operations per Share |
| |
| The following table presents a reconciliation of net income (loss) attributable to Alexandria's common stockholders, the most directly comparable financial measure presented in accordance with |
| |
| | | Three Months Ended | | Nine Months Ended | ||||||||||
| | | 9/30/26 | | 6/30/26 | | 3/31/26 | | 12/31/25 | | 9/30/25 | | 9/30/26 | | 9/30/25 |
| Net (loss) income attributable to Alexandria's common stockholders – basic and diluted | | $ (638,452) | | $ (73,691) | | $ 358,874 | | $(1,081,840) | | $ (234,937) | | $ (351,419) | | $ (356,147) |
| Depreciation and amortization of real estate assets | | 302,240 | | 302,238 | | 303,296 | | 319,865 | | 338,182 | | 907,774 | | 1,021,292 |
| Noncontrolling share of depreciation and amortization from consolidated real estate JVs | | (32,458) | | (31,518) | | (29,473) | | (39,942) | | (45,327) | | (93,449) | | (114,785) |
| Our share of depreciation and amortization from unconsolidated real estate JVs | | 858 | | 805 | | 914 | | 855 | | 852 | | 2,577 | | 2,848 |
| Gain on sales of real estate | | — | | — | | — | | (307,132) | | (9,824) | | — | | (22,989) |
| Impairment of real estate – rental properties and land | | 637,904 | (1) | 222,470 | | 5,499 | | 1,439,303 | | 323,870 | | 865,873 | | 454,960 |
| Allocation to unvested restricted stock awards | | (1,042) | | (2,201) | | (2,181) | | (1,903) | | (1,648) | | (7,141) | | (3,590) |
| Funds from operations attributable to Alexandria's common stockholders – diluted(2) | | 269,050 | | 418,103 | | 636,929 | | 329,206 | | 371,168 | | 1,324,215 | | 981,589 |
| Unrealized (gains) losses on non-real estate investments | | (21,563) | | (131,933) | | 10,332 | | (98,548) | | (18,515) | | (143,164) | | 71,568 |
| Significant realized losses on non-real estate investments | | — | | — | | — | | 103,329 | | — | | — | | — |
| Impairment of non-real estate investments | | 13,580 | (3) | 8,998 | | 12,448 | | 20,181 | | 25,139 | | 35,026 | | 75,535 |
| Impairment of real estate | | — | | — | | — | | 12,619 | | — | | — | | 39,343 |
| Loss (gain) on early extinguishment of debt | | 3,323 | | — | | (366,435) | | — | | 107 | | (363,112) | | 107 |
| Acceleration of stock compensation expense due to executive officer resignation | | — | | — | | — | | 2,455 | | — | | — | | — |
| (Decrease) increase in provision for expected credit losses on financial instruments | | — | | — | | — | | (341) | | — | | — | | 285 |
| Allocation to unvested restricted stock awards | | 33 | | 909 | | 2,674 | | (363) | | (74) | | 3,496 | | (2,156) |
| Funds from operations attributable to Alexandria's common stockholders – diluted, as | | $ 264,423 | | $ 296,077 | | $ 295,948 | | $ 368,538 | | $ 377,825 | | $ 856,461 | | $ 1,166,271 |
Refer to "Definitions and reconciliations" in the Supplemental Information for additional details.
| (1) | Primarily reflects impairment charges to reduce the carrying amounts of real estate assets classified as held for sale as of 3Q26 to their respective estimated fair values less costs to sell, including (i) $343.3 million related to a development project in our Fenway submarket that is expected to be sold to an institutional user which would have required significant capital to complete and lease, (ii) $135.3 million related to four non-Megacampus vacant office properties in our |
| (2) | Calculated in accordance with standards established by the Nareit Board of Governors. |
| (3) | Primarily relates to one non-real estate investment in a privately held entity that does not report NAV. |
The following table presents a reconciliation of net income (loss) per share attributable to Alexandria's common stockholders, the most directly comparable financial measure presented in accordance with GAAP, including our share of amounts from consolidated and unconsolidated real estate joint ventures, to funds from operations per share attributable to Alexandria's common stockholders – diluted, and funds from operations per share attributable to Alexandria's common stockholders – diluted, as adjusted, for the periods below. Per share amounts may not add due to rounding.
| | | Three Months Ended | | Nine Months Ended | ||||||||||
| | | 9/30/26 | | 6/30/26 | | 3/31/26 | | 12/31/25 | | 9/30/25 | | 9/30/26 | | 9/30/25 |
| Net (loss) income per share attributable to Alexandria's common stockholders – diluted | | $ (3.74) | | $ (0.43) | | $ 2.10 | | $ (6.35) | | $ (1.38) | | $ (2.06) | | $ (2.09) |
| Depreciation and amortization of real estate assets | | 1.58 | | 1.59 | | 1.61 | | 1.65 | | 1.73 | | 4.77 | | 5.34 |
| Gain on sales of real estate | | — | | — | | — | | (1.80) | | (0.06) | | — | | (0.14) |
| Impairment of real estate – rental properties and land | | 3.74 | | 1.30 | | 0.03 | | 8.45 | | 1.90 | | 5.07 | | 2.67 |
| Allocation to unvested restricted stock awards | | (0.01) | | (0.02) | | (0.01) | | (0.02) | | (0.01) | | (0.04) | | (0.02) |
| Funds from operations per share attributable to Alexandria's common stockholders – | | 1.57 | | 2.44 | | 3.73 | | 1.93 | | 2.18 | | 7.74 | | 5.76 |
| Unrealized (gains) losses on non-real estate investments | | (0.13) | | (0.77) | | 0.06 | | (0.58) | | (0.11) | | (0.84) | | 0.42 |
| Significant realized losses on non-real estate investments | | — | | — | | — | | 0.61 | | — | | — | | — |
| Impairment of non-real estate investments | | 0.08 | | 0.05 | | 0.07 | | 0.12 | | 0.15 | | 0.20 | | 0.45 |
| Impairment of real estate | | — | | — | | — | | 0.07 | | — | | — | | 0.23 |
| Loss (gain) on early extinguishment of debt | | 0.02 | | — | | (2.14) | | — | | — | | (2.12) | | — |
| Acceleration of stock compensation expense due to executive officer resignation | | — | | — | | — | | 0.01 | | — | | — | | — |
| Allocation to unvested restricted stock awards | | — | | 0.01 | | 0.01 | | — | | — | | 0.02 | | (0.01) |
| Funds from operations per share attributable to Alexandria's common stockholders – | | $ 1.54 | | $ 1.73 | | $ 1.73 | | $ 2.16 | | $ 2.22 | | $ 5.00 | | $ 6.85 |
| | | | | | | | | | | | | | | |
| Weighted-average shares of common stock outstanding – diluted | | | | | | | | | | | | | | |
| Earnings per share – diluted | | 170,751 | | 170,718 | | 170,867 | | 170,394 | | 170,181 | | 170,689 | | 170,278 |
| Funds from operations – diluted, per share | | 171,418 | | 171,210 | | 170,867 | | 170,504 | | 170,305 | | 171,169 | | 170,351 |
| Funds from operations – diluted, as adjusted, per share | | 171,418 | | 171,210 | | 170,867 | | 170,504 | | 170,305 | | 171,169 | | 170,351 |
Refer to "Definitions and reconciliations" in the Supplemental Information for additional details.
 View original content to download multimedia:https://www.prnewswire.com/news-releases/alexandria-real-estate-equities-inc-reports-3q26-and-ytd-3q26-net-loss-per-share--diluted-of-3-74-and-2-06--respectively-and-3q26-and-ytd-3q26-ffo-per-share--diluted-as-adjusted-of-1-54-and-5-00--respectively-302919655.html
SOURCE