ROAD TOWN,
Looking ahead to 2026, we project production to grow to 360,000–390,000 GEO while we still prepare MSG and Apoena for higher output, pursue opportunities to increase capacity at Borborema, advance underground development and expand capacity at Almas, continue exploration and studies to grow Matupá’s Resources & Reserves, and progress our drill campaign in Carajás. Yet, we are just in the beginning. Throughout 2025 and recent months, Aura has taken decisive steps toward our forecast of exceeding 600,000 GEO per year, while we continue to identify and pursue opportunities to go even further.”
Operational & Financial Headlines Q4 2025 and 2025
| (US$ thousand) | Q4 2025 | Q3 2025 | QoQ Change % | Q4 2024 | YoY Change% | 2025 | 2024 | Change % | ||||||||
| Total Production (GEO) | 82,067 | 74,227 | 11% | 66,473 | 23% | 280,414 | 267,232 | 5% | ||||||||
| Total Sales (GEO) | 80,447 | 74,907 | 7% | 69,341 | 16% | 278,296 | 269,833 | 3% | ||||||||
| Net Revenue | 321,661 | 247,832 | 30% | 171,517 | 88% | 921,733 | 594,163 | 55% | ||||||||
| Gross Profit | 202,897 | 149,609 | 36% | 81,099 | 150% | 534,873 | 251,270 | 113% | ||||||||
| Gross Margin | 63% | 60% | 3 p.p. | 47% | 16 p.p. | 58% | 42% | 16 p.p. | ||||||||
| Adjusted EBITDA | 207,948 | 152,105 | 37% | 79,319 | 162% | 547,755 | 266,768 | 105% | ||||||||
| Adjusted EBITDA Margin | 65% | 61% | 3 p.p. | 46% | 18 p.p. | 59% | 45% | 15 p.p. | ||||||||
| Net Income | (19,864) | 5,626 | n.a. | 16,644 | n.a. | (79,340) | (30,271) | 162% | ||||||||
| Net Income Margin | -6% | 2% | n.a. | 10% | n.a. | -9% | -5% | -4 p.p. | ||||||||
| Adjusted Net Income | 73,276 | 68,672 | 7% | 24,636 | 197% | 205,680 | 81,548 | 152% | ||||||||
| Adjusted Net Income Margin | 23% | 28% | -5 p.p. | 14% | 8 p.p. | 22% | 14% | 9 p.p. | ||||||||
| Cash Cost (US$/GEO) | 1,143 | 1,110 | 3% | 1,098 | 4% | 1,136 | 1,041 | 9% | ||||||||
| All In Sustaining cost (US$/GEO) | 1,521 | 1,396 | 9% | 1,373 | 11% | 1,458 | 1,320 | 10% | ||||||||
| Operating Cash Flow | 91,979 | 93,096 | -1% | 66,003 | 42% | 305,184 | 222,237 | 37% | ||||||||
| Net Debt/LTM EBITDA | 0.28x | 0.15x | 0.13x | 0.70x | -0.47x | 0.28x | 0.70x | -0.47x | ||||||||
| Total CAPEX | 45,779 | 31,605 | 45% | 66,816 | -30% | 179,434 | 180,577 | -1% | ||||||||
Except as otherwise noted in this document, references herein to “US$” or and “$” are to thousands of
Headlines
- Record Quarterly Production: Q4 2025 total production reached 82,067 gold equivalent ounces (GEO), up 11% from Q3 2025 and 23% from Q4 2024 at current metal prices. At constant prices, it was a record high, up 12% QoQ and 30% YoY, driven by:
- Almas: Up 5% to 15,872 GEO (higher ore processed and mine performance from plant expansion).
- Borborema: Up 54% to 15,777 GEO (ramp-up progress with higher milling throughput, higher-grade material, and improved recovery).
- MSG addition: 4,761 GEO in December.
- Strong Annual Production: FY 2025 total production was 280,414 GEO, up 5% from 2024 at current prices and 9% at constant prices. At 2025 guidance prices (ex-MSG), production was 285,380 GEO, achieving the upper half of the 266k-300k GEO guidance range, driven by:
- Almas: Up 5% to 56,979 GEO (22% higher ore processed from plant expansion, offset by lower grades).
- New projects: Borborema 28,573 GEO; MSG 4,761 GEO (December only).
- Sales Volumes: Q4 sales were 80,447 GEO, up 7% QoQ and 16% YoY at current prices, mainly from higher production; impacted by GEO conversion at Aranzazu. FY sales were 278,296 GEO, up 3% YoY, boosted by Borborema, MSG, and Almas gains.
- Record Net Revenues: Q4 reached
$321,661 , up 30% QoQ and 88% YoY, driven by higher gold prices and production; Borborema/MSG contributed 27%. FY reached$921,733 , up 55% YoY, including$108.2M from Borborema,$20.2M from MSG, and favorable prices.- Average gold prices: Q4 U$4,090/oz (+21% QoQ, +58% YoY); FY
$3,446 /oz (+49% YoY). - Average copper prices: Q4 U$5.06/lb (+14% QoQ, +22% YoY); FY
$4.51 /lb (+8% YoY).
- Average gold prices: Q4 U$4,090/oz (+21% QoQ, +58% YoY); FY
- Record Adjusted EBITDA: Q4 hit U$207,948 (sixth consecutive quarterly record), up 37% QoQ and 162% YoY; FY U$547,755, more than double 2024. Driven by higher production/sales, metal prices, and controlled costs.
- AISC Performance: Q4 AISC
$1,521 /GEO, up 9% QoQ at current prices, due to MSG ($3,187 /GEO) and Aranzazu GEO conversion. Ex-MSG/constant prices:$1,363 /GEO (+3% QoQ, -1% YoY), benefiting from Borborema's low costs. FY AISCUS$1,458 /GEO (+10% YoY); at constant prices ex-MSG:$1,346 /GEO (+2% YoY); at guidance prices:US$1,368 /GEO (low end ofUS$1,374-US$1,492 range). - Strong Recurring Free Cash Flow: Q4 U$94.2M, up 26% QoQ and 40% YoY, driven by record Adjusted EBITDA, offset by taxes, gold hedge losses, and temporary increase in working capital. FY U$253.7M, up 30% YoY, fueled by 105% Adjusted EBITDA growth.
- Improved Net Debt Position: Ended 2025 at U$117,619 (0.28x LTM EBITDA), up QoQ from MSG acquisition (U$72.8M), but down 32% YoY from strong cash flows and U$200M NASDAQ IPO proceeds. Offset U$111.0M expansion CAPEX, U$115.8M dividends/buybacks (+172% YoY), and acquisitions.
OTHER UPDATES Q4 2026:
Acquisition of the
Feasibility Study for the
Update to its coming years growth outlook: On
Exercise of Warrants in Altamira Gold Corp: In
Era Dorada Project Construction License and Early Works: On
Borborema: On
Results Teleconference:
Date:
Time:
Link to access: Click here
2. Consolidated Financial Results
In terms of production and sales, for all assets except Aranzazu, references herein to “GEO” are equivalent to actual gold ounces.
2.1 Total Production and Sales (GEO)
| (GEO) | Q4 2025 | Q3 2025 | QoQ Change % | Q4 2024 | YoY Change% | 2025 | 2024 | Change % | |||
| Production | |||||||||||
| Aranzazu¹ | 18,878 | 21,534 | -12 | % | 23,379 | -19 | % | 83,149 | 97,559 | -15 | % |
| Apoena | 8,961 | 9,248 | -3 | % | 7,121 | 26 | % | 35,304 | 37,173 | -5 | % |
| Minosa | 17,818 | 18,138 | -2 | % | 19,294 | -8 | % | 71,649 | 78,372 | -9 | % |
| Almas | 15,872 | 15,088 | 5 | % | 16,679 | -5 | % | 56,979 | 54,129 | 5 | % |
| Borborema | 15,777 | 10,219 | 54 | % | n.a. | n.a. | 28,573 | n.a. | n.a. | ||
| MSG² | 4,761 | n.a. | n.a. | n.a. | n.a. | 4,761 | n.a. | n.a. | |||
| Total | 82,067 | 74,227 | 11 | % | 66,473 | 23 | % | 280,414 | 267,232 | 5 | % |
| (GEO) | Q4 2025 | Q3 2025 | QoQ Change % | Q4 2024 | YoY Change% | 2025 | 2024 | Change % | |||
| Sales | |||||||||||
| Aranzazu¹ | 18,068 | 21,514 | -16 | % | 23,379 | -23 | % | 82,328 | 97,649 | -16 | % |
| Apoena | 8,961 | 9,249 | -3 | % | 9,944 | -10 | % | 35,836 | 39,019 | -8 | % |
| Minosa | 16,972 | 17,827 | -5 | % | 19,338 | -12 | % | 70,161 | 79,072 | -11 | % |
| Almas | 15,872 | 15,089 | 5 | % | 16,679 | -5 | % | 56,979 | 54,129 | 5 | % |
| Borborema | 15,777 | 11,228 | 41 | % | n.a. | n.a. | 28,195 | n.a. | n.a. | ||
| MSG² | 4,797 | n.a. | n.a. | n.a. | n.a. | 4,797 | n.a. | n.a. | |||
| Total | 80,447 | 74,907 | 7 | % | 69,340 | 16 | % | 278,296 | 269,869 | 3 | % |
Notes: (1) Applies the metal sale prices in Aranzazu realized during Q4 2025: Copper price =
Total production in Q4 2025 reached 82,067 gold equivalent ounces (“GEO”), 11% higher than Q3 2025 and 23% higher when compared to Q4 2024 at current metal prices, mainly due to negative impact from the copper-to-GEO conversion at Aranzazu. At constant prices, Aura’s quarterly production was record high, increasing by 12% compared to Q3 2025 and 29% above Q4 2024. When compared to the last quarter, the result was mainly attributable to stronger operational performance driven by higher ore processed volumes and improved grades at Almas, the production increase of Borborema and the inclusion of MSG in December.
In 2025, production reached 280,414 GEO, representing a 5% increase in current metal prices. At constant 2024 prices — which neutralize the effect of copper price fluctuations in the GEO conversion at Aranzazu — production was of 292,536 an increase of 9% over the 267,232 GEO produced in 2024, also due to Borborema production, Almas improvements and the additional of MSG. At 2025 Production Guidance Prices and excluding MSG, the 2025 production was 285,380 GEO, ending the year achieving the upper half of the Company’s 2025 Production Guidance (266k GEO – 300k GEO).
2.2. Net Revenue
| (US$ thousand) | Q4 2025 | Q3 2025 | QoQ Change % | Q4 2024 | YoY Change% | 2025 | 2024 | Change % | |||
| Aranzazu | 66,541 | 67,094 | -1 | % | 52,664 | 26 | % | 246,405 | 196,787 | 25 | % |
| Apoena | 36,102 | 31,223 | 16 | % | 26,024 | 39 | % | 120,389 | 90,273 | 33 | % |
| Minosa | 67,476 | 59,204 | 14 | % | 48,899 | 38 | % | 230,518 | 177,692 | 30 | % |
| Almas | 65,774 | 51,329 | 28 | % | 43,930 | 50 | % | 195,981 | 129,411 | 51 | % |
| Borborema | 65,530 | 38,982 | 68 | % | n.a. | n.a. | 108,202 | n.a. | n.a. | ||
| MSG | 20,238 | n.a. | n.a. | n.a. | n.a. | 20,238 | n.a. | n.a. | |||
| Total | 321,661 | 247,832 | 30 | % | 171,517 | 88 | % | 921,733 | 594,163 | 55 | % |
In Q4 2025, the Company reported Net Revenue of
With this result, Net Revenues reached
2.3. Cash Cost and All in Sustaining Costs
| (US$/GEO) | Q4 2025 | Q3 2025 | QoQ Change % | Q4 2024 | YoY Change% | 2025 | 2024 | Change % | |||
| Cash Cost | 1,143 | 1,110 | 2 | % | 1,098 | 3 | % | 1,136 | 1,041 | 9 | % |
| Aranzazu | 1,228 | 1,133 | 8 | % | 980 | 25 | % | 1,156 | 965 | 20 | % |
| Apoena | 1,450 | 1,082 | 34 | % | 1,793 | -19 | % | 1,232 | 1,189 | 4 | % |
| Minosa | 1,087 | 1,192 | -9 | % | 1,234 | -8 | % | 1,152 | 1,126 | 2 | % |
| Almas | 837 | 986 | -15 | % | 692 | 21 | % | 1,004 | 950 | 6 | % |
| Borborema | 931 | 1,127 | -17 | % | n.a | n.a. | 1,009 | n.a | n.a. | ||
| MSG | 2,148 | n.a | n.a. | n.a | n.a. | 2,148 | n.a | n.a. | |||
| All-in Sustaining Cost | 1,521 | 1,396 | 9 | % | 1,373 | 11 | % | 1,458 | 1,320 | 10 | % |
| Aranzazu | 1,732 | 1,513 | 15 | % | 1,431 | 21 | % | 1,569 | 1,308 | 20 | % |
| Apoena | 2,427 | 1,791 | 36 | % | 2,494 | -3 | % | 2,007 | 1,833 | 9 | % |
| Minosa | 1,267 | 1,378 | -8 | % | 1,295 | -2 | % | 1,297 | 1,205 | 8 | % |
| Almas | 962 | 1,128 | -15 | % | 713 | 35 | % | 1,150 | 1,139 | 1 | % |
| Borborema | 1,111 | 1,237 | -10 | % | n.a | n.a. | 1,175 | n.a | n.a. | ||
| MSG | 3,132 | n.a | n.a. | n.a | n.a. | 3,132 | n.a | n.a. | |||
For Q4 2025, the Company’s Cash Cost was
In 2025, Cash Cost averaged
In Q4 2025, consolidated All-in Sustaining Cost (AISC) at current metal prices totaled
In 2025, AISC reached
2.4. Gross Profit
| (US$ thousand) | Q4 2025 | Q3 2025 | QoQ Change % | Q4 2024 | YoY Change% | 2025 | 2024 | Change % | |||
| Net Revenue | 321,661 | 247,832 | 30 | % | 171,517 | 88 | % | 921,733 | 594,163 | 55 | % |
| Cost of goods sold | (118,764) | (98,223) | 21 | % | (90,418) | 31 | % | (386,860) | (342,893) | 13 | % |
| Cost of production | (50,599) | (44,745) | 13 | % | (57,615) | -12 | % | (184,733) | (162,511) | 14 | % |
| Cost of production – Contractors | (28,565) | (26,437) | 8 | % | (8,499) | 236 | % | (87,998) | (78,360) | 12 | % |
| Change in inventory (cash) | (12,747) | (11,983) | 6 | % | (10,034) | 27 | % | (43,406) | (40,172) | 8 | % |
| Depreciation and amortization | (26,853) | (15,058) | 78 | % | (14,270) | 88 | % | (70,723) | (61,851) | 14 | % |
| Gross Profit | 202,897 | 149,609 | 36 | % | 81,099 | 150 | % | 534,873 | 251,270 | 113 | % |
| Gross Margin | 63% | 60% | 3 p.p. | 47% | 16 p.p. | 58% | 42% | 16 p.p. | |||
In Q4 2025, Cost of Goods Sold (COGS) totaled
In Q4 2025, disciplined cost management and significant rise of 88% in Net Revenue compared to Q4 2024, drove Gross Profit to
2.5. Operating Expenses
| (US$ thousand) | Q4 2025 | Q3 2025 | QoQ Change % | Q4 2024 | YoY Change% | 2025 | 2024 | Change % | |||
| Gross Profit | 202,897 | 149,609 | 36 | % | 81,099 | 150 | % | 534,873 | 251,270 | 113 | % |
| Operational Expenses | (37,777) | (12,704) | 197 | % | (13,984) | 170 | % | (76,006) | (45,171) | 66 | % |
| General and administrative expenses | (18,761) | (10,371) | 81 | % | (10,539) | 78 | % | (50,052) | (33,273) | 50 | % |
| Exploration expenses | (2,595) | (2,333) | 13 | % | (4,775) | -46 | % | (8,018) | (13,961) | -44 | % |
| ARO Change in estimate for properties in C&M | (489) | n.a. | n.a. | 1,330 | -105 | % | (489) | 1,330 | -105 | % | |
| Other Expenses | (15,932) | (822) | 1838 | % | (315) | 4958 | % | (17,447) | (1,267) | 1277 | % |
| Operating income | 165,120 | 136,905 | 21 | % | 67,115 | 147 | % | 458,867 | 205,366 | 125 | % |
General and Administrative (“G&A”) expenses increased by 81% compared to Q3 2025, primarily reflecting: (i) payment of professional fees related to the MSG acquisition (non-recurring); (ii) the Feasibility Study for the
In 2025, the increase in G&A expenses was driven by the same factors, as well as costs related to the Nasdaq IPO.
Exploration expenses totaled
Other expenses primarily comprise provisions recognized to reflect the estimated partial non-recoverability of VAT credits related to Minosa (
The Company thus ended Q4 2025 with Operating Income of
2.6. Adjusted EBITDA
| (US$ thousand) | Q4 2025 | Q3 2025 | QoQ Change % | Q4 2024 | YoY Change% | 2025 | 2024 | Change % | |||
| Operating Income | 165,120 | 136,905 | 21 | % | 67,115 | 147 | % | 458,867 | 205,366 | 125 | % |
| Depreciation and Amortization | 26,407 | 15,200 | 74 | % | 13,534 | 95 | % | 70,952 | 62,732 | 13 | % |
| Change in ARO estimate | 489 | n.a. | n.a. | (1,330) | n.a. | 489 | (1,330) | n.a. | |||
| Other Expenses | 15,932 | 822 | n.a. | 315 | 17,447 | 1,267 | n.a. | ||||
| Adjusted EBITDA | 207,948 | 152,105 | 37 | % | 79,319 | 162 | % | 547,755 | 266,768 | 105 | % |
| Aranzazu | 40,986 | 40,252 | 2 | % | 24,910 | 65 | % | 140,886 | 90,773 | 55 | % |
| Almas | 50,673 | 34,872 | 45 | % | 30,520 | 66 | % | 132,334 | 74,513 | 78 | % |
| Borborema | 49,168 | 25,144 | 96 | % | n.a. | n.a | 76,524 | n.a. | n.a | ||
| Minosa | 47,900 | 36,035 | 33 | % | 23,576 | 103 | % | 144,024 | 83,203 | 73 | % |
| Apoena | 21,705 | 20,869 | 4 | % | 6,429 | 238 | % | 72,137 | 39,122 | 84 | % |
| MSG | 9,574 | - | n.a | - | n.a | 9,574 | - | n.a | |||
| Corporate, Projects and Other | (12,058) | (5,067) | 138 | % | (6,116) | 97 | % | (27,723) | (20,843) | 33 | % |
| Adjusted EBITDA Margin | 65% | 61% | 4 p.p. | 46% | 18 p.p. | 59% | 45% | 15 p.p. | |||
Adjusted EBITDA reached a new all-time high of
The year-over-year improvement was primarily driven by higher production, strong cost control and higher gold and copper prices, as discussed previously. This result was also noted on the Adjusted EBITDA margin gain of 18 p.p. compared to Q4 2024, supported by stronger metal prices but also by a 16% increase in sales volume.
In 2025, Adjusted EBITDA reached a record high of
2.7. Financial Result
| (US$ thousand) | Q4 2025 | Q3 2025 | QoQ Change % | Q4 2024 | YoY Change% | 2025 | 2024 | Change % | |||
| EBIT | 165,120 | 136,905 | 21 | % | 67,115 | 147 | % | 458,867 | 205,366 | 125 | % |
| Financial Result | (123,188) | (102,565) | 20 | % | (9,791) | 1159 | % | (406,994) | (151,679) | 168 | % |
| Accretion expense | 690 | (2,980) | n.a. | (1,419) | n.a. | (5,090) | (5,972) | -15 | % | ||
| Lease interest expense | (1,651) | (824) | 100 | % | (2,365) | -30 | % | (4,231) | (9,144) | -54 | % |
| Interest expense on loans and debentures | (8,274) | (5,786) | 43 | % | (6,447) | 28 | % | (25,913) | (22,063) | 17 | % |
| Finance cost on post-employment benefit | (867) | (535) | 62 | % | 204 | n.a. | (2,487) | (1,045) | 138 | % | |
| Unrealized loss with derivative gold collars | (81,723) | (75,252) | 9 | % | 9,252 | n.a. | (281,489) | (80,241) | 251 | % | |
| Realized loss with derivative gold collars | (21,650) | (17,130) | 26 | % | (5,376) | 303 | % | (56,519) | (5,376) | 951 | % |
| Loss on other derivative transactions | (2,180) | (685) | 218 | % | (3,386) | -36 | % | (5,997) | (4,707) | 27 | % |
| Change in liability measured at fair value | (5,296) | (1,036) | 411%. | n.a. | n.a. | (12,716) | n.a. | n.a. | |||
| Foreign exchange | (3,302) | (36) | n.a. | (1,273) | 169 | % | (8,976) | (12,268) | -27 | % | |
| Derivative fee | n.a. | n.a | n.a | n.a. | n.a. | n.a. | (13,522) | n.a. | |||
| Loss on settlement of liability with equity instruments | n.a. | n.a | n.a | n.a. | n.a. | (8,763) | n.a. | n.a. | |||
| Other finance costs | (2,587) | (585) | 342 | % | (2,397) | 8 | % | (3,904) | (3,444) | 13 | % |
| Finance expenses | (126,840) | (104,849) | 21 | % | (13,207) | 861 | % | (416,085) | (157,782) | 164 | % |
| Change in liability measured at fair value | n.a. | n.a. | n.a. | 804 | n.a. | n.a. | 719 | n.a. | |||
| Interest income | 3,652 | 2,284 | 60 | % | 2,612 | 40 | % | 9,091 | 5,384 | 69 | % |
| Finance income | 3,652 | 2,284 | 60 | % | 3,416 | 7 | % | 9,091 | 6,103 | 49%. | |
| Profit/ (loss) before income taxes | 41,932 | 33,518 | 25 | % | 57,009 | -27 | % | 51,873 | 52,420 | -1 | % |
The Company’s Financial Result in Q4 2025 was a loss of
- Unrealized loss on gold hedges in Q4 2025, arising from mark-to-market (MTM) adjustments related to outstanding gold hedge positions, reflecting increase in gold prices between the start and the end of the quarter, coming from
US$3,825.30 per Oz and reachingUS$4,386.30 per Oz at the end of the period. In accordance with IFRS standards, the Company records MTM adjustments at the end of each reporting period for all outstanding derivative positions. - Realized losses with gold hedges in Q4 2025 were related to cash settlement of outstanding gold collars during the quarter, driven by the expiration of gold collars within the quarter.
All of Aura’s outstanding gold collars (189,072 Ozs) are associated with the future production of the Borborema and will expire equally between January/2026 and June/2028. As previously disclosed, an estimated 80% of the production for the first 3 years of the
2.8. Net Income
| (US$ thousand) | Q4 2025 | Q3 2025 | QoQ Change % | Q4 2024 | YoY Change% | 2025 | 2024 | Change % | |||
| Profit/ (loss) before income taxes | 41,932 | 33,518 | 25 | % | 57,009 | -26 | % | 51,873 | 52,420 | -1 | % |
| Total taxes | (61,796) | (27,892) | 122 | % | (40,365) | 53 | % | (131,213) | (82,691) | 59 | % |
| Current income tax expense | (50,064) | (38,402) | 30 | % | (16,383) | 206 | % | (138,831) | (52,971) | 162 | % |
| Deferred income tax expense | (11,732) | 10,510 | n.a. | (23,982) | -51 | % | 7,618 | (29,720) | n.a. | ||
| Profit/(loss) for the period | (19,864) | 5,626 | n.a. | 16,644 | n.a. | (79,340) | (30,271) | 162 | % | ||
| -6% | 2% | 5 p.p. | 10% | 13 p.p. | -9% | -5% | 3 p.p. | ||||
| Unrealized loss with derivative gold collars | (81,723) | (75,252) | 9 | % | 9,252 | n.a. | (281,489) | (80,241) | 251 | % | |
| Foreign Exchange | (3,302) | (36) | n.a. | (1,273) | 159 | % | (8,976) | (12,268) | -27 | % | |
| Deferred taxes on non-monetary items | (8,115) | 12,242 | n.a. | (15,971) | -49 | % | 14,208 | (19,309) | n.a. | ||
| Loss on settlement of liability with equity instruments | n.a. | n.a. | n.a. | n.a. | n.a. | (8,763) | n.a. | n.a. | |||
| Adjusted Net Income | 73,276 | 68,672 | 7 | % | 24,636 | 197 | % | 205,680 | 81,548 | 152 | % |
Net income in Q4 2025 was
In 2025, Net Loss reached
Adjusted Net Income
As result of increase in the Company’s Operating Income, Adjusted Net Income in Q4 2025 reached
- Non-cash losses related to gold hedges:
US$(81.7) million - FX losses:
US$(3.3) million - Deferred taxes over non-monetary items
US$(8.1) million
As result of increase in the Company’s Operating Income, Adjusted Net Income in 2025 was
- Non-cash losses related to gold hedges:
US$(281.5) million - FX losses:
US$(9.0) million - Deferred taxes over non-monetary items
US$14.2 million - Loss on settlement of liability with equity instruments
US$(8.8) million
3. Performance of the Operating Units
3.1 Aranzazu
| (US$ thousand) | Q4 2025 | Q3 2025 | QoQ Change % | Q4 2024 | YoY Change% | 2025 | 2024 | Change % | |||
| Production at Constant Prices (GEO)¹ | 18,878 | 20,288 | -7 | % | 20,260 | -7 | % | 100,031 | 97,521 | 3 | % |
| Production at Current Prices (GEO) | 18,878 | 21,534 | -12 | % | 23,379 | -19 | % | 83,149 | 97,558 | -15 | % |
| Sales (GEO) | 18,068 | 21,514 | -16 | % | 23,379 | -23 | % | 82,328 | 97,649 | -16 | % |
| Cash Cost (US$/GEO) | 1,228 | 1,133 | 8 | % | 980 | 25 | % | 1,156 | 965 | 20 | % |
| AISC (US$/GEO) | 1,732 | 1,511 | 15 | % | 1,431 | 21 | % | 1,569 | 1,308 | 20 | % |
| Net Revenue | 66,541 | 67,094 | -1 | % | 52,664 | 26 | % | 246,405 | 196,787 | 25 | % |
| Cost of goods sold | (31,896) | (29,631) | 8 | % | (29,570) | 8 | % | (122,830) | (119,736) | 3 | % |
| Gross Profit | 34,645 | 37,463 | -8 | % | 23,094 | 50 | % | 123,575 | 77,051 | 60 | % |
| Expenses | (2,471) | (2,459) | 0 | % | (4,854) | -36 | % | (11,093) | (11,816) | -19 | % |
| General and administrative expenses | (1,711) | (1,784) | -4 | % | (4,140) | -59 | % | (6,785) | (7,143) | -5 | % |
| Exploration expenses | (1,416) | (675) | 110 | % | (714) | 98 | % | (3,594) | (4,673) | -23 | % |
| Other income (expenses) | 656 | (268) | n.a. | (363) | -281 | % | (714) | (1,840) | -61 | % | |
| EBIT | 31,906 | 35,004 | -9 | % | 18,240 | 73 | % | 112,482 | 65,235 | 77 | % |
| Adjusted EBITDA | 40,986 | 39,646 | 3 | % | 24,910 | 65 | % | 140,886 | 90,773 | 55 | % |
| Financial Result | (1,844) | (2,441) | -24 | % | (3,100) | -53 | % | (8,081) | (5,757) | 106 | % |
| Financial expenses, net | (2,112) | (2,173) | -3 | % | (2,737) | -23 | % | (8,081) | (3,917) | 106 | % |
| EBT | 30,062 | 32,563 | -8 | % | 15,140 | 99 | % | 104,401 | 59,478 | 76 | % |
| Total taxes | (13,668) | (8,088) | 69 | % | (12,539) | 9 | % | (41,671) | (30,939) | 35 | % |
| Current income tax expense | (3,013) | (10,248) | -71 | % | 3,489 | -186 | % | (32,727) | (15,859) | 106 | % |
| Deferred income tax expense | (10,655) | 2,160 | n.a. | (16,028) | -34 | % | (8,944) | (15,080) | -41 | % | |
| Profit for the period | 16,394 | 24,475 | -33 | % | 2,601 | 530 | % | 62,730 | 28,539 | 120 | % |
Applies the metal sale prices in Aranzazu realized during Q4 2025 for Q3 2025 and Q4 2024: Copper price =
At Aranzazu, production reached 18,878 GEO, representing a 12% decrease compared to the previous quarter and 19% over the Q4 2024, resulting mainly from metal prices since higher gold prices negatively impact the conversion to GEO. At constant prices, Aranzazu production was 7% lower when compared to Q3 2025 as well as compared to Q4 2024, due to slightly lower grades of copper, silver and gold, due to mine sequencing and according to the Company’s plan. In 2025, total production decreased by 15% compared to the previous year at current prices, in line with the negative impact of the metals price conversion. At constant 2024 metal prices, Aranzazu produced 100,031 GEO, 3% above the previous year, mainly due to higher grades and commercial molybdenum production. At 2025 Guidance Prices, Aranzazu ended 2025 with a production of 92,569 GEO, in line with the Guidance range.
Aranzazu’s Net Revenue in Q4 2025 was
Cash Cost was
Aranzazu’s AISC was
Aranzazu’s Adjusted EBITDA was
3.2 Apoena
| (US$ thousand) | Q4 2025 | Q3 2025 | QoQ Change % | Q4 2024 | YoY Change% | 2025 | 2024 | Change % | |||
| Production (GEO) | 8,961 | 9,249 | -3 | % | 7,121 | 26 | % | 35,304 | 37,173 | -5 | % |
| Sales (GEO) | 8,961 | 9,249 | -3 | % | 9,944 | -10 | % | 35,836 | 39,019 | -8 | % |
| Cash Cost (US$/GEO) | 1,450 | 1,082 | 34 | % | 1,793 | -19 | % | 1,232 | 1,189 | 4 | % |
| AISC (US$/GEO) | 2,427 | 1,791 | 36 | % | 2,494 | -3 | % | 2,007 | 1,833 | 9 | % |
| Net Revenue | 36,102 | 31,223 | 16 | % | 26,024 | 39 | % | 120,389 | 90,273 | 33 | % |
| Cost of goods sold | (13,961) | (15,307) | -9 | % | (16,565) | -16 | % | (58,642) | (62,875) | -7 | % |
| Gross Profit | 22,141 | 15,916 | 39 | % | 9,459 | 134 | % | 61,747 | 27,398 | 125 | % |
| Expenses | (3,525) | (374) | 843 | % | (413) | 766 | % | (6,225) | (3,519) | 94 | % |
| General and administrative expenses | (1,293) | (292) | 343 | % | (1,674) | -23 | % | (3,822) | (4,481) | -15 | % |
| Exploration expenses | (145) | (82) | 77 | % | (69) | 110 | % | (413) | (368) | 12 | % |
| Change in ARO estimate | (239) | n.a. | n.a. | 1,330 | n.a. | (239) | 1,330 | n.a. | |||
| Other income (expenses) | (1,848) | (16) | n.a. | 6 | n.a. | (1,751) | 317 | n.a. | |||
| EBIT | 18,713 | 15,542 | 20 | % | 9,046 | 107 | % | 55,522 | 23,879 | 129 | % |
| Adjusted EBITDA | 21,705 | 20,735 | 5 | % | 6,429 | 255 | % | 72,137 | 39,122 | 84 | % |
| Financial Result | (661) | (5,402) | -88 | % | (3,126) | -75 | % | (14,083) | (14,696) | -6 | % |
| Financial expenses, net | (564) | (5,386) | -90 | % | (3,132) | -78 | % | (14,083) | (15,013) | -6 | % |
| EBT | 18,052 | 10,140 | 78 | % | 5,920 | 203 | % | 41,439 | 9,183 | 351 | % |
| Total taxes | (3,500) | (717) | 388 | % | (2,249) | 119 | % | (4,086 ) | (4,270) | -4 | % |
| Current income tax expense | (1,648) | (893) | 85 | % | (19) | n.a. | (4,066) | (1,984) | 105 | % | |
| Deferred income tax expense | (1,852) | 176 | n.a. | (2,230) | -17 | % | (20) | (2,286) | n.a. | ||
| Profit for the period | 14,552 | 9,423 | 54 | % | 3,671 | 254 | % | 37,353 | 4,913 | 660 | % |
At Apoena, production was 8,961 GEO, 3% lower than Q3 2025, driven by due to lower ore feed to the plant and lower recovery, but in line with the Company’s plan. Compared with Q4 2024, production increased 26%, primarily because of higher recovery rates, with 4% increase, and higher grades, from 0.70 g/ton to 0.79 g/ton. In 2025, production was of 35,304 GEO, a decrease of 5% when compared to 2024, attributable mainly to lower grades and lower ore mined as expected. Considering the full year of 2025, Apoena exceeded the Company’s expectations by delivering higher grades and improved productivity, achieving a recovery rate of 94%, which drove the mine to finish 2025 above the upper end of the Guidance range, which was 32,000 GEO.
Apoena’s Net Revenue totaled
The Cash Cost was
In Q4 2025 compared to Q4 2024, Adjusted EBITDA increased significantly, mainly driven by higher production levels, improved cost performance and stronger gold prices. On a quarter-over-quarter basis, despite slightly lower production and sales volumes and higher costs, the positive impact of higher gold prices more than offset these pressures, supporting an increase in Adjusted EBITDA in the quarter. In Q4 2025 versus Q4 2024, EBITDA rose by 255%, explained by the increase in production, gold prices and lower cash costs. On a full-year basis, EBITDA more than doubled in 2025 compared to 2024, primarily driven by higher gold prices, which more than offset the impact of lower production and sales volumes and higher cost levels during the period.
3.3 Minosa
| (US$ thousand) | Q4 2025 | Q3 2025 | QoQ Change % | Q4 2024 | YoY Change% | 2025 | 2024 | Change % | |||
| Production (GEO) | 17,818 | 18,138 | -2 | % | 19,294 | -8 | % | 71,649 | 78,372 | -9 | % |
| Sales (GEO) | 16,972 | 17,827 | -5 | % | 19,338 | -12 | % | 70,161 | 79,036 | -11 | % |
| Cash Cost (US$/GEO) | 1,087 | 1,192 | -9 | % | 1,234 | -12 | % | 1,152 | 1,126 | 2 | % |
| AISC (US$/GEO) | 1,267 | 1,378 | -8 | % | 1,295 | 2 | % | 1,298 | 1,205 | 8 | % |
| Net Revenue | 67,476 | 59,204 | 14 | % | 48,899 | 38 | % | 230,518 | 177,692 | 30 | % |
| Cost of goods sold | (19,831) | (22,486) | -12 | % | (25,850) | -23 | % | (85,849) | (94,872) | -10 | % |
| Gross Profit | 47,645 | 36,718 | 30 | % | 23,049 | 107 | % | 144,669 | 82,820 | 75 | % |
| Expenses | (8,998) | (2,031) | 343 | % | (1,450) | 243 | % | (14,102) | (5,490) | 91 | % |
| General and administrative expenses | (730) | (1,271) | -43 | % | (933) | -22 | % | (4,302) | (4,383) | -2 | % |
| Exploration expenses | (85) | (760) | -89 | % | (517) | -84 | % | (1,345) | (1,107) | 21 | % |
| Other income (expenses) | (8,183) | (281) | 2812 | % | (1,170) | 599 | % | (8,455) | (1,899) | 345 | % |
| EBIT | 38,375 | 34,687 | 11 | % | 21,599 | 88 | % | 130,567 | 77,330 | 73 | % |
| Adjusted EBITDA | 47,900 | 35,478 | 35 | % | 23,576 | 103 | % | 144,024 | 83,203 | 73 | % |
| Financial Result | (988) | (1,428) | -31 | % | (3,047) | -47 | % | (5,161) | (9,029) | -28 | % |
| Financial expenses, net | (1,260) | (1,147) | 10 | % | (1,877) | -33 | % | (5,161) | (7,130) | -28 | % |
| Profit before income taxes | 37,387 | 33,259 | 12 | % | 18,552 | 102 | % | 125,406 | 68,301 | 84 | % |
| Total taxes | (8,219) | (8,350) | -2 | % | (5,059) | 62 | % | (30,212) | (19,938) | 52 | % |
| Current income tax expense | (11,463) | (8,725) | 31 | % | (4,314) | 166 | % | (34,573) | (19,174) | 80 | % |
| Deferred income tax expense | 3,244 | 375 | 765 | % | (745) | n.a. | 4,361 | (764) | n.a. | ||
| Profit for the period | 29,168 | 24,909 | 17 | % | 13,493 | 116 | % | 95,194 | 48,363 | 97 | % |
In Q4 2025, Minosa production totaled 17,818 GEO, 2% lower than Q3 2025 and 8% Q4 2024, mainly due to the impact of the rainy season and expansion works to increase the stacking area. In 2025, production achieved 71,649 GEO, a decrease of 9% mainly due to lower ore feed to the plant, reflecting mine sequencing and weather-related constraints, but consistent with Aura’s expectations. This performance allowed Minosa to close 2025 at the upper end of the Guidance range.
Net Revenue totaled
The Cash Cost was
The All-in Sustaining Cost (AISC) for Q4 2025 was
In Q4 2025, Minosa’s Adjusted EBITDA reached
3.4 Almas
| (US$ thousand) | Q4 2025 | Q3 2025 | QoQ Change % | Q4 2024 | YoY Change% | 2025 | 2024 | Change % | |||
| Production (GEO) | 15,872 | 15,089 | 5 | % | 16,679 | -5 | % | 56,979 | 54,129 | 5 | % |
| Sales (GEO) | 15,872 | 15,089 | 5 | % | 16,679 | -5 | % | 56,979 | 54,129 | 5 | % |
| Cash Cost (US$/GEO) | 837 | 986 | -15 | % | 692 | 21 | % | 1,004 | 950 | 6 | % |
| AISC (US$/GEO) | 962 | 1,132 | -15 | % | 713 | 35 | % | 1,150 | 1,139 | 1 | % |
| Net Revenue | 65,774 | 51,329 | 28 | % | 43,930 | 50 | % | 195,981 | 129,411 | 51 | % |
| Cost of goods sold | (17,043) | (18,147) | -6 | % | (18,433) | -8 | % | (69,740) | (65,410) | 7 | % |
| Gross Profit | 48,731 | 33,182 | 47 | % | 25,497 | 91 | % | 126,241 | 64,001 | 97 | % |
| Expenses | (6,720) | (1,595) | 321 | % | (1,004) | 659 | % | (11,284) | (3,942) | 192 | % |
| General and administrative expenses | (1,099) | (1,107) | -1 | % | 130 | n.a. | (4,484) | (2,808) | 60 | % | |
| Exploration expenses | (783) | (488) | 60 | % | (1,134) | -31 | % | (1,931) | (1,134) | 70 | % |
| Other income (expenses) | (4,838) | (5) | n.a. | 119 | n.a. | (4,869) | 74 | n.a. | |||
| EBIT | 41,980 | 31,587 | 33 | % | 24,493 | 71 | % | 114,957 | 60,059 | 91 | % |
| Adjusted EBITDA | 50,673 | 34,525 | 47 | % | 30,520 | 66 | % | 132,334 | 74,513 | 78 | % |
| Financial Result | (7,912) | (2,426) | 226 | % | (6,396) | 21 | % | (18,552) | (12,273) | 50 | % |
| Financial expenses, net | (7,943) | (2,421) | 228 | % | (6,515) | 22 | % | (18,552) | (12,347) | 50 | % |
| Profit before income taxes | 34,068 | 29,161 | 17 | % | 18,097 | 88 | % | 96,405 | 47,786 | 102 | % |
| Total taxes | (15,815) | (8,478) | 87 | % | (19,280) | -18 | % | (30,276) | (23,403) | 29 | % |
| Current income tax expense | (14,601) | (9,614) | 52 | % | (14,873) | -2 | % | (37,314) | (13,010) | 187 | % |
| Deferred income tax expense | (1,214) | 1,136 | n.a. | (4,407) | -72 | % | 7,038 | (10,393) | n.a. | ||
| Profit for the period | 18,253 | 20,683 | -12 | % | (1,183) | n.a. | 66,129 | 24,383 | 171 | % | |
During Q4 2025, Almas produced 15,872 GEO, 5% higher than Q3 2025 (15,088 GEO), driven by higher ore processed volumes and improved mine performance, reflecting the results of the plant expansion. Production was 5% lower when compared to Q4 2024, due to lower grades (decrease from 1.2g/ton to 1.02g/ton) in line with the mine sequencing. Also, as a result of the expansion project, Almas closed 2025 with production of 56,979, 5% higher than the prior year, despite lower grades due to mine sequencing. With this performance, Almas ended the year near the upper end of its Guidance.
Net Revenue was
The Cash Cost was
Almas’ All-in Sustaining Cost was
Adjusted EBITDA totaled
3.5 Borborema
| (US$ thousand) | Q4 2025 | Q3 2025 | QoQ Change % | 2025 | |
| Production (GEO) | 15,777 | 10,219 | 54 | % | 28,500 |
| Sales (GEO) | 15,777 | 11,228 | 41 | % | 28,195 |
| Cash Cost (US$/GEO) | 931 | 1,127 | -17 | % | 1,009 |
| AISC (US$/GEO) | 1,111 | 1,237 | -10 | % | 1,175 |
| Net revenue | 65,530 | 38,982 | 68 | % | 108,202 |
| Cost of goods sold | (21,870) | (12,652) | 73 | % | (35,636) |
| Gross Profit | 43,660 | 26,330 | 66 | % | 72,566 |
| Expenses | (1,608) | (1,186) | 36 | % | (3,158) |
| General and administrative expenses | (1,700) | (869) | 96 | % | (2,863) |
| Exploration expenses | (53) | (317) | -83 | % | (440) |
| Other income (expenses) | 150 | (20) | n.a. | 145 | |
| EBIT | 42,052 | 25,144 | 67 | % | 69,408 |
| Adjusted EBITDA | 49,168 | 25,144 | 95 | % | 76,524 |
| Financial Result | (10,249) | (252) | 3967 | % | (18,350) |
| Finance expenses, net | (10,254) | (232) | 4320 | % | (18,350) |
| EBT | 31,803 | 24,892 | 28 | % | 51,058 |
| Total taxes | (15,192) | (522) | 2810 | % | (16,565) |
| Current income tax expense | (15,971) | (6,585) | 143 | % | (22,556) |
| Deferred income tax expense | 779 | 6,063 | -87 | % | 5,991 |
| Profit/(loss) for the period | 16,611 | 24,370 | -32 | % | 34,493 |
Note: Borborema’s Q2 2025 results did not presented significant sales due to the beginning of gold production on its ramp-up phase, while Q3 2025 counts with a full quarter of relevant sales. Due to this, the results of Q3 2025 and Q2 2025 are not comparable.
Borborema’s production totaled 15,704 GEO, 54% above the previous quarter, reflecting progress along the ramp-up curve, achieving higher milling throughput, prioritizing higher-grade material, and increasing overall recovery. During the year, Borborema delivered results below the guidance range, mainly due to lower recoveries achieved during the pre-commercial production phase. This led to the decision to feed the plant with lower-grade material until full stabilization of performance. Performance improved significantly over the course of the year, and at the end of Q4 2025, recovery reached 91.7%, a significant improvement compared to the start of the ramp-up (76.5%), along with a 35% increase in grade compared to 2Q25, closing the year with an average grade of 1.42 g/t, due to mine sequencing. In 2025, the production totaled 28,500 GEO, reflecting ramp-up curve advancement, reaching higher ore throughput with a total ore plant feed of 885.8 tonnes, prioritizing higher-grade material, ending the year with an average grade of 1.19g/tonne with average recovery rate of 86%.
Net Revenue was
The Cash Cost was
Adjusted EBITDA was
3.6 MSG
| (US$ thousand) | Q4 2025¹ | |
| Production (GEO) | 4,761 | |
| Sales (GEO) | 4,797 | |
| Cash Cost (US$/GEO) | 2,148 | |
| AISC (US$/GEO) | 3,132 | |
| Net revenue | 20,238 | |
| Cost of goods sold | (14,163 | ) |
| Gross Profit | 6,075 | |
| Expenses | (582 | ) |
| General and administrative expenses | (224 | ) |
| Exploration expenses | (134 | ) |
| ARO Change in estimate | (250 | ) |
| Other income (expenses) | 26 | |
| EBIT | 5,493 | |
| Adjusted EBITDA | 9,574 | |
| Financial Result | 669 | |
| Finance expenses, net | 669 | |
| Profit before income taxes | 6,162 | |
| Total taxes | (1,753 | ) |
| Current income tax expense | - | |
| Deferred income tax expense | (1,753 | ) |
| Profit/(loss) for the period | 4,409 | |
1. Only
Considering the conclusion of the acquisition of MSG on
The Cash Cost was
4. Cash Flow
| (US$ thousand) | Q4 2025 | Q3 2025 | QoQ Change % | Q4 2024 | YoY Change% | 2025 | 2024 | Change % | |||
| Adjusted EBITDA | 207,948 | 152,105 | 37 | % | 79,319 | 162 | % | 547,755 | 266,768 | 105 | % |
| (+) Exploration Expenses | 2,595 | 2,333 | 11 | % | 4,775 | -46 | % | 8,018 | 13,961 | -43 | % |
| (-) Sustaining Capex and Exploration Capex in mines in production | (21,686) | (14,335) | 51 | % | (8,200) | 164 | % | (61,926) | (35,877) | 73 | % |
| (+/-) ? Working Capital, Changes in Other Assets and Liabilities and Others | (43,331) | (26,033) | 66 | % | 3,600 | n.a. | (82,841) | (8,537) | 870 | % | |
| (-) Income Taxes Paid | (27,629) | (17,755) | 56 | % | (3,356) | 723 | % | (84,829) | (18,902) | 349 | % |
| (-) Lease Payments | (2,070) | (4,551) | -55 | % | (3,712) | -44 | % | (15,983) | (17,202) | -7 | % |
| (-) Realized Losses on Gold Hedges | (21,650) | (17,130) | 26 | % | (5,376) | 303 | % | (56,519) | (5,376) | 951 | % |
| Recurring Free Cash Flow | 94,176 | 74,633 | 26 | % | 67,050 | 40 | % | 253,675 | 194,835 | 30 | % |
In Q4 2025, Recurring Free Cash Flow reached
- 37% rise in Adjusted EBITDA to
US$207.9 million - These were partially offset by:
- 56% increase in income taxes paid (from
US$17.7 million toUS$27.6 million ); - Nonrecurring increase in Working Capital, Changes in Other Assets and Liabilities and Others outflow of
US$43.3 million ; and - increase in realized losses on gold hedges (to
US$21.6 million ), resulted from the gold price increase.
- 56% increase in income taxes paid (from
In 2025, Recurring Free Cash Flow reached
- 105% rise in Adjusted EBITDA to
US$547.8 million - These were partially offset by:
- 349% increase in income taxes paid (from
US$18.9 million toUS$82.8 million ); - Nonrecurring increase in Working Capital, Changes in Other Assets and Liabilities and Others outflow of
US$82.8 million ; and - increase in realized losses on gold hedges (to
US$56.5 million ), resulted from the gold price increase.
- 349% increase in income taxes paid (from
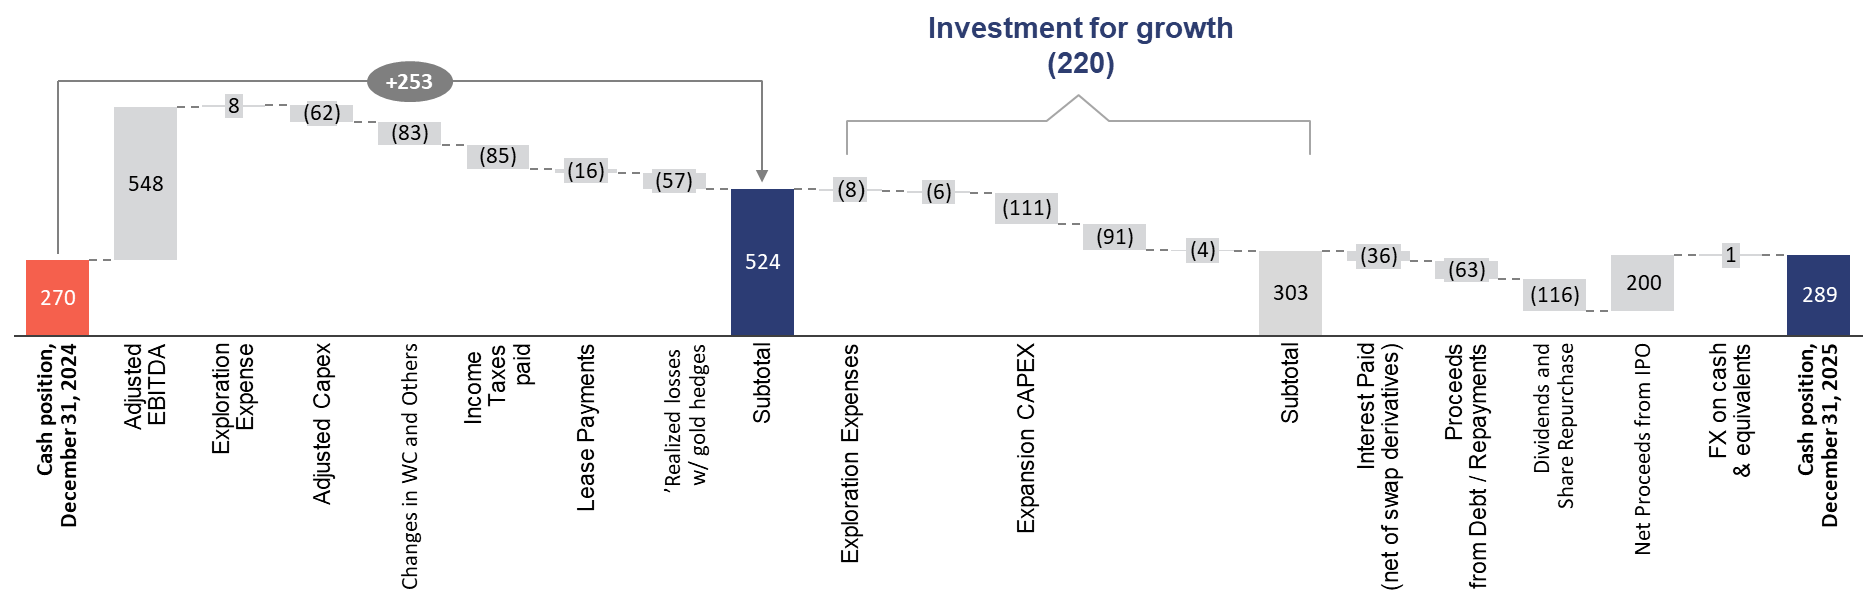
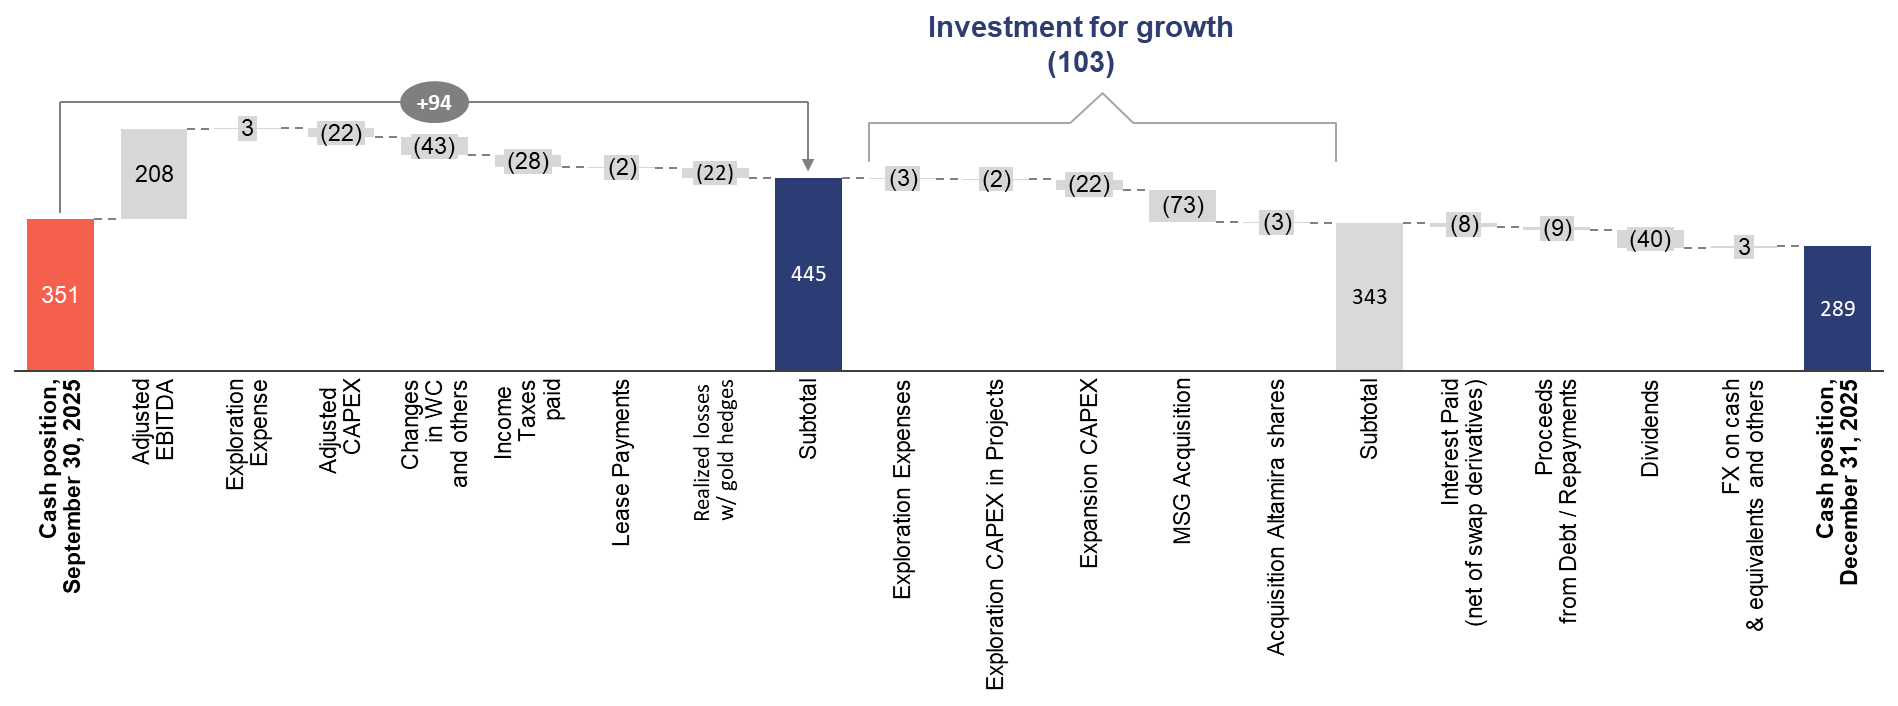
The chart below shows the change in cash position for the three and twelve months ending
Changes to the Cash Position Q4 2024 vs. Q4 2025 – Managerial View (US$ Million)
Changes to the Cash Position Q3 2025 vs. Q4 2025 – Managerial View (US$ Million)
Notes:
- Adjusted Capex includes Sustaining Capex and Exploration Capex for the mines in production.
- Cash position includes “Cash and Equivalents”, “Restricted Cash” and “ShortTerm Investments”
- MSG Acquisition includes US$ payables acquired which were part of the purchase price consideration. For this analysis, such consideration was included in “MSG Acquisition” and excluded from changes in working capital and is not consistent with the presentation of such accounts in the Company`s 2025 Financial Statements
5. Investment
The Company’s consolidated Capex for Q4 2025 totaled
- Expansion of Capex:
US$22.2 million , mainly on Apoena and Almas, whereUS$6.7 million was invested at Apoena,US$7.8 million at Almas,US$2.0 at Era Dorada and the remainingUS$3.6 million was at Borborema, Aranzazu and Minosa. Other expansion projects totaledUS$2.3 million . - Maintenance Capex:
US$19.4 million , of whichUS$6.6 million was allocated to Aranzazu,US$4.0 million to Apoena, andUS$0.8 million to Almas,US$2.4 million to Minosa,US$1.7 million to Borborema andUS$3.8 million at MSG. - Exploration Capex:
US$4.2 million , allocated to exploration activities. Apoena led investment withUS$1.4 million , followed by Aranzazu withUS$0.7 million and otherUS$0.3 million at Almas and Minosa. Other exploration projects totaledUS$1.9 million .
The Company’s consolidated Capex for 2025 totaled
- Expansion of Capex:
US$111.0 million , concentrated mainly on Borborema, Apoena and Almas, whereUS$53.8 million was invested at Borborema,US$18.9 million at Apoena and Almas, each.US$3.8 where invested at Era Dorada and the remainingUS$6.0 million was at Aranzazu and Minosa. Other expansion projects and Corporate totaledUS$9.7 million . - Maintenance Capex:
US$52.9 million , of whichUS$24.7 million was allocated to Aranzazu,US$11.2 million to Apoena, andUS$3.9 million to Almas,US$6.3 million to Minosa,US$3.0 million to Borborema andUS$ 3.9 million to MSG. - Exploration Capex:
US$15.5 million , allocated to exploration activities. Apoena led investment withUS$4.5 million , followed by Aranzazu withUS$3.6 million , and otherUS$0.9 million to Minosa and Almas. Other exploration projects totaledUS$6.5 million .
6. Gross and Net Debt
Total gross debt (short and long-term portion) was
The Company’s cash position remains comfortable, closing out the year at
The Company's Net Debt reached
Net Debt Breakdown
| (US$ thousand) | Q4 2025 | Q3 2025 | QoQ Change % | Q4 2024 | YoY Change % | ||
| Loans and debentures (current) | 99,548 | 89,810 | 11 | % | 82,007 | 21 | % |
| Loans and debentures (non-current) | 311,620 | 339,966 | -8 | % | 361,097 | -14 | % |
| Gross debt | 411,168 | 429,776 | -4 | % | 443,104 | -7 | % |
| Cash and cash equivalents | 286,056 | 351,414 | -19 | % | 270,189 | 6 | % |
| Restricted Cash | 3,075 | n.a. | n.a. | n.a. | n.a. | ||
| Derivative financial instrument ( | 4,418 | 14,590 | -70 | % | n.a. | n.a. | |
| Net Debt | 117,619 | 63,772 | 84 | % | 188,079 | -32 | % |
| Net Debt/LTM EBITDA | 0.28x | 0.15x | -0.70x | -0.70x | 0.0x | ||
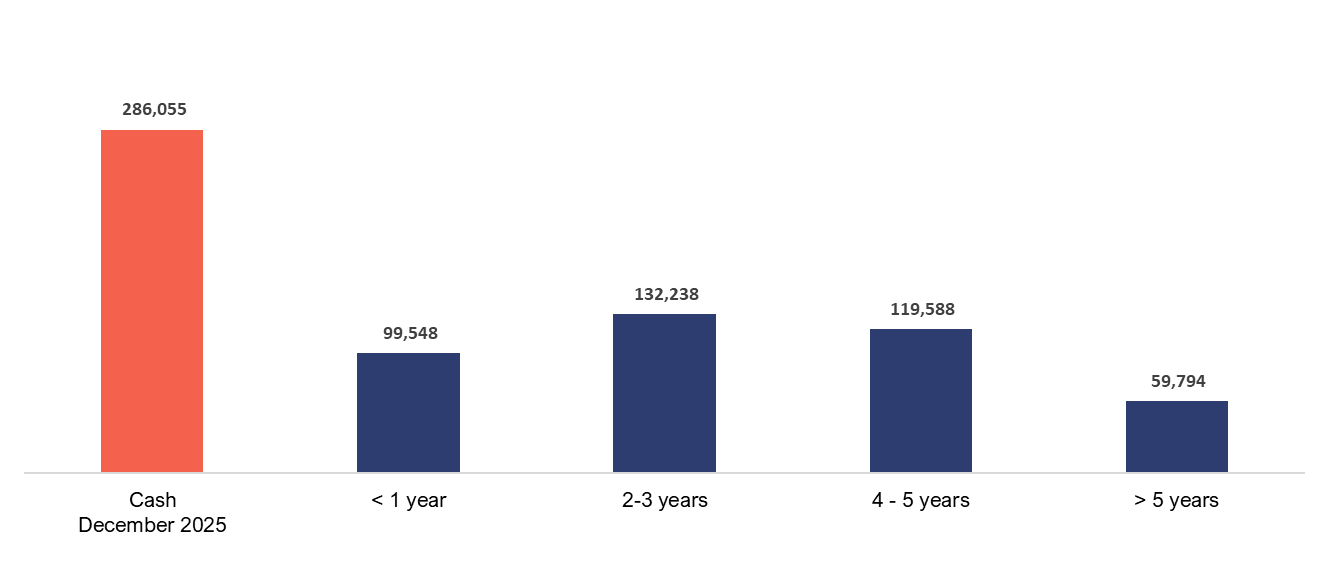
The table below shows the debt amortization timeline:
Debt Amortization Timeline (US$ thousand)
Derivative Options
i. Derivative Collars – Apoena and Almas
As of
ii. Derivative Collars - Borborema
As of
The fair value effect of both the Derivative Collars for the year ended
7. Guidance vs. Actual
The Company achieved the 2025 Guidance, including Production, Cash Cost, All-in Sustaining Cost (AISC) and CAPEX, as shown in the results below:
Gold equivalent ounces production ('000 GEO) – 2025 | ||||||
| Low | High | 2025 A | 2025 at Guidance metal prices | % | ||
| Aranzazu | 88 | 97 | 83 | 93 | 106% - 96% | |
| Apoena | 29 | 32 | 35 | 35 | 122% - 110% | |
| Minosa | 64 | 73 | 72 | 72 | 112% - 98% | |
| Almas | 51 | 58 | 57 | 57 | 111% - 98% | |
| Total ex-Borborema | 233 | 260 | 247 | 257 | 110% - 99% | |
| Borborema | 33 | 40 | 29 | 29 | 86% - 72% | |
| Total | 266 | 300 | 276 | 285 | 107% - 95% | |
Cash Cost per equivalent ounce of gold produced – 2025 | ||||||
| Low | High | 2025 A | 2025 at Guidance metal prices | % | ||
| Aranzazu | 1,029 | 1,132 | 1,156 | 1,006 | 98% - 89% | |
| Apoena | 1,258 | 1,384 | 1,232 | 1,232 | 98% - 89% | |
| Minosa | 1,108 | 1,219 | 1,152 | 1,152 | 104% - 94% | |
| Almas | 1,013 | 1,114 | 1,004 | 1,004 | 99% - 90% | |
| Borborema | 1,084 | 1,232 | 1,009 | 1,009 | 93% - 82% | |
| Total | 1,078 | 1,191 | 1,118 | 1,070 | 99% - 90% | |
AISC per equivalent ounce of gold produced – 2025 | ||||||
| Low | High | 2025 A | 2025 at Guidance metal prices | % | ||
| Aranzazu | 1,348 | 1,458 | 1,569 | 1,366 | 101% - 94% | |
| Apoena | 2,425 | 2,619 | 2,007 | 2,007 | 81% - 75% | |
| Minosa | 1,263 | 1,364 | 1,297 | 1,297 | 104% - 96% | |
| Almas | 1,113 | 1,202 | 1,150 | 1,150 | 103% - 96% | |
| Borborema | 1,113 | 1,304 | 1,175 | 1,175 | 106% - 90% | |
| Total | 1,374 | 1,492 | 1,429 | 1,368 | 100% - 92% | |
Capex (US$ million) – 2025 | |||||
| Low - 2025 | High - 2025 | 2025 A | % | ||
| Sustaining | 40 | 47 | 53 | 133% - 113% | |
| Exploration | 10 | 13 | 15 | 150% - 112% | |
| New Projects + Expansion | 99 | 106 | 111 | 112% - 104% | |
| Total | 149 | 167 | 179 | 107% - 120% | |
The Company’s consolidated Capex for 2025 totaled
- Expansion CAPEX: In 2025, the expansion CAPEX exceeded the
Guidance Range (+6%), largely driven by advances not included in the guidance, such as: (i) the early works of theAlmas Underground Development Project , and (ii) the development at Apoena exceeded plan atNosde Pit , supporting future better production performance. - Sustaining CAPEX: In 2025, the sustaining CAPEX was 2% above the
Guidance Range , mainly due to the MSG consolidation in December, which addedUS$ 3.5 million in sustaining capex which had not been included in the guidance. - Exploration CAPEX: In 2025, exploration CAPEX also exceeded guidance (+6%) following the strategy of an expanded drilling program, focused on Carajás, Serrinhas and Matupá, supporting reserve growth and long-term value creation.
2026 Guidance:
The Company’s gold equivalent production, AISC and cash operating cost per gold equivalent ounce sold, and CAPEX guidance for 2026 are detailed below.
Production
The table below details the Company’s updated GEO production Guidance for 2026 by business unit. For such Guidance, the Company considered the following metal prices:
- Gold Price =
$4,287.50 /oz; - Copper price =
$5.18 /lb; Silver Price =$58.72 /oz;- Molybdenum Price =
$22.16 /oz.
| Gold equivalent ounces production ('000 GEO) – 2026 | ||
| Low | High | |
| Aranzazu | 68 | 76 |
| Apoena | 37 | 44 |
| Minosa | 63 | 70 |
| Almas | 57 | 63 |
| Borborema | 65 | 77 |
| MSG | 50 | 60 |
| Total | 340 | 390 |
2026 Production Guidance:
- Aranzazu: Aranzazu's production in 2026 is expected to be around 22% below 2025, due to the grades decrease, due to mine sequencing, assuming constant metal prices. However, given the guidance average gold price of
$4,287.50 /oz, an increase of 24% over the realized gold prices of 2025, and copper price of$4.9 /lb, the total volume in GEO will be impacted by an unfavorable metal-to-GEO conversion factor. - Apoena: Apoena will focus on continuing developing a new phase of the Nosde phase III pit, as previously disclosed as part of its 2-year investment phase, to support production expansion. Compared to 2025, higher grades are expected. Production will improve, with higher production expected in the second semester.
- Minosa: Minosa is expected to maintain reliable performance throughout 2026, similar to 2025. The projected production for 2026 is lower than the previous year, mainly due to expected grade reduction during the period due to mine sequencing.
- Almas: Almas’ production is expected to reach the new installed capacity in 2026, following process optimizations and throughput enhancements implemented in 2025. These changes increased the plant’s ore processing capacity from 2.0 to 2.2 million tonnes per year. However, the full benefits will not be realized in 2026 due to lower ore grades from mine sequencing. In parallel, the Company has started developing the underground project, which—combined with additional expansion capacity this year—should drive further production increases starting in 2027.
- Borborema: With ramp-up finalized in Q4 2025, Borborema is expected to reach between 65k and 77k GEO in 2026. This guidance reflects the expected increase in Mineral Reserves driven by higher gold prices, which in turn reduces average grades compared to the original feasibility study. As a result, the Company has adjusted its mine sequencing and ore segmentation strategy to incorporate these lower-grade ores, prioritizing overall project economics and the long-term value generated by the mine
- MSG: This year's focus is on turnaround, efficiency gains, and revisions to the mine plan and methods. This will demand greater attention to equipment maintenance and underground development. Nonetheless, aligned with our operational enhancement plan emphasizing cost optimization, we guide MSG production to 50,000–60,000 GEO in 2026. Output will ramp up quarterly in the second half, reaching higher annualized rates by year-end, with gradual improvements continuing into early 2027.
All in all, the 2026 production Guidance expects a total of 340-390 kGEO, representing an average increase of up to 85k (midpoint) when compared to 2025 at current prices and up to 89k GEO at constant metal prices.
Cash Costs
The table below shows the Company’s cash operating costs per GEO sold guidance for 2026 by Business Unit:
| Cash Cost per equivalent ounce of gold produced – 2026 | ||
| Low | High | |
| Aranzazu | 1,323 | 1,429 |
| Apoena | 1,128 | 1,209 |
| Minosa | 1,208 | 1,305 |
| Almas | 1,059 | 1,135 |
| Borborema | 1,009 | 1,089 |
| Total ex-MSG | 1,151 | 1,238 |
| MSG | 2,189 | 2,364 |
| Total w/ MSG | 1,303 | 1,411 |
2026 Cash Cost Guidance:
- Aranzazu: At constant metal prices, cash costs are expected to increase due to lower grades due to mine sequencing, and mine deepening, partially offset by cost reduction initiatives (e.g., continuous miner)
- Apoena Cash costs are expected to decline slightly, driven by operational improvements in Mine and Plant and higher grades from the Nosde pit, with further improvements anticipated for 2027.
- Minosa: Cash costs are expected to rise compared to 2025, driven by lower ore grades planned due mine sequencing.
- Almas: An increase in cash cost is expected in 2026, primarily due to mine sequencing that forecasts lower ore grades and a higher strip ratio over the year as we push back the Paiol pit in 2026. Nonetheless, this increase will be partially mitigated by the capacity expansion completed in 2025.
- Borborema: Cash costs are expected to remain low and improve gradually over the year due to debottlenecking the filters' throughput, which will add overall capacity
- MSG: Cash costs are expected to improve as operational efficiency initiatives are implemented, with benefits anticipated towards the end of the year.
All In Sustaining costs
The table below shows the Company’s all-in sustaining costs per GEO sold guidance for 2026 by Business Unit:
| AISC per equivalent ounce of gold produced – 2026 | ||
| Low | High | |
| Aranzazu | 1,726 | 1,865 |
| Apoena | 1,905 | 2,041 |
| Minosa | 1,372 | 1,481 |
| Almas | 1,415 | 1,516 |
| Borborema | 1,177 | 1,271 |
| Total ex-MSG | 1,488 | 1,602 |
| MSG | 3,072 | 3,318 |
| Total w/ MSG | 1,720 | 1,865 |
2026 All-In Sustaining Cost Guidance:
- Aranzazu: At constant metal prices, the increase in AISC is driven by the higher cash costs (lower FX, lower grades and mine deepening), while sustaining capex is expected to remain in line with last year.
- Apoena: AISC is expected to remain broadly in line with 2025, reflecting higher sustaining capex related to mine development, which will support improved performance in 2027.
- Minosa: In addition to higher cash costs, sustaining capex is expected to increase due to the expansion of the leach pads.
- Almas: AISC is expected to increase due to: (i) higher sustaining capex driven by continued mine development, with a higher strip ratio (from 5.0 to 8.3) as the Company advances pit opening; (ii) tailings dam capacity expansion planned for 2026, which is expected to increase the plant capacity to 3 million tons year.
- Borborema: In its first full year of operation, Borborema’s AISC is expected to be the most competitive across Aura operations. This reflects targeted investments in environmental and water management infrastructure, tailings and drainage system upgrades, and the acquisition of new filtration equipment—all aimed at enhancing operational stability and enabling potential future plant debottlenecking.
- MSG: AISC are also expected to improve as operational efficiency initiatives are implemented following the handover, with benefits anticipated to be perceived in the second half of the year.
Capex:
The table below shows the breakdown of estimated capital expenditures by type of investment:
| CAPEX – 2026 | ||
| Low | High | |
| Expansion | 111 | 130 |
| Exploration | 19 | 25 |
| Sustaining | 105 | 123 |
| Total | 236 | 278 |
- Sustaining: Sustaining capex increases year-over-year primarily due to the full-year consolidation of MSG, which has a structurally higher sustaining capex profile (underground mine) and will demand extraordinary non-recurring investments in fleet maintenance. Additional impacts include higher mine development at Almas and a full year of production of Borborema.
- Exploration: Exploration capex is expected to increase due to an expanded exploration program aimed at growing reserves and extending mine life, as well as the incorporation of MSG into the portfolio.
- Expansion: Expansion capex increases primarily due to the
Underground Project and plant expansion at Almas, 2nd year of development of Nosde phase 3 at Apoena, early works at Era Dorada and the re-leaching project at Minosa.
Key Factors
The Company’s future profitability, operating cash flows, and financial position will be closely related to the prevailing prices of gold and copper. Key factors influencing the price of gold and copper include, but are not limited to, the supply of and demand for gold and copper, the relative strength of currencies (particularly
To decrease risks associated with commodity prices and currency volatility, the Company will continue to evaluate and implement available protection programs. For additional information on this, please refer to the 20-F.
Other key factors influencing profitability and operating cash flows are production levels (impacted by grades, ore quantities, process recoveries, labor, country stability, plant, and equipment availabilities), production and processing costs (impacted by production levels, prices, and usage of key consumables, labor, inflation, and exchange rates), among other factors.
8. Shareholder Information
As of
9. Attachments
9.1 Financial Statements
| (US$ thousand) | Q4 2025 | Q3 2025 | QoQ Change % | Q4 2024 | YoY Change% | 2025 | 2024 | Change % | |||
| Net revenue | 321,661 | 247,832 | 30 | % | 171,517 | 88 | % | 921,733 | 594,163 | 55 | % |
| Cost of goods sold | (118,764) | (98,223) | 21 | % | (90,418) | 35 | % | (386,861) | (342,893) | 13 | % |
| Gross profit | 202,897 | 149,609 | 36 | % | 81,099 | 147 | % | 534,872 | 251,270 | 113 | % |
| General and administrative expenses | (18,761) | (10,371) | 81 | % | (10,539) | 95 | % | (50,052) | (33,273) | 50 | % |
| Exploration expenses | (2,595) | (2,333) | 11 | % | (4,775) | -46 | % | (8,018) | (13,961) | -43 | % |
| ARO Change in estimate | (489) | n.a. | n.a. | 1,330 | 165 | % | (489) | 1,330 | n.a. | ||
| Other expenses | (15,932) | (822) | 1838 | % | (315) | 4958 | % | (17,447) | (1,267) | 1277 | % |
| Operating income | 165,120 | 136,905 | 21 | % | 67,115 | 154 | % | 458,866 | 204,099 | 125 | % |
| Financial expenses | (126,840) | (104,849) | 21 | % | (22,459) | 459 | % | (416,085) | (157,782) | 164 | % |
| Financial Revenues | 3,652 | 2,284 | 60 | % | 12,668 | 2353 | % | 9,091 | 6,103 | 49 | % |
| Profit before income taxes | 41,932 | 33,518 | 25 | % | 57,009 | -16 | % | 51,872 | 52,420 | -1 | % |
| Current income tax expense | (50,064) | (38,402) | 34 | % | (16,383) | 205 | % | (138,831) | (52,971) | 165 | % |
| Deferred income tax expense | (11,732) | 10,510 | n.a. | (23,982) | -54 | % | 7,618 | (29,720) | n.a. | ||
| Profit/(loss) for the period | (19,864) | 5,626 | n.a. | 16,644 | n.a. | (79,340) | (30,271) | 167 | % | ||
9.2 Balance Sheet
| (US$ million) | Q4 2025 | Q4 2024 |
| ASSETS | ||
| Current | 286,056 | 351,414 |
| Cash and cash equivalentes | 3,075 | - |
| Accounts receivables | 20,073 | 13,142 |
| Value added taxes and other recoverable taxes | 37,650 | 23,585 |
| Inventories | 115,810 | 76,671 |
| Derivative financial instrument | 4,418 | 14,590 |
| Other receivables and assets | 45,404 | 28,979 |
| Total current assets | 512,486 | 508,381 |
| Non-current assets | ||
| Value added taxes and other recoverable taxes | 40,589 | 49,843 |
| Inventory | 58,576 | 44,406 |
| Other receivables and assets | 16,573 | 6,982 |
| Property, plant and equipment | 945,354 | 783,346 |
| Deferred income tax assets | 35,418 | 35,903 |
| Total non-current assets | 1,096,510 | 920,480 |
| Total assets | 1,608,996 | 1,428,861 |
| LIABILITIES | ||
| Current | ||
| Trade and other payables | 189,614 | 125,648 |
| Derivative financial instruments | 139,354 | 30,623 |
| Loans and Debentures | 99,548 | 89,810 |
| Liability measured at fair value | 1,012 | 5,322 |
| Current income tax liabilities | 66,765 | 46,228 |
| Current portion of other liabilities | 18,933 | 15,988 |
| Provision for mine closure and restoration | 5,661 | 2,551 |
| Liabilities directly associated with assets classified as held for sale | 5,367 | 2,757 |
| Total current liabilities | 526,254 | 318,927 |
| Non-current liabilities | ||
| Loans and debentures | 311,620 | 339,966 |
| Liability measured at fair value | 25,822 | 17,311 |
| Derivative Financial Instruments | 265,343 | 293,699 |
| Deferred income tax liabilities | 37,006 | 31,888 |
| Provision for mine closure and restoration | 78,070 | 64,763 |
| Other provisions | 92,671 | 29,215 |
| Other liabilities | 6,473 | 10,794 |
| Total non-current liabilities | 817,005 | 787,636 |
| SHAREHOLDERS' EQUITY | ||
| Share capital | 834,430 | 833,382 |
| Contributed surplus | 57,757 | 56,937 |
| Accumulated other comprehensive income | (178) | (1,584) |
| Accumulated losses | (626,272) | (566,437) |
| Total equity | 265,737 | 322,298 |
| Total liabilities and equity | 1,608,996 | 1,428,861 |
9.3 Cash Flow Statement
| (US$ thousand) | Q4 2025 | Q3 2025 | Q4 2024 | 2025 | 2024 |
| Cash flows from operating activities | |||||
| Profit /(Loss) for the period | (19,864) | 5,626 | 15,574 | (79,340) | (30,271) |
| Items adjusting profit (loss) of the period | 199,383 | 133,542 | 68,401 | 570,757 | 304,934 |
| Changes in working capital | (21,667) | 2,174 | 11,560 | (31,240) | (12,342) |
| Income tax paid | (27,629) | (17,755) | (3,520) | (84,829) | (18,518) |
| Other current and non-current assets and liabilities | (38,243) | (30,491) | (26,013) | (70,164) | (21,567) |
| Net cash generated by operating activities | 91,979 | 93,096 | 66,002 | 305,184 | 222,236 |
| Cash flows from investing activities | |||||
| Purchase of property, plant and equipment | (45,779) | (31,605) | (66,816) | (179,434) | (180,577) |
| Short term investments | - | - | 5,268 | - | 5,417 |
| Acquisition of investment - | - | - | (1,244) | (18,538) | (1,244) |
| Acquisition of investment - Altamira Gold Corp | (3,431) | - | - | (3,870) | - |
| Acquisition of investment - Mineração | (52,135) | - | (52,135) | - | |
| Net cash used in investing activities | (103,186) | (31,605) | (62,792) | (253,977) | (176,404) |
| Cash flows from financing activities | |||||
| Net Proceeds from the Nasdaq IPO | - | 200,116 | - | 200,116 | - |
| Proceeds received from loans and debentures | - | - | 240,705 | - | 314,345 |
| Repayment of loans and debentures | (8,501) | (33,728) | (129,056) | (62,831) | (184,385) |
| Derivative settlement- debt swap agreements | 9,621 | (1,418) | (1,964) | 10,785 | 2,090 |
| Derivative fee | - | - | 0 | - | (13,522) |
| Interest paid on loans and debentures | (17,775) | (8,308) | (6,431) | (47,255) | (36,037) |
| Payment of liability (NSR agreement) | (1,094) | (942) | (833) | (3,630) | (2,532) |
| Principal and interest payments of lease liabilities | (2,070) | (4,551) | (3,712) | (15,983) | (17,202) |
| Repayment of other liabilities | - | (1,044) | 874 | (2,025) | (1,699) |
| Payment of dividends | (40,106) | (27,564) | (17,354) | (115,814) | (42,693) |
| Acquisition of treasury shares | 849 | - | (3,835) | (351) | (13,361) |
| Proceeds and (payments) from exercise of stock options | 199 | - | 29 | 199 | 194 |
| Net cash generated by (used in) financing activities | (58,878) | 122,561 | 78,422 | (36,789) | 5,198 |
| Increase (decrease) in cash and cash equivalents | (66,886) | 184,052 | 81,634 | 15,777 | 51,030 |
| Effect of foreign exchange gain (loss) on cash equivalents | 2,886 | (576) | (7,423) | 1,448 | (18,136) |
| Cash and cash equivalents, beginning of the period | 351,414 | 167,938 | 195,978 | 270,189 | 237,295 |
| Cash and equivalents, end of the year | 287,414 | 351,414 | 270,189 | 287,413 | 270,189 |
9.4 Non-GAAP Performance Measures
Set out below are reconciliations for certain non-GAAP financial measures (including non-GAAP ratios) utilized by the Company in this Earnings Release: Adjusted EBITDA; Adjusted net Income, cash operating costs per gold equivalent ounce sold; AISCs; Net Debt; and Adjusted EBITDA Margin, which are non-GAAP financial measures. These non-GAAP measures do not have any standardized meaning within IFRS and therefore may not be comparable to similar measures presented by other companies. The Company believes that these measures provide investors with additional information which is useful in evaluating the Company’s performance and should not be considered in isolation or as a substitute for measures of performance prepared in accordance with IFRS.
A. Reconciliation from income for the quarter to Adjusted EBITDA:
(US$ thousand)
| (US$ thousand) | Q4 2025 | Q4 2024 | 2025 | 2024 |
| Profit / (Loss) for the period | (19,864) | 16,644 | (79,340) | (30,271) |
| Current income tax expense | 50,064 | 16,383 | 138,831 | 52,971 |
| Deferred income tax expense | 11,732 | 23,982 | (7,618) | 29,720 |
| Finance expense | 123,188 | 9,791 | 406,994 | 151,679 |
| Other income (expense) | 15,932 | 315 | 17,447 | 1,267 |
| Depletion and amortization | 26,407 | 13,534 | 70,953 | 62,732 |
| ARO Change in estimate | 489 | (1,330) | 489 | (1,330) |
| Adjusted EBITDA | 207,948 | 79,319 | 547,756 | 266,768 |
B. Reconciliation from the consolidated financial statements to cash operating costs per gold equivalent ounce sold:
| (US$ thousand) | Q4 2025 | Q4 2024 | 2025 | 2024 |
| Cost of goods sold | (118,764) | (90,418) | (386,860) | (342,893) |
| Depletion and amortization | 26,853 | 14,270 | 70,723 | 61,847 |
| Subtotal | (91,911) | (76,148) | (316,137) | (281,046) |
| Gold Equivalent Ounces sold | 80,447 | 69,340 | 278,296 | 269,878 |
| Cash costs per gold equivalent ounce sold¹ | 1,143 | 1,098 | 1,136 | 1,041 |
C. Reconciliation from the consolidated financial statements to all in sustaining costs per gold equivalent ounce sold:
| (US$ thousand) | Q4 2025 | Q4 2024 | 2025 | 2024 |
| Cost of goods sold | (118,764) | (90,418) | (386,860) | (342,893) |
| Depletion and amortization | 26,853 | 14,270 | 70,723 | 61,847 |
| Subtotal | (91,911) | (76,148) | (316,137) | (281,046) |
| Adjusted capex | 21,686 | 9,212 | 61,926 | 43,937 |
| General and Administrative Expenses for the mines in production | 5,591 | 6,124 | 17,085 | 14,024 |
| Lease Payments | 3,188 | 3,712 | 10,679 | 17,202 |
| Subtotal | (61,446) | (57,099) | (226,447) | (205,883) |
| Gold Equivalent Ounces sold (in thousands) | 80,447 | 69,340 | 278,296 | 269,878 |
| All In Sustaining costs per ounce sold equivalent ounce sold1 | 1,521 | 1,373 | 1,458 | 1,320 |
D. Reconciliation from the consolidated financial statements to realized average gold price per ounce sold, net2:
| (US$ thousand) | Q4 2025 | Q4 2024 | 2025 | 2024 |
| Gold Revenue, net of Sales Taxes | 255,120 | 118,853 | 675,328 | 397,376 |
| Ounces of gold sold | 62,378 | 45,961 | 195,968 | 172,220 |
| Realized average gold price per ounce sold, net | 4,090 | 2,586 | 3,446 | 2,307 |
E. Net Debt:
| (US$ thousand) | 2025 | 2024 | ||
| Loans and debentures (current) | 99,548 | 82,007 | ||
| Loans and debentures (non-current) | 311,620 | 361,097 | ||
| Derivative Financial Instrument (Swap – | (4,418) | - | ||
| Restricted Cash | (3,075) | - | ||
| Cash and Cash Equivalents | (286,056) | (270,189) | ||
| Net Debt | 117,619 | 172,915 | ||
(1) Derivative Financial Instrument: only includes the swap related to the Aura Almas Debenture.
F. Adjusted EBITDA Margin3 (Adjusted EBITDA/Revenues):
| (US$ thousand) | Q4 2025 | Q4 2024 | 2025 | 2024 |
| Net Revenue | 321,661 | 171,517 | 921,733 | 594,163 |
| Adjusted EBITDA | 207,948 | 79,319 | 547,756 | 266,768 |
| Adjusted EBITDA Margin (Adjusted EBITDA/Revenues) | 65% | 46% | 59% | 45% |
G. Adjusted Net Income
| (US$ thousand) | Q4 2025 | Q4 2024 | 2025 | 2024 |
| Profit/(Loss) for the period | (19,864) | 16,644 | (79,340) | (30,271) |
| Foreign exchange gain (loss) | (3,302) | (1,273) | (8,976) | (12,268) |
| Loss on derivative transactions | (81,723) | 9,252 | (281,489) | (80,241) |
| Loss on settlement of liability with equity instruments | - | - | (8,763) | - |
| Deferred taxes over non-monetary items | (8,115) | (15,971) | 14,208 | (19,309) |
| Adjusted Net Income | 73,276 | 24,636 | 205,680 | 81,547 |
Qualifield Person
The scientific and technical information contained in this press release has been reviewed and approved by
About Aura 360° Mining
Aura is focused on mining in complete terms – thinking holistically about how its business impacts and benefits every one of our stakeholders: our company, our shareholders, our employees, and the countries and communities we serve. We call this 360° Mining.
Aura is a company focused on the development and operation of gold and base metal projects in the
CAUTIONARY NOTES AND ADDITIONAL INFORMATION
This Press Release, and the documents incorporated by reference herein, contain certain “forward-looking information” within the meaning of applicable Canadian securities laws and “forward-looking statements” within the meaning of applicable
Forward-looking information is necessarily based upon a number of estimates and assumptions that, while considered reasonable by the Company, are inherently subject to significant business, economic and competitive uncertainties and contingencies. Forward-looking information in this Press Release is based upon, without limitation, the following estimates and assumptions: the ability of the Company to successfully achieve business objectives; the presence of and continuity of metals at the Company’s projects at modeled grades; gold and copper price volatility; the capacities of various machinery and equipment; the availability of personnel, machinery and equipment at estimated prices; exchange rates; metals and minerals sales prices; cash costs and AISCs; the Company’s ability to expand operations; the Company’s ability to obtain assay results; appropriate discount rates; tax rates and royalty rates applicable to the mining operations; cash operating costs and other financial metrics; anticipated mining losses and dilution; metals recovery rates; reasonable contingency requirements; the Company’s expected ability to develop adequate infrastructure and that the cost of doing so will be reasonable; the Company’s expected ability to develop its projects including financing such projects; and receipt of regulatory approvals on acceptable terms.
Known and unknown risks, uncertainties and other factors, many of which are beyond the Company’s ability to predict or control, could cause actual results to differ materially from those contained in the forward-looking information. Specific reference is made to the Company’s most recent AIF for a discussion of some of the factors underlying forward-looking information, which include, without limitation: gold and copper or certain other commodity price volatility; changes in debt and equity markets; the uncertainties involved in obtaining and interpreting geological data; increases in costs; environmental compliance and changes in environmental legislation and regulation; interest rate and exchange rate fluctuations; general economic conditions; political stability; and other risks involved in the mineral exploration and development industry. Readers are cautioned that the foregoing list of factors is not exhaustive of the factors that may affect the forward-looking information.
All forward-looking information herein is qualified by this cautionary statement. Accordingly, readers should not place undue reliance on forward-looking information. The Company undertakes no obligation to update publicly or otherwise revise any forward-looking information whether because of new information or future events or otherwise, except as may be required by law. If the Company does update any forward-looking information, no inference should be drawn that it will make additional updates with respect to such or other forward-looking information.
______________________________
1 Considered all mines in production.
2 Realized average gold price per ounce sold, net is a non-GAAP financial measure with no standardized meaning under IFRS, and therefore may not be comparable to similar measures presented by other issuers.
3 Adjusted EBITDA Margin is a non-GAAP financial measure with no standardized meaning under IFRS, and therefore may not be comparable to similar measures presented by other issuers.
Photos accompanying this announcement are available at:
https://www.globenewswire.com/NewsRoom/AttachmentNg/cccd8d49-c784-4e84-a7b6-d876d231286b
https://www.globenewswire.com/NewsRoom/AttachmentNg/0107b983-92ef-47e9-887e-ab7917658a0e
https://www.globenewswire.com/NewsRoom/AttachmentNg/fe5e66c9-e6b1-43b3-809b-ce09505610eb

For more information, please contact:Investor Relationsri@auraminerals.comwww.auraminerals.com

Changes to the Cash Position Q4 2024 vs. Q4 2025 – Managerial View (US$ Million)
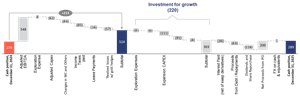
Changes to the Cash Position Q4 2024 vs. Q4 2025 – Managerial View (US$ Million)
Changes to the Cash Position Q3 2025 vs. Q4 2025 – Managerial View (US$ Million)

Changes to the Cash Position Q3 2025 vs. Q4 2025 – Managerial View (US$ Million)
Debt Amortization Timeline (US$ thousand)