Transformative Fiscal 2026 Focused on
Beneficient Clears Litigation Hurdles as it Positions to Capitalize on
Highlights of the year include:
- Resolved
GWG Holdings, Inc. litigation and regained Nasdaq compliance - Generated over
$50 million in gross proceeds from asset sales - Fully paid off HH-BDH Credit Agreement principal balance (excluding
$1.1 million for deferred interest and fees) - Executed over
$23 million in new fiduciary financings, including those closed subsequent to year end - Established initial collateral management services relationship
Commenting on the fiscal 2026 results, Chief Executive Officer
“Our focus now is on building the business by expanding our Primary Commitment Program, growing our collateral management services, and commercializing our AI-technology to support new opportunities. We believe the foundation we have built allows us to pursue a broader set of opportunities and create long-term value for our stakeholders.”
Fourth Quarter Fiscal 2026 and Recent Highlights (for the quarter ended
- Reported investments with a fair value of
$195.5 million , from$291.4 million at the end of our prior fiscal year, which served as collateral for Ben Liquidity's net loan portfolio of$169.7 million and$244.1 million , atMarch 31, 2026 and 2025, respectively. - Subsequent to
March 31, 2026 , entered into an additional primary capital transaction with a fund managed by a general partner, which will increase the collateral for the Company’s ExAlt loan portfolio by approximately$8.8 million . - Operating expenses increased 22% to
$17.5 million in the fourth quarter of fiscal 2026, as compared to$14.3 million of operating expenses in the fourth quarter of fiscal 2025. The current year quarter included non-cash intangible asset impairment of$3.1 million while there was not a similar charge in the prior year quarter. For fiscal year 2026, operating expenses were$127.4 million , which includes the accrual of a loss contingency of$62.8 million , additional interest expense on the loss contingency of$5.1 million , and non-cash intangible asset impairment of$3.1 million . For fiscal year 2025, operating expenses were$16.2 million , which includes the release of a loss contingency accrual of$55.0 million and non-cash goodwill impairment of$3.7 million . - Excluding the non-cash goodwill impairment and the loss contingency accrual in each period, as applicable, adjusted operating expenses(1) declined 11% in the fourth quarter of fiscal 2026 to
$12.7 million , as compared to$14.3 million in the same period of fiscal 2025. For fiscal year 2026, excluding the non-cash goodwill impairment and the loss contingency accrual (release) in each period, adjusted operating expenses(1) declined 16% to$56.4 million , as compared to$67.5 million for fiscal year 2025. - Further completed asset sales or equity redemptions of certain investments held by the Customer ExAlt Trusts, resulting in an aggregate of
$51.5 million in gross proceeds throughMarch 31, 2026 , which was used to pay down certain debt and provide working capital. - The Board of Directors named
James Silk as CEO of Beneficient onJune 24, 2026 , removing the Interim CEO title that he has held sinceJuly 21, 2025 . - Announced on
June 25, 2026 that one of its subsidiaries has entered into its first engagement to provide collateral management services for aTexas state-chartered bank in connection with a secured lending transaction. The engagement is expected to generate recurring fee revenue for the Company for the duration of the engagement and represents the first commercial deployment of Beneficient’s collateral management services offering.
In addition to this press release and in the place of an earnings report webcast, a letter to shareholders from CEO
Loan Portfolio
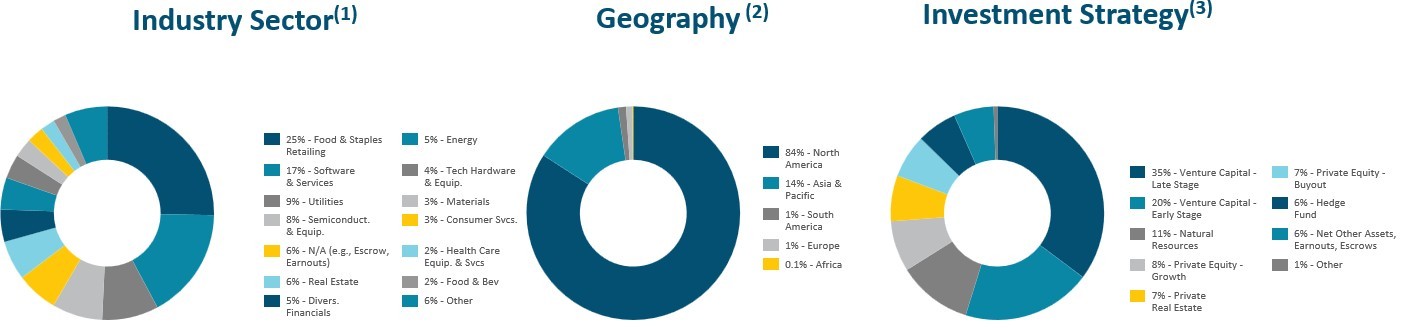
As a result of executing on our business plan of providing financing for liquidity, or early investment exits, for alternative asset marketplace participants, Ben’s balance sheet is primarily comprised of loans collateralized by a well-diversified alternative asset portfolio that is expected to grow as Ben successfully executes on its core business.
Ben’s balance sheet strategy for ExAlt Loan origination is built on an endowment-style portfolio model for the fiduciary financings we make by utilizing our patent-pending computer implemented technologies branded as OptimumAlt. Our OptimumAlt endowment model balance sheet approach guides diversification of our fiduciary financings across seven asset classes of alternative assets, over 11 industry sectors in which alternative asset managers invest, and at least six countrywide exposures and multiple vintages of dates of investment into the private funds and companies.
As of
- A leading Latin American pharmacy, health, and beauty retailer with an integrated physical and digital store network.
- A technology-enabled reforestation company using drones, seed science, and services to restore forests at scale following wildfires and other disturbances.
- A mobile banking services provider.
- A privately owned express intercity passenger rail system operator and owner of associated real estate.
- A developer of an integrated e-commerce and fulfillment platform to sell wine direct-to-consumers.
Figure 1: Portfolio Diversification
Diversification Using Principal Loan Balance, Net of Allowance for Credit Losses
As of
As of
Business Segments: Fourth Quarter Fiscal 2026
Ben Liquidity
Ben Liquidity offers simple, rapid and cost-effective liquidity products through the use of our proprietary financing and trust structure, or the “Customer ExAlt Trusts,” which facilitate the exchange of a customer’s alternative assets for consideration.
- Ben Liquidity recognized
$7.9 million of interest income for the fiscal fourth quarter, down 3.5% from the quarter endedDecember 31, 2025 , primarily due to a higher percentage of loans being placed on nonaccrual status and loan repayments primarily through asset sales proceeds, partially offset by the effects of compounding interest on the remaining loans. - Operating loss for the fiscal fourth quarter was
$19.7 million , a decline from an operating loss of$29.2 million for the quarter endedDecember 31, 2025 . The improvement was due to lower intersegment credit losses and interest expense due to the prepayment of the outstanding principal under the HH-BDH Credit Agreement in the current fiscal period as compared to the quarter endedDecember 31, 2025 offset by the decline in revenues discussed above.
Ben Custody
Ben Custody provides full-service trust and custody administration services to the trustees of certain of the Customer ExAlt Trusts, which own the exchanged alternative assets following liquidity transactions in exchange for fees payable quarterly calculated as a percentage of assets in custody.
- NAV of alternative assets and other securities held in custody by Ben Custody during the fiscal fourth quarter was
$219.8 million as ofMarch 31, 2026 , compared to$338.2 million as ofMarch 31, 2025 . The decrease was driven by dispositions of certain alternative assets, distributions and unrealized losses on existing assets, principally related to adjustments to the relative share held in custody of the respective fund’s NAV based on updated financial information received from the funds’ investment manager or sponsor during the period or the fair value for investments deemed probable to be sold at an amount that differs from NAV, offset by$14 .8 million of new originations. - Revenues applicable to Ben Custody were
$2.5 million for the fourth fiscal quarter, compared to$2.9 million for the quarter endedDecember 31, 2025 . The decline in revenues is a result of a lower amount of NAV of alternative assets and other securities held in custody at the beginning of each applicable period, when such fees are calculated. - Operating income for the fourth fiscal quarter was
$0.5 million , compared to an operating income of$2.0 million for the quarter endedDecember 31, 2025 . The decrease was primarily due to$1.0 million higher provision for credit loss in the current period and coupled with the decline in revenues as discussed above.
Business Segments: Year Ended Fiscal 2026
Ben Liquidity
- Ben Liquidity recognized
$33.4 million of interest income for the year endedMarch 31, 2026 , down 21.5% compared to the same period in 2025, primarily driven by lower loans, net of the allowance for credit losses, resulting from higher levels of non-accrual loans and loan prepayments, partially offset by new loans originated. - Operating loss was
$55.7 million for the year endedMarch 31, 2026 as compared to an operating loss of$12.8 million in the same period in 2025. The increase in the operating loss was partially a result of the lower revenues period over period plus an increase in intersegment credit losses in the current fiscal year as compared to the same period in the prior year.
Ben Custody
- Ben Custody revenues were
$12.7 million for the year endedMarch 31, 2026 , down 40.9% compared to the prior year period, largely the result of lower NAV of alternative assets and other securities held in custody along with certain upfront intersegment fees that are amortized into revenues over time being fully recognized in a prior period. - Operating income was
$8.0 million for the year endedMarch 31, 2026 compared to operating income of$13.3 million in the same period in 2025, with the decrease in operating income a result of the decline in revenues in the current year discussed above offset partially by lower expenses in the current fiscal year due primarily to the prior fiscal year reflecting non-cash goodwill impairment of$3 .4 million as compared to no such non-cash goodwill impairment in the current fiscal year. - Adjusted operating income(1) for the year ended
March 31, 2026 was$8 .0 million, compared to adjusted operating income(1) of$18 .5 million in the same period in 2025, with the decrease in adjusted operating income(1) primarily due to lower revenue related to lower NAV of alternative assets and other securities held in custody and higher operating expenses during the current fiscal year.
Capital and Liquidity
- As of
March 31, 2026 , the Company had cash and cash equivalents of$2.5 million and debt of$96.8 million . - Distributions received from alternative assets and other securities held in custody totaled
$12.1 million for the year endedMarch 31, 2026 compared to$30.4 million for the prior year period. Additionally, during year endedMarch 31, 2026 , we received proceeds of$51.5 million from the disposition of certain investments in alternative assets. - Total investments (at fair value) of
$195.5 million atMarch 31, 2026 supported Ben Liquidity's loan portfolio.
(1) Represents a non-GAAP financial measure. For reconciliations of our non-GAAP measures to the most directly comparable GAAP financial measures and for the reasons we believe the non-GAAP measures provide useful information, see Non-GAAP Reconciliations.
Consolidated Fiscal Fourth Quarter Results
Table 1 below presents a summary of selected unaudited consolidated operating financial information.
| Consolidated Fiscal Fourth Quarter Results ($ in thousands, except share and per share amounts) | Fiscal4 Q26 2026 | Fiscal 3Q26 December 31,2025 | Fiscal 4Q25 2025 | Change % vs. Prior Quarter | YTD Fiscal 2026 | YTD Fiscal 2025 | Change % vs. Prior YTD | ||||||||||||
| GAAP Revenues | $ | (42,409 | ) | $ | 18,670 | $ | (30,969 | ) | NM | $ | (39,125 | ) | $ | (7,943 | ) | NM | |||
| Adjusted Revenues(1) | (7,842 | ) | (25,393 | ) | (30,963 | ) | 69.1 | % | (48,616 | ) | (7,391 | ) | NM | ||||||
| GAAP Operating Income (Loss) | (59,944 | ) | 3,944 | (45,295 | ) | NM | (166,512 | ) | (24,185 | ) | NM | ||||||||
| Adjusted Operating Income (Loss)(1) | (19,492 | ) | (36,764 | ) | (42,945 | ) | 47.0 | % | (94,025 | ) | (61,583 | ) | (52.7)% | ||||||
| Basic Class A EPS(3) | $ | (14.02 | ) | $ | 68.08 | NM | |||||||||||||
| Diluted Class A EPS(3) | $ | (14.02 | ) | $ | 0.52 | NM | |||||||||||||
| Segment Revenues attributable to Ben's Equity Holders(2) | (23,942 | ) | 55,084 | 14,253 | NM | 55,620 | 63,735 | (12.7)% | |||||||||||
| Adjusted Segment Revenues attributable to Ben's Equity Holders(1)(2) | 10,625 | 11,021 | 14,253 | (3.6)% | 46,124 | 63,742 | (27.6)% | ||||||||||||
| Segment Operating Income (Loss) attributable to Ben's Equity Holders | (65,009 | ) | 8,656 | (16,662 | ) | NM | (140,873 | ) | 10,729 | NM | |||||||||
| Adjusted Segment Operating Income (Loss) attributable to Ben's Equity Holders(1)(2) | $ | (24,557 | ) | $ | (32,052 | ) | $ | (13,851 | ) | 23.4 | % | $ | (68,391 | ) | $ | (25,402 | ) | NM | |
NM - Not meaningful.
(1) Adjusted Revenues, Adjusted Operating Income (Loss), Adjusted Segment Revenues attributable to Ben's Equity Holders and Adjusted Segment Operating Income (Loss) attributable to Ben's Equity Holders are non-GAAP financial measures. For reconciliations of our non-GAAP measures to the most directly comparable GAAP financial measures and for the reasons we believe the non-GAAP measures provide useful information, see Non-GAAP Reconciliations.
(2) Segment financial information attributable to Ben’s equity holders is presented to provide users of our financial information an understanding and visual aide of the segment information (revenues, operating income (loss), and adjusted operating income (loss)) that impacts Ben’s Equity Holders. Ben’s Equity Holders refers to the holders of Beneficient Class A and Class B common stock and Series B Preferred Stock as well as holders of interests in BCH which represent noncontrolling interests. For a description of noncontrolling interests, see Item 7 of our Annual Report on Form 10-K for the year ended
(3) Periods presented have been adjusted to reflect the 1-for-8 reverse stock split on
Table 2 below presents a summary of selected unaudited consolidated balance sheet information.
| Consolidated Fiscal Fourth Quarter Results ($ in thousands) | Fiscal 4Q26 As of | Fiscal 4Q25 As of | Change % | ||||
| Investments, at Fair Value | $ | 195,536 | $ | 291,371 | (32.9)% | ||
| All Other Assets | 33,322 | 50,490 | (34.0)% | ||||
| 9,914 | 13,014 | (23.8)% | |||||
| Total Assets | $ | 238,772 | $ | 354,875 | (32.7)% | ||
Business Segment Information Attributable to Ben's Equity Holders(1)
Table 3 below presents unaudited segment revenues and segment operating income (loss) for business segments attributable to Ben's equity holders.
| Segment Revenues Attributable to Ben's Equity Holders(1) ($ in thousands) | Fiscal 4Q26 2026 | Fiscal 3Q26 December 31,2025 | Fiscal 4Q25 2025 | Change % vs. Prior Quarter | YTD Fiscal 2026 | YTD Fiscal 2025 | Change % vs. Prior YTD | ||||||||
| Ben Liquidity | $ | 7,900 | $ | 8,189 | $ | 8,459 | (3.5)% | $ | 33,421 | $ | 42,583 | (21.5)% | |||
| Ben Custody | 2,535 | 2,944 | 5,396 | (13.9)% | 12,743 | 21,574 | (40.9)% | ||||||||
| Corporate & Other | (34,377 | ) | 43,951 | 398 | NM | 9,456 | (422 | ) | NM | ||||||
| Total Segment Revenues Attributable to Ben's Equity Holders(1) | $ | (23,942 | ) | $ | 55,084 | $ | 14,253 | NM | $ | 55,620 | $ | 63,735 | (12.7)% | ||
| Segment Operating Income (Loss) Attributable to Ben's Equity Holders(1) ($ in thousands) | Fiscal 4Q26 2026 | Fiscal 3Q26 December 31, 2025 | Fiscal 4Q25 2025 | Change % vs. Prior Quarter | YTD Fiscal 2026 | YTD Fiscal 2025 | Change % vs. Prior YTD | ||||||||||||
| Ben Liquidity | $ | (19,694 | ) | $ | (29,167 | ) | $ | (12,340 | ) | 32.5 | % | $ | (55,699 | ) | $ | (12,802 | ) | NM | |
| Ben Custody | 545 | 1,989 | 4,165 | (72.6)% | 7,954 | 13,288 | (40.1)% | ||||||||||||
| Corporate & Other | (45,860 | ) | 35,834 | (8,487 | ) | NM | (93,128 | ) | 10,243 | NM | |||||||||
| Total Segment Operating Income (Loss) Attributable to Ben's Equity Holders(1) | $ | (65,009 | ) | $ | 8,656 | $ | (16,662 | ) | NM | $ | (140,873 | ) | $ | 10,729 | NM | ||||
NM - Not meaningful.
(1) Segment financial information attributable to Ben’s equity holders is presented to provide users of our financial information an understanding and visual aide of the segment information (revenues, operating income (loss), and adjusted operating income (loss)) that impacts Ben’s Equity Holders. Ben’s Equity Holders refers to the holders of Beneficient Class A and Class B common stock and Series B Preferred Stock as well as holders of interests in BCH which represent noncontrolling interests. For a description of noncontrolling interests, see Item 7 of our Annual Report on Form 10-K for the year ended
Adjusted Business Segment Information Attributable to Ben's Equity Holders(2)
Table 4 below presents unaudited adjusted segment revenue and adjusted segment operating income (loss) for business segments attributable to Ben's equity holders.
| Adjusted Segment Revenues Attributable to Ben's Equity Holders(1)(2) ($ in thousands) | Fiscal 4Q26 2026 | Fiscal 3Q26 December 31,2025 | Fiscal 4Q25 2025 | Change % vs. Prior Quarter | YTD Fiscal 2026 | YTD Fiscal 2025 | Change % vs. Prior YTD | |||||||||||
| Ben Liquidity | $ | 7,900 | $ | 8,189 | $ | 8,459 | (3.5 | )% | $ | 33,421 | $ | 42,583 | (21.5 | )% | ||||
| Ben Custody | 2,535 | 2,944 | 5,396 | (13.9 | )% | 12,743 | 21,574 | (40.9 | )% | |||||||||
| Corporate & Other | 190 | (112 | ) | 398 | NM | (40 | ) | (415 | ) | 90.4 | % | |||||||
| Total Adjusted Segment Revenues Attributable to Ben's Equity Holders(1)(2) | $ | 10,625 | $ | 11,021 | $ | 14,253 | (3.6 | )% | $ | 46,124 | $ | 63,742 | (27.6 | )% | ||||
| Adjusted Segment Operating Income (Loss) Attributable to Ben's Equity Holders(1)(2) ($ in thousands) | Fiscal 4Q26 2026 | Fiscal 3Q26 December 31, 2025 | Fiscal 4Q25 2025 | Change % vs. Prior Quarter | YTD Fiscal 2026 | YTD Fiscal 2025 | Change % vs. Prior YTD | |||||||||||||
| Ben Liquidity | $ | (19,694 | ) | $ | (29,167 | ) | $ | (12,340 | ) | 32.5 | % | $ | (55,699 | ) | $ | (12,797 | ) | NM | ||
| Ben Custody | 545 | 1,989 | 4,632 | (72.6 | )% | 7,954 | 18,522 | (57.1 | )% | |||||||||||
| Corporate & Other | (5,408 | ) | (4,874 | ) | (6,143 | ) | (11.0 | )% | (20,646 | ) | (31,127 | ) | 33.7 | % | ||||||
| Total Adjusted Segment Operating Income (Loss) Attributable to Ben's Equity Holders(1)(2) | $ | (24,557 | ) | $ | (32,052 | ) | $ | (13,851 | ) | 23.4 | % | $ | (68,391 | ) | $ | (25,402 | ) | NM | ||
NM - Not meaningful.
(1) Adjusted Revenues, Adjusted Operating Income (Loss), Adjusted Segment Revenues attributable to Ben's Equity Holders and Adjusted Segment Operating Income (Loss) attributable to Ben's Equity Holders are non-GAAP financial measures. For reconciliations of our non-GAAP measures to the most directly comparable GAAP financial measures and for the reasons we believe the non-GAAP measures provide useful information, see Non-GAAP Reconciliations.
(2) Segment financial information attributable to Ben’s equity holders is presented to provide users of our financial information an understanding and visual aide of the segment information (revenues, operating income (loss), and adjusted operating income (loss)) that impacts Ben’s Equity Holders. Ben’s Equity Holders refers to the holders of Beneficient Class A and Class B common stock and Series B Preferred Stock as well as holders of interests in BCH which represent noncontrolling interests. For a description of noncontrolling interests, see Item 7 of our Annual Report on Form 10-K for the year ended
Reconciliation of Business Segment Information Attributable to Ben's Equity Holders to Net Income (Loss) Attributable to Ben Common Shareholders
Table 5 below presents reconciliation of operating income (loss) by business segment attributable to Ben's Equity Holders to net income (loss) attributable to Ben common shareholders.
| Reconciliation of Business Segments to Net Income (Loss) Attributable to Ben Common Shareholders ($ in thousands) | Fiscal 4Q26 2026 | Fiscal 3Q26 December 31, 2025 | Fiscal 4Q25 2025 | YTD Fiscal 2026 | YTD Fiscal 2025 | |||||||||||
| Ben Liquidity | $ | (19,694 | ) | $ | (29,167 | ) | $ | (12,340 | ) | $ | (55,699 | ) | $ | (12,802 | ) | |
| Ben Custody | 545 | 1,989 | 4,165 | 7,954 | 13,288 | |||||||||||
| Corporate & Other | (45,860 | ) | 35,834 | (8,487 | ) | (93,128 | ) | 10,243 | ||||||||
| Gain on liability resolution | — | 1,996 | — | 1,996 | 23,462 | |||||||||||
| Income tax expense (allocable to Ben and BCH equity holders) | (171 | ) | — | 661 | (214 | ) | (80 | ) | ||||||||
| Net loss attributable to noncontrolling interests - Ben | 31,382 | 14,026 | 19,777 | 70,583 | 34,875 | |||||||||||
| Noncontrolling interest guaranteed payment | (4,836 | ) | (4,765 | ) | (4,556 | ) | (18,918 | ) | (17,824 | ) | ||||||
| Net income (loss) attributable to Ben's common shareholders | $ | (38,634 | ) | $ | 19,913 | $ | (780 | ) | $ | (87,426 | ) | $ | 51,162 | |||
About Beneficient
Beneficient (Nasdaq: BENF) – Ben, for short – is on a mission to democratize the global alternative asset investment market by providing traditionally underserved investors - mid-to-high net worth individuals, small-to-midsized institutions and General Partners seeking exit options, anchor commitments and value-added services for their funds - with solutions that could help them unlock the value in their alternative assets.
Its subsidiary, Beneficient Fiduciary Financial, L.L.C., received its charter under the State of Kansas’ Technology-Enabled Fiduciary Financial Institution (TEFFI) Act and is subject to regulatory oversight by the Office of the State Bank Commissioner.
For more information, visit www.trustben.com or follow us on LinkedIn.
Contacts
Investors:
Matt Kreps/214-597-8200 / mkreps@darrowir.com
Michael Wetherington / 214-284-1199 / mwetherington@darrowir.com
investors@beneficient.com
Not an Offer of Securities
The information in this communication is for informational purposes only and shall not constitute, or form a part of, an offer to sell or the solicitation of an offer to sell or the solicitation of an offer to buy any securities. The securities that are the subject of the Transactions have not been registered under the Securities Act of 1933, as amended (the “Securities Act”), and may not be offered or sold in the United States absent registration or an applicable exemption from registration requirements.
Disclaimer and Cautionary Note Regarding Forward-Looking Statements
This press release contains forward-looking statements within the meaning of Section 27A of the Securities Act and Section 21E of the Securities Exchange Act of 1934, as amended, with respect to, among other things, demand for our solutions in the alternative asset industry, opportunities for market growth, our ability to identify and negotiate transactions, diversification and size of our loan portfolio, growth of our collateral management services and our ability to scale operations and provide shareholder value. These forward-looking statements are generally identified by the use of words such as “anticipate,” “believe,” “could,” “estimate,” “expect,” “intend,” “may,” “plan,” “potential,” “predict,” “project,” “should,” “target,” “will,” “would,” and, in each case, their negative or other various or comparable terminology. These forward-looking statements reflect our views with respect to future events as of the date of this document and are based on our management’s current expectations, estimates, forecasts, projections, assumptions, beliefs and information. Although management believes that the expectations reflected in these forward-looking statements are reasonable, it can give no assurance that these expectations will prove to have been correct. All such forward-looking statements are subject to risks and uncertainties, many of which are outside of our control, and could cause future events or results to be materially different from those stated or implied in this document. It is not possible to predict or identify all such risks. These risks include, but are not limited to, our ability to consummate liquidity transactions on terms desirable for the Company, or at all, our ability to maintain compliance with the Nasdaq continued listing requirements, our ability to cure any future deficiencies in compliance with any of the Nasdaq Listing Rules, the outcome and timing of the remaining GWG litigation and related legacy matters, risks related to the substantial costs and diversion of management’s attention and resources due to these matters, the risk that the Company’s collateral management services do not perform as expected or do not generate revenue, and the risk factors that are described under the section titled “Risk Factors” in our Annual Report on Form 10-K, Quarterly Reports on Form 10-Q, Current Reports on Form 8-K, and other filings with the SEC. These factors should not be construed as exhaustive and should be read in conjunction with the other cautionary statements that are included in this document and in our SEC filings. We expressly disclaim any obligation to publicly update or review any forward-looking statements, whether as a result of new information, future developments or otherwise, except as required by applicable law.
Table 6: CONSOLIDATED STATEMENTS OF COMPREHENSIVE INCOME (LOSS)
| Year Ended | |||||||
| (Dollars in thousands, except per share amounts) | 2026 | 2025 | |||||
| Revenues | |||||||
| Investment income (loss), net | $ | (49,532 | ) | $ | (6,500 | ) | |
| Gain (loss) on financial instruments, net (related party of | 9,774 | (2,242 | ) | ||||
| Interest and dividend income | 40 | 44 | |||||
| Trust services and administration revenues (related party of | 593 | 753 | |||||
| Other income | — | 2 | |||||
| Total revenues | (39,125 | ) | (7,943 | ) | |||
| Operating expenses | |||||||
| Employee compensation and benefits | 11,845 | 16,851 | |||||
| Interest expense (related party of | 18,801 | 14,908 | |||||
| Professional services | 21,054 | 23,235 | |||||
| Provision for credit losses | 1,048 | 1,000 | |||||
| Loss on impairment of goodwill and intangible assets | 3,100 | 3,692 | |||||
| Accrual (release) of loss contingency related to arbitration award | 62,831 | (54,973 | ) | ||||
| Other expenses net (related party of | 8,708 | 11,529 | |||||
| Total operating expenses | 127,387 | 16,242 | |||||
| Operating income (loss) | (166,512 | ) | (24,185 | ) | |||
| (Gain) loss on liability resolution | (1,996 | ) | (23,462 | ) | |||
| Net income (loss) before income taxes | (164,516 | ) | (723 | ) | |||
| Income tax expense | 214 | 80 | |||||
| Net income (loss) | (164,730 | ) | (803 | ) | |||
| Plus: Net loss attributable to noncontrolling interests - Customer ExAlt Trusts | 25,639 | 34,914 | |||||
| Plus: Net loss attributable to noncontrolling interests - Ben | 70,583 | 34,875 | |||||
| Less: Noncontrolling interest guaranteed payment | (18,918 | ) | (17,824 | ) | |||
| Net income (loss) attributable to Beneficient common shareholders | $ | (87,426 | ) | $ | 51,162 | ||
| Other comprehensive income (loss): | |||||||
| Unrealized gain (loss) on investments in available-for-sale debt securities | 54 | (278 | ) | ||||
| Total comprehensive income (loss) | (164,676 | ) | (1,081 | ) | |||
| Less: Comprehensive gain (loss) attributable to noncontrolling interests | (77,250 | ) | (52,243 | ) | |||
| Total comprehensive income (loss) attributable to Beneficient | $ | (87,426 | ) | $ | 51,162 | ||
| Net income (loss) per common share(1) | |||||||
| Class A - basic | $ | (14.02 | ) | $ | 68.08 | ||
| Class B - basic | $ | (14.02 | ) | $ | 109.54 | ||
| Net income (loss) per common share(1) | |||||||
| Class A - diluted | $ | (14.02 | ) | $ | 0.52 | ||
| Class B - diluted | $ | (14.02 | ) | $ | 0.52 | ||
(1) Periods presented have been adjusted to reflect the 1-for-8 reverse stock split on
Table 7: CONSOLIDATED STATEMENTS OF FINANCIAL CONDITION
| As of | |||||||
| (Dollars and shares in thousands) | |||||||
| ASSETS | |||||||
| Cash and cash equivalents | $ | 2,543 | $ | 1,346 | |||
| Investments, at fair value: | |||||||
| Investments held by Customer ExAlt Trusts (related party of | 195,536 | 291,371 | |||||
| Derivative asset | 21,652 | — | |||||
| Other assets, net (related party of | 9,127 | 49,144 | |||||
| Intangible assets | — | 3,100 | |||||
| 9,914 | 9,914 | ||||||
| Total assets | $ | 238,772 | $ | 354,875 | |||
| LIABILITIES, TEMPORARY EQUITY, AND EQUITY (DEFICIT) | |||||||
| Accounts payable and accrued expenses (related party of | $ | 63,788 | $ | 100,345 | |||
| Other liabilities (related party of | 176,651 | 80,806 | |||||
| Warrants liability | 308 | 227 | |||||
| Debt due to related parties | 96,785 | 117,896 | |||||
| Total liabilities | 337,532 | 299,274 | |||||
| Redeemable noncontrolling interests | |||||||
| Preferred Series A Subclass 0 Redeemable Unit Accounts, nonunitized | 90,526 | 90,526 | |||||
| Total temporary equity | 90,526 | 90,526 | |||||
| Shareholder’s equity (deficit)(1): | |||||||
| Preferred stock, par value | |||||||
| Series A preferred stock, 0 and 0 shares issued and outstanding as of | — | — | |||||
| Series B preferred stock, 1,831 and 363 shares issued and outstanding as of | 2 | — | |||||
| Class A common stock, par value | 14 | 1 | |||||
| Class B convertible common stock, par value | — | — | |||||
| Additional paid-in capital | 1,884,835 | 1,844,496 | |||||
| Accumulated deficit | (2,095,478 | ) | (2,008,052 | ) | |||
| (3,444 | ) | (3,444 | ) | ||||
| Noncontrolling interests | 24,733 | 132,076 | |||||
| Accumulated other comprehensive income (loss) | 52 | (2 | ) | ||||
| Total equity (deficit) | (189,286 | ) | (34,925 | ) | |||
| Total liabilities, temporary equity, and equity (deficit) | $ | 238,772 | $ | 354,875 | |||
(1) Periods presented have been adjusted to reflect the 1-for-8 reverse stock split on
Table 8: Non-GAAP Reconciliations
| (in thousands) | Three Months Ended | ||||||||||||||||
| Ben Liquidity | Ben Custody | Customer ExAlt Trusts | Corporate/ Other | Consolidating Eliminations | Consolidated | ||||||||||||
| Total revenues | $ | 7,900 | $ | 2,535 | $ | (8,071 | ) | $ | (34,377 | ) | $ | (10,396 | ) | $ | (42,409 | ) | |
| Mark to market adjustment on interests in | — | — | — | — | — | — | |||||||||||
| Mark to market adjustment on derivative asset | — | — | — | 34,567 | — | 34,567 | |||||||||||
| Adjusted revenues | $ | 7,900 | $ | 2,535 | $ | (8,071 | ) | $ | 190 | $ | (10,396 | ) | $ | (7,842 | ) | ||
| Operating income (loss) | $ | (19,694 | ) | $ | 545 | $ | (48,940 | ) | $ | (45,860 | ) | $ | 54,005 | $ | (59,944 | ) | |
| Mark to market adjustment on interests in | — | — | — | — | — | — | |||||||||||
| Mark to market adjustment on derivative asset | — | — | — | 34,567 | — | 34,567 | |||||||||||
| Intersegment provision for credit losses on collateral comprised of interests in the | — | — | — | — | — | — | |||||||||||
| — | — | — | 3,100 | — | 3,100 | ||||||||||||
| Accrual (release) of loss contingency related to arbitration award, including post-judgment interest | — | — | — | 1,707 | — | 1,707 | |||||||||||
| Share-based compensation expense | — | — | — | 339 | — | 339 | |||||||||||
| Legal and professional fees(1) | — | — | — | 739 | — | 739 | |||||||||||
| Adjusted operating income (loss) | $ | (19,694 | ) | $ | 545 | $ | (48,940 | ) | $ | (5,408 | ) | $ | 54,005 | $ | (19,492 | ) | |
(1) Includes legal and professional fees related to lawsuits.
| (in thousands) | Three Months Ended | |||||||||||||||||
| Ben Liquidity | Ben Custody | Customer ExAlt Trusts | Corporate/ Other | Consolidating Eliminations | Consolidated | |||||||||||||
| Total revenues | $ | 8,189 | $ | 2,944 | $ | (25,469 | ) | $ | 43,951 | $ | (10,945 | ) | $ | 18,670 | ||||
| Mark to market adjustment on interests in the | — | — | — | — | — | — | ||||||||||||
| Mark to market adjustment on derivative asset | — | — | — | (44,063 | ) | — | (44,063 | ) | ||||||||||
| Adjusted revenues | $ | 8,189 | $ | 2,944 | $ | (25,469 | ) | $ | (112 | ) | $ | (10,945 | ) | $ | (25,393 | ) | ||
| Operating income (loss) | $ | (29,167 | ) | $ | 1,989 | $ | (66,958 | ) | $ | 35,834 | $ | 62,246 | $ | 3,944 | ||||
| Mark to market adjustment on interests in the | — | — | — | — | — | — | ||||||||||||
| Mark to market adjustment on derivative asset | — | — | — | (44,063 | ) | — | (44,063 | ) | ||||||||||
| Intersegment provision for credit losses on collateral comprised of interests in the | — | — | — | — | — | — | ||||||||||||
| — | — | — | — | — | — | |||||||||||||
| Accrual (release) of loss contingency related to arbitration award, including post-judgment interest | — | — | — | 1,700 | — | 1,700 | ||||||||||||
| Share-based compensation expense | — | — | — | 367 | — | 367 | ||||||||||||
| Legal and professional fees(1) | — | — | — | 1,288 | — | 1,288 | ||||||||||||
| Adjusted operating income (loss) | $ | (29,167 | ) | $ | 1,989 | $ | (66,958 | ) | $ | (4,874 | ) | $ | 62,246 | $ | (36,764 | ) | ||
(1) Includes legal and professional fees related to lawsuits.
| (in thousands) | Three Months Ended | ||||||||||||||||
| Ben Liquidity | Ben Custody | Customer ExAlt Trusts | Corporate/ Other | Consolidating Eliminations | Consolidated | ||||||||||||
| Total revenues | $ | 8,459 | $ | 5,396 | $ | (31,556 | ) | $ | 398 | $ | (13,666 | ) | $ | (30,969 | ) | ||
| Mark to market adjustment on interests in | — | — | 6 | — | — | 6 | |||||||||||
| Mark to market adjustment on derivative asset | — | — | — | — | — | — | |||||||||||
| Adjusted revenues | $ | 8,459 | $ | 5,396 | $ | (31,550 | ) | $ | 398 | $ | (13,666 | ) | $ | (30,963 | ) | ||
| Operating income (loss) | $ | (12,340 | ) | $ | 4,165 | $ | (71,705 | ) | $ | (8,487 | ) | $ | 43,072 | $ | (45,295 | ) | |
| Mark to market adjustment on interests in | — | — | 6 | — | — | 6 | |||||||||||
| Mark to market adjustment on derivative asset | — | — | — | — | — | — | |||||||||||
| Intersegment provision for credit losses on collateral comprised of interests in | — | 467 | — | — | (467 | ) | — | ||||||||||
| — | — | — | — | — | — | ||||||||||||
| Accrual (release) of loss contingency related to arbitration award, including post-judgment interest | — | — | — | — | — | — | |||||||||||
| Share-based compensation expense | — | — | — | 487 | — | 487 | |||||||||||
| Legal and professional fees(1) | — | — | — | 1,857 | — | 1,857 | |||||||||||
| Adjusted operating income (loss) | $ | (12,340 | ) | $ | 4,632 | $ | (71,699 | ) | $ | (6,143 | ) | $ | 42,605 | $ | (42,945 | ) | |
(1) Includes legal and professional fees related to lawsuits.
| (in thousands) | Year Ended | |||||||||||||||||
| Ben Liquidity | Ben Custody | Customer ExAlt Trusts | Corporate/ Other | Consolidating Eliminations | Consolidated | |||||||||||||
| Total revenues | $ | 33,421 | $ | 12,743 | $ | (49,174 | ) | $ | 9,456 | $ | (45,571 | ) | $ | (39,125 | ) | |||
| Mark to market adjustment on interests in the | — | — | 5 | — | — | 5 | ||||||||||||
| Mark to market adjustment on derivative asset | — | — | — | (9,496 | ) | — | (9,496 | ) | ||||||||||
| Adjusted revenues | $ | 33,421 | $ | 12,743 | $ | (49,169 | ) | $ | (40 | ) | $ | (45,571 | ) | $ | (48,616 | ) | ||
| Operating income (loss) | $ | (55,699 | ) | $ | 7,954 | $ | (214,506 | ) | $ | (93,128 | ) | $ | 188,867 | $ | (166,512 | ) | ||
| Mark to market adjustment on interests in the | — | — | 5 | — | — | 5 | ||||||||||||
| Mark to market adjustment on derivative asset | — | — | — | (9,496 | ) | — | (9,496 | ) | ||||||||||
| Intersegment provision for credit losses on collateral comprised of interests in the | — | — | — | — | — | — | ||||||||||||
| — | — | — | 3,100 | — | 3,100 | |||||||||||||
| Accrual (release) of loss contingency related to arbitration award, including post-judgment interest | — | — | — | 67,894 | — | 67,894 | ||||||||||||
| Share-based compensation expense | — | — | — | 1,629 | — | 1,629 | ||||||||||||
| Legal and professional fees(1) | — | — | — | 9,355 | — | 9,355 | ||||||||||||
| Adjusted operating income (loss) | $ | (55,699 | ) | $ | 7,954 | $ | (214,501 | ) | $ | (20,646 | ) | $ | 188,867 | $ | (94,025 | ) | ||
(1) Includes legal and professional fees related to lawsuits.
| (in thousands) | Year Ended | |||||||||||||||||
| Ben Liquidity | Ben Custody | Customer ExAlt Trusts | Corporate/ Other | Consolidating Eliminations | Consolidated | |||||||||||||
| Total revenues | $ | 42,583 | $ | 21,574 | $ | (8,274 | ) | $ | (422 | ) | $ | (63,404 | ) | $ | (7,943 | ) | ||
| Mark to market adjustment on interests in | — | — | 545 | 7 | — | 552 | ||||||||||||
| Mark to market adjustment on derivative asset | — | — | — | — | — | — | ||||||||||||
| Adjusted revenues | $ | 42,583 | $ | 21,574 | $ | (7,729 | ) | $ | (415 | ) | $ | (63,404 | ) | $ | (7,391 | ) | ||
| Operating income (loss) | $ | (12,802 | ) | $ | 13,288 | $ | (168,427 | ) | $ | 10,243 | $ | 133,513 | $ | (24,185 | ) | |||
| Mark to market adjustment on interests in | — | — | 545 | 7 | — | 552 | ||||||||||||
| Mark to market adjustment on derivative asset | — | — | — | — | — | — | ||||||||||||
| Intersegment provision for loan losses on collateral comprised of interests in the | 5 | 1,807 | — | — | (1,812 | ) | — | |||||||||||
| — | 3,427 | — | 265 | — | 3,692 | |||||||||||||
| Accrual (release) of loss contingency related to arbitration award, including post-judgment interest | — | — | — | (54,973 | ) | — | (54,973 | ) | ||||||||||
| Share-based compensation expense | — | — | — | 5,649 | — | 5,649 | ||||||||||||
| Legal and professional fees(1) | — | — | — | 7,682 | — | 7,682 | ||||||||||||
| Adjusted operating income (loss) | $ | (12,797 | ) | $ | 18,522 | $ | (167,882 | ) | $ | (31,127 | ) | $ | 131,701 | $ | (61,583 | ) | ||
(1) Includes legal and professional fees related to lawsuits.
| Three Months Ended | Year Ended | |||||||||||||
| Operating Expenses Non GAAP Reconciliation | 2026 | 2025 | 2026 | 2025 | ||||||||||
| Operating expenses | $ | 17,535 | $ | 14,326 | $ | 127,387 | $ | 16,242 | ||||||
| Plus: (Accrual) release of loss contingency related to arbitration award, including post-judgment interest | (1,707 | ) | — | (67,894 | ) | 54,973 | ||||||||
| Less: | (3,100 | ) | — | (3,100 | ) | (3,692 | ) | |||||||
| Operating expenses, excluding goodwill impairment and release of loss contingency related to arbitration award | $ | 12,728 | $ | 14,326 | $ | 56,393 | $ | 67,523 | ||||||
Adjusted Revenues, Adjusted Operating Income (Loss), Adjusted Segment Revenues attributable to Ben's Equity Holders, Adjusted Segment Operating Income (Loss) attributable to Ben's Equity Holders, and Adjusted Operating Expenses are non-GAAP financial measures. We present these non-GAAP financial measures because we believe it helps investors understand underlying trends in our business and facilitates an understanding of our operating performance from period to period because it facilitates a comparison of our recurring core business operating results. The non-GAAP financial measures are intended as a supplemental measure of our performance that is neither required by, nor presented in accordance with,
We define adjusted revenue as revenue adjusted to exclude the effect of mark-to-market adjustments on related party equity securities that were acquired both prior to and during the Collateral Swap, which on
Adjusted operating income (loss) represents GAAP operating income (loss), adjusted to exclude the effect of the adjustments to revenue as described above, credit losses on related party available-for-sale debt securities that were acquired in the Collateral Swap which on
Adjusted operating expenses represent GAAP operating expenses, adjusted to exclude loss contingency accruals (releases), including post judgment interest incurred in arbitration with a former director, and non-cash asset impairment.
These non-GAAP financial measures are not a measure of performance or liquidity calculated in accordance with
Because of these limitations, Adjusted Revenues, Adjusted Operating Income (Loss), Adjusted Segment Revenues attributable to Ben's Equity Holders, Adjusted Segment Operating Income (Loss) attributable to Ben's Equity Holders, and Adjusted Operating Expenses should not be considered in isolation or as a substitute for performance measures calculated in accordance with
A photo accompanying this announcement is available at https://www.globenewswire.com/NewsRoom/AttachmentNg/4170d6de-3275-4375-836d-62fc797f0075


Beneficient ExAlt Loan Portolio