12% year-over-year revenue growth in Financial Services; strong EPS growth, adjusted operating margin expansion, and free cash flow generation
- Revenue of
$5.7 billion increased 4.6% year-over-year or 4.8% in constant currency1 - Operating margin of 15.4% decreased 60 basis points year-over-year; Adjusted Operating Margin1 of 16.3% increased 30 basis points year-over-year
- GAAP EPS2 of
$1.39 increased 148% year-over-year; Adjusted EPS1 of$1.49 increased 7.2% year-over-year - Trailing 12-month bookings of
$28.7 billion increased 4% year-over-year - 2026 constant currency revenue growth guidance is revised to 4.0% to 4.4% year-over-year growth
- 2026 Adjusted Operating Margin guidance is now approximately 16.1%, year-over-year expansion of 30 basis points
- 2026 Adjusted Diluted EPS guidance revised to
$5.72 to$5.79 , year-over-year growth of 8% to 10%
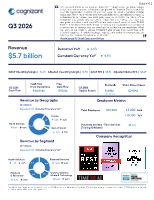
"We delivered third-quarter revenue above the midpoint of our guidance range, including another quarter of double-digit growth in Financial Services and our seventh consecutive quarter of year-over-year adjusted operating margin expansion," said Ravi Kumar S, Chief Executive Officer. "The AI market is moving from capability to value realization, requiring enterprises to reimagine how work gets done, build AI into the fabric of the enterprise and create new sources of value. We are making that transition alongside our clients, with over 50% of our code now AI-assisted, over 95,000 frontier AI badges and certifications earned by our associates and continued improvement in revenue and adjusted operating income per employee. What we learn as we apply AI across
| $ in millions, except per share data | Q3 2026 | | Q3 2025 |
| Revenue | | | |
| Y/Y Change | 4.6 % | | 7.4 % |
| Y/Y Change CC1 | 4.8 % | | 6.5 % |
| GAAP Operating Margin | 15.4 % | | 16.0 % |
| Adjusted Operating Margin1 | 16.3 % | | 16.0 % |
| GAAP Diluted EPS2 | | | |
| Adjusted Diluted EPS1 | | | |
| | YTD 2026 | | YTD 2025 |
| Operating cash flow | | | |
| Free cash flow1 | | | |
See "Revenue by Business Segment and Geography" section for additional revenue details and drivers of growth.
"Our third-quarter performance reflects the strength of our operating model and disciplined approach to capital allocation," said
Bookings
On a trailing-twelve-month basis, bookings increased 4% year-over-year to
Employee Metrics
On a trailing-twelve months basis, Voluntary Attrition - Tech Services was 12.6% for the period ended
Capital Allocation
The Company repurchased 4.9 million shares for
Project Leap
In the second quarter of 2026, we introduced Project Leap, a program designed to accelerate our transformation to the operating model of the future by funding investments in our integrated offerings, AI capabilities and partnerships, reshaping productivity through competitive offerings and upskilling our workforce. During the third quarter of 2026, we revised our estimates related to Project Leap. We now expect to record total costs of
Fourth Quarter and Full-Year 2026 Guidance3
(all growth rates year-over-year)
- Fourth quarter revenue is expected to be
$5.49 to$5.57 billion , growth of 3.0% to 4.5%, or 3.2% to 4.7% in constant currency.
- Full-year 2026 revenue is expected to be
$22.05 to$22.14 billion , growth of 4.5% to 4.9%, or 4.0% to 4.4% in constant currency.
- Full-year 2026 Adjusted Operating Margin4 is now expected to be approximately 16.1%, or 30 basis points of expansion.
- Full-year 2026 Adjusted Diluted EPS4 is expected to be in the range of
$5.72 to$5.79 , growth of 8% to 10%.
Client Announcements
- Announced a five-year extension of its work with Gilead Sciences, a biopharmaceutical company. Under the agreement,
Cognizant will support Gilead's continued development of DevOps capabilities and the responsible application of agentic AI tools across selected technology programs. The agreement follows more than a decade of work in whichCognizant has supported elements of Gilead's global IT infrastructure, platforms, applications and advanced analytics.
- Selected by the
European Bank for Reconstruction and Development (EBRD) to support its Tech Blueprint, the Bank's technology transformation program, which focuses on driving efficiency, effectiveness and innovation through digitally enabled processes powered by AI, data, and intelligent automation. Under the five-year framework,Cognizant aims to deliver critical technology services across two complementary service models: outcome-led managed services and fixed-capacity services, spanning digital and workplace management, cloud infrastructure, data and security, software engineering, automation and AI.
- Announced the next phase of its strategic partnership with Travelport, an intelligent infrastructure travel provider, marking a new phase focused on embedding AI across the platforms, products and operations that power the travel industry. Since announcing their AI transformation in
May 2026 alongsideAnthropic ,Cognizant and Travelport have completed the first phase of the initiative, establishing the foundational platforms, architecture and modern engineering practices required for AI-enabled delivery.
- Selected by SITA, a leading specialist in air transport technology, as the implementation and transformation partner for SITA's SKY program. The groupwide, finance-led initiative will help SITA implement a modern cloud platform across finance, procurement and supply chain processes.
- Announced production results from autonomous AI engineering work at Odyssey Logistics, a global logistics provider, along with an expanded set of collaborative offerings built on Cognition's AI software engineer, Devin. Odyssey is working to launch its OdysseyONE platform, intended to support order intake, execution, visibility and lifecycle management across its network. Odyssey set out to consolidate its order intake and full shipment lifecycle onto that platform. A seven-person
Cognizant team used Devin to handle the legacy conversion. Delivery throughput rose by roughly a third and Odyssey recorded a 37 percent net cost saving against the conventional approach.
- Announced the successful implementation and go-live of
Cognizant 's Application Management Services (AMS) at Axis Bank, one of the largest private sector banks inIndia , for the bank's AMS 2.0 initiative. AMS 2.0 is a structured program designed to strengthen delivery governance, improve operational consistency and accelerate the adoption of automation across application support services.
- Selected to partner with Benchling, a leading AI platform for biotech R&D, to accelerate R&D at research sites for Kyowa Kirin, a
Japan -based global specialty pharmaceutical company. Benchling gives scientists a single place to capture structured data, run AI models and agents and automate the workflows that move discovery and development forward. ThroughCognizant 's implementation support, researchers in theResearch Division of Kyowa Kirin will be able to efficiently and seamlessly conduct a range of research activities, from experiment planning and execution to data collection and use of AI, within a single environment.
- Chosen by
Ingenico , a global provider of in-person commerce solutions and services, to help simplify and modernizeIngenico's global technology operations. Under the five-year agreement,Cognizant has been tasked with embedding AI acrossIngenico's infrastructure and operations, security and data to support the modernization ofIngenico's technology operations, including infrastructure, security, business and corporate applications and data systems, while providing managed services across end-user services, service desk, application support and engineering.
Platform Enhancements and Partnerships
- Announced the general availability of Workflow Agentic Processing and Enterprise Model Context Protocol (MCP) Servers for the TriZetto Facets® and QNXT™ core administration platforms. The Workflow Agentic Processing capability lets AI agents carry out a health plan's standard operating procedures to automate processing of eligible routine pending claims, while denials, exceptions and complex cases are routed to human reviewers when additional judgment is needed.
- Expanded its partnership with
Google Cloud by establishing a newGemini Frontier Capability Group backed by 18,000 dedicatedCognizant associates. The new group pairsGoogle 's full-stack, enterprise-ready AI platform withCognizant 's domain, industry and engineering expertise as an AI Builder.
- Announced an expanded collaboration with CrowdStrike, a global cybersecurity company, to introduce
Cognizant Cybersecurity for Operational Technology, an Operational Technology (OT) security service powered by CrowdStrike Falcon® for XIoT. The service combinesCognizant 's industrial engineering expertise and managed security operations with CrowdStrike's unified visibility and protection across XIoT and IT environments designed to help protect mission-critical assets.
Select Company Announcements and Recognition
- Entered into a definitive agreement to acquire DyFlex Solutions, a leading SAP transformation firm. Headquartered in
Australia ,DyFlex is a multi-award-winning SAP Platinum Partner delivering advisory, consulting, implementation and managed services across the SAP ecosystem inAustralia and New Zealand . The proposed transaction is expected to strengthenCognizant 's enterprise platform, AI and SAP capabilities in the region, and its domain expertise in mining and resources, energy and utilities, manufacturing, logistics, the public sector and the mid-market sector.
- Announced the launch of
Cognizant AI Nexus, a modular, multi-model operating layer designed to help enterprises more quickly turn AI investment into proven business value by metering AI spend, governing AI quality and documenting results across every team.Cognizant AI Nexus is designed to help enterprises build compounding value from their most effective processes. It distills proven practices into reusable assets that teams can share and AI specialists can apply, and each workflow run adds to the knowledge behind the next.
- Launched
Cognizant Activate, a new business unit designed to help emerging enterprises harness AI and accelerate transformation.Cognizant Activate is expected to deliver platform-aligned, pre-configured solution kits spanning data and AI, cybersecurity, enterprise applications, cloud modernization and managed services.
- Detailed its expanded commitment to America's workforce.
Cognizant plans to hire 1,500U.S . college graduates and scale a new Frontier Certified Engineer and Frontier Business Operator workforce to 15,000 people, backed by annual direct hiring from universities. The company's position is that AI should expand opportunity for American workers, not shrink it.
- Completed its Americas Codex hackathon, a hybrid event held with OpenAI in which more than 2,600 associates built solutions using OpenAI Codex. The event is a step forward in
Cognizant 's frontier-certified workforce skilling strategy and its broader investment in American AI-era jobs. The event followedCognizant 's 10,000-participant flagship Codex Hackathon inIndia in late July.
- Launched its Talent Accelerator program with 489 newly hired graduates from 58 business schools across 37 cities in
India . The program is a two-week immersive onboarding held simultaneously acrossCognizant 's facilities inChennai , Bengaluru,Hyderabad andPune , designed to help new hires learn about the company and its values. It also combines functional, sales and marketing training, alongside direct interaction withCognizant 's business and leadership teams.
- Recognized as a Leader by
Everest Group in:- BFS Agentic Business Operations PEAK Matrix® Assessment 2026
- Global Capability Center (GCC) Transformation Capabilities in
India – PEAK Matrix® Assessment 2026
- Life and Annuity (L&A) Insurance IT Services PEAK Matrix® Assessment 2026
- Financial Crime and Compliance (FCC) Operations Services PEAK Matrix® Assessment 2026
- Fraud Management Operations Services PEAK Matrix® Assessment 2026
- Pharmaceutical R&D IT Services PEAK Matrix® Assessment 2026
- Application Management Services PEAK Matrix® Assessment 2026
- Insurance Intermediaries Operations PEAK Matrix® Assessment 2026
- Insurance Claims Operations PEAK Matrix® Assessment 2026
- Retail Digital Services PEAK Matrix® Assessment 2026
- Digital Workplace Services (DWS) PEAK Matrix® Assessment 2026 – NA & EU
- Cybersecurity Services PEAK Matrix® Assessment 2026 - Global
- Global Capability Center (GCC) Setup Capabilities in
India - PEAK Matrix® Assessment 2026
- Microsoft Azure Services PEAK Matrix® Assessment 2026
- Product Lifecycle Management Services PEAK Matrix® Assessment 2026
- Quality Engineering (QE) Services for AI Applications and Systems PEAK Matrix® Assessment 2026
- A Leader in IDC MarketScape:
- Worldwide AI-Enabled Adobe Professional Services 2026 Vendor Assessment, doc #US54114626,
October 2026
- Worldwide Cloud Professional Services in the AI Era 2026 Vendor Assessment, doc # US54117426,
September 2026
- Worldwide Digital Workplace Services 2026 Vendor Assessment, doc # US54119026,
September 2026
- Worldwide Oracle Implementation Services 2026 Vendor Assessment, doc # US54124626, August 2026
- Worldwide ServiceNow Implementation Services 2026, doc # US54126726, August 2026
- Worldwide AI-Enabled Adobe Professional Services 2026 Vendor Assessment, doc #US54114626,
- Leadership in ISG Provider Lens™:
- Telecom, Media and Entertainment AI-Native Transformation Services 2026 - Global
- Future of Work Services 2026 – US
- Leadership in
Avasant's RadarView:- Application Management Services, 2026
- Capital Markets Business Process Transformation, 2026
- Digital Workplace Services, 2026
- Mexico Digital Services, 2026
Quality Engineering Services , 2026
- Retail Digital Services, 2026
- United Kingdom Digital Services, 2026
- Marketing and Sales Business Process Transformation, 2026
- Digital Masters – Process Transformation, 2026
- Digital Masters – Technology Transformation, 2026
- Freight & Logistics Digital Services, 2026
- Salesforce Services, 2026
- Travel, Transportation, and Hospitality Digital Services, 2026
- Utilities Digital Services, 2026
- Guidewire Services, 2026
- Data Management and Advanced Analytics Services, 2026
- Healthcare Payor Digital Services, 2026
- State and Local Government Digital Services, 2026
Conference Call
The conference call will also be available live on the Investor Relations section of the
About
Forward-Looking Statements
This press release includes statements that may constitute forward-looking statements made pursuant to the safe harbor provisions of the Private Securities Litigation Reform Act of 1995, the accuracy of which is necessarily subject to risks, uncertainties and assumptions as to future events that may not prove to be accurate. These statements include, but are not limited to, express or implied forward-looking statements relating to our strategy, strategic partnerships and collaborations, competitive position and opportunities in the marketplace, investment in and growth of our business, the pace and magnitude of change and client needs related to AI, the effectiveness of and plans related to our recruiting and talent efforts and related costs, labor market trends, the anticipated amount of capital to be returned to shareholders, our anticipated financial performance, matters related to Project Leap, expected benefits resulting from our recent acquisitions, and other statements regarding matters that are not historical facts. These statements are neither promises nor guarantees, but are subject to a variety of risks and uncertainties, many of which are beyond our control, which could cause actual results to differ materially from those contemplated in these forward-looking statements. Existing and prospective investors are cautioned not to place undue reliance on these forward-looking statements, which speak only as of the date hereof. Factors that could cause actual results to differ materially from those expressed or implied include general economic conditions; the competitive and rapidly changing nature of the markets we compete in; our ability to successfully use AI-based technologies and the impact those technologies may have on the demand and terms for our services; the competitive marketplace for talent and its impact on employee recruitment and retention; our ability to successfully implement Project Leap and the amount of costs, timing of incurring costs, and benefits of such project; legal, reputational and financial risks resulting from cyberattacks; changes in the regulatory environment, including with respect to immigration, trade and taxes; and the other factors discussed in our most recent Annual Report on Form 10-K, our Quarterly Reports on Form 10-Q, and other filings with the Securities and Exchange Commission.
About Non-GAAP Financial Measures and Performance Metrics
Non-GAAP Financial Measures
To supplement our financial results presented in accordance with GAAP, this press release includes references to the following measures defined by the Securities and Exchange Commission as non-GAAP financial measures: Adjusted Operating Margin, Adjusted Income from Operations, Adjusted Net Income, Adjusted Diluted EPS (or Adjusted EPS), free cash flow and constant currency revenue growth. These non-GAAP financial measures are not based on any comprehensive set of accounting rules or principles and should not be considered a substitute for, or superior to, financial measures calculated in accordance with GAAP, and may be different from non-GAAP financial measures used by other companies. In addition, these non-GAAP financial measures should be read in conjunction with our financial statements prepared in accordance with GAAP. The reconciliations of our non-GAAP financial measures to the corresponding GAAP measures should be carefully evaluated.
Our non-GAAP financial measures Adjusted Operating Margin and Adjusted Income from Operations exclude unusual items, such as Project Leap charges and the partial reversal of the India Defined Contribution Obligation in 2026 and the gain on sale of property and equipment in 2025. Our non-GAAP financial measures Adjusted Net Income and Adjusted Diluted EPS exclude unusual items, such as Project Leap charges, the partial reversal of the India Defined Contribution Obligation, the gain on sale of property and equipment and the gain on sale of property and equipment and the one-time income tax expense related to the enactment of the OBBBA, net non-operating foreign currency exchange gains or losses and the tax impact of all the applicable adjustments. The income tax impact of each item excluded from Adjusted Net Income and Adjusted Diluted EPS is calculated by applying the statutory rate and local tax regulations in the jurisdiction in which the item was incurred. Free cash flow is defined as cash flows from operating activities plus proceeds from sale of property and equipment, net of purchases of property and equipment. Constant currency revenue growth is defined as revenues for a given period restated at the comparative period's foreign currency exchange rates measured against the comparative period's reported revenues.
Management believes providing investors with an operating view consistent with how we manage the Company provides enhanced transparency into our operating results. For our internal management reporting and budgeting purposes, we use various GAAP and non-GAAP financial measures for financial and operational decision-making, to evaluate period-to-period comparisons, to determine portions of the compensation for our executive officers and for making comparisons of our operating results to those of our competitors. Accordingly, we believe that the presentation of our non-GAAP measures, which exclude certain costs, when read in conjunction with our reported GAAP results, can provide useful supplemental information to our management and investors regarding financial and business trends relating to our financial condition and results of operations.
A limitation of using non-GAAP financial measures versus financial measures calculated in accordance with GAAP is that non-GAAP financial measures do not reflect all of the amounts associated with our operating results as determined in accordance with GAAP and may exclude costs that are recurring such as our net non-operating foreign currency exchange gains or losses. In addition, other companies may calculate non-GAAP financial measures differently than us, thereby limiting the usefulness of these non-GAAP financial measures as a comparative tool. We compensate for these limitations by providing specific information regarding the GAAP amounts excluded from our non-GAAP financial measures to allow investors to evaluate such non-GAAP financial measures.
Performance Metrics
Bookings are defined as total contract value (or TCV) of new contracts, including new contract sales as well as renewals and expansions of existing contracts. Bookings can vary significantly quarter to quarter depending in part on the timing of the signing of a small number of large contracts. Our book-to-bill ratio is defined as bookings for the trailing twelve months divided by revenue for the same period. Measuring bookings involves the use of estimates and judgments and there are no independent standards or requirements governing the calculation of bookings. The extent and timing of conversion of bookings to revenues may be impacted by, among other factors, the types of services and solutions sold, contract duration, the pace of client spending, actual volumes of services delivered as compared to the volumes anticipated at the time of sale, and contract modifications, including terminations, over the lifetime of a contract. The majority of our contracts are terminable by the client on short notice often without penalty, and some without notice. We do not update our bookings for subsequent terminations, reductions or foreign currency exchange rate fluctuations. Information regarding our bookings is not comparable to, nor should it be substituted for, an analysis of our reported revenues. However, management believes that it is a key indicator of potential future revenues and provides a useful indicator of the volume of our business over time. Large deals and mega deals are defined as deals with a total contract value of
| Investor Relations Contact: | | | | Media Contact: |
| | | | | |
| SVP, Investor Relations | | | | SVP, Corporate Communications |
| +1 551-220-8246 | | | | +1 475-223-2298 |
| | | |
- tables to follow -
| CONSOLIDATED STATEMENTS OF OPERATIONS (Unaudited) | |||||||
| | |||||||
| (in millions, except per share data) | Three Months Ended | | Nine Months Ended | ||||
| | 2026 | | 2025 | | 2026 | | 2025 |
| Revenues | $ 5,664 | | $ 5,415 | | $ 16,558 | | $ 15,775 |
| Operating expenses: | | | | | | | |
| Cost of revenues (exclusive of depreciation and amortization expense | 3,751 | | 3,581 | | 11,041 | | 10,457 |
| Selling, general and administrative expenses | 841 | | 833 | | 2,360 | | 2,434 |
| Restructuring charges | 51 | | — | | 135 | | — |
| Depreciation and amortization expense | 149 | | 135 | | 433 | | 410 |
| (Gain) on sale of property and equipment | — | | — | | — | | (62) |
| Income from operations | 872 | | 866 | | 2,589 | | 2,536 |
| Other income (expense), net: | | | | | | | |
| Interest income | 16 | | 25 | | 56 | | 78 |
| Interest expense | (19) | | (8) | | (39) | | (29) |
| Foreign currency exchange gains (losses), net | 2 | | 4 | | 27 | | 13 |
| Other, net | (8) | | — | | (28) | | 3 |
| Total other income (expense), net | (9) | | 21 | | 16 | | 65 |
| Income before provision for income taxes | 863 | | 887 | | 2,605 | | 2,601 |
| Provision for income taxes | (237) | | (613) | | (676) | | (1,023) |
| Income (loss) from equity method investments | 1 | | — | | (4) | | 4 |
| Net income | $ 627 | | $ 274 | | $ 1,925 | | $ 1,582 |
| Basic earnings per share | $ 1.39 | | $ 0.56 | | $ 4.15 | | $ 3.22 |
| Diluted earnings per share | $ 1.39 | | $ 0.56 | | $ 4.14 | | $ 3.22 |
| Weighted average number of common shares outstanding - Basic | 450 | | 486 | | 464 | | 491 |
| Dilutive effect of shares issuable under stock-based compensation plans | — | | 1 | | 1 | | — |
| Weighted average number of common shares outstanding - Diluted | 450 | | 487 | | 465 | | 491 |
| CONSOLIDATED STATEMENTS OF FINANCIAL POSITION (Unaudited) | |||
| | |||
| (in millions, except par values) |
| |
|
| Assets | | | |
| Current assets: | | | |
| Cash and cash equivalents | $ 1,515 | | $ 1,901 |
| Short-term investments | 37 | | 13 |
| Trade accounts receivable, net | 4,850 | | 4,439 |
| Other current assets | 1,688 | | 1,465 |
| Total current assets | 8,090 | | 7,818 |
| Property and equipment, net | 980 | | 933 |
| Operating lease assets, net | 601 | | 573 |
| | 8,076 | | 7,106 |
| Intangible assets, net | 1,608 | | 1,417 |
| Deferred income tax assets, net | 735 | | 967 |
| Long-term investments | 107 | | 111 |
| Other noncurrent assets | 1,129 | | 1,767 |
| Total assets | $ 21,326 | | $ 20,692 |
| Liabilities and Stockholders' Equity | | | |
| Current liabilities: | | | |
| Accounts payable | $ 366 | | $ 308 |
| Deferred revenue | 415 | | 501 |
| Short-term debt | — | | 33 |
| Operating lease liabilities | 156 | | 153 |
| Accrued expenses and other current liabilities | 2,701 | | 2,664 |
| Total current liabilities | 3,638 | | 3,659 |
| Deferred revenue, noncurrent | 29 | | 37 |
| Operating lease liabilities, noncurrent | 424 | | 423 |
| Deferred income tax liabilities, net | 162 | | 168 |
| Long-term debt | 1,552 | | 543 |
| Other noncurrent liabilities | 795 | | 847 |
| Total liabilities | 6,600 | | 5,677 |
| Stockholders' equity: | | | |
| Preferred stock, | — | | — |
| Class A common stock, | 4 | | 5 |
| Additional paid-in capital | 11 | | 12 |
| Retained earnings | 14,915 | | 15,158 |
| Accumulated other comprehensive income (loss) | (204) | | (160) |
| Total stockholders' equity | 14,726 | | 15,015 |
| Total liabilities and stockholders' equity | $ 21,326 | | $ 20,692 |
| Reconciliations of Non-GAAP Financial Measures (Unaudited) | |||||||||
| | |||||||||
| (dollars in millions, except per share amounts) | Three Months Ended | | Nine Months Ended | | Guidance | ||||
| | 2026 | | 2025 | | 2026 | | 2025 | | Full Year 2026 (1) |
| GAAP income from operations | $ 872 | | $ 866 | | $ 2,589 | | $ 2,536 | | |
| Project Leap charges(a) | 51 | | — | | 135 | | — | | |
| India Defined Contribution Obligation(b) | — | | — | | (81) | | — | | |
| (Gain) on sale of property and equipment(c) | — | | — | | — | | (62) | | — |
| Adjusted Income From Operations | $ 923 | | $ 866 | | $ 2,643 | | $ 2,474 | | |
| | | | | | | | | | |
| GAAP operating margin | 15.4 % | | 16.0 % | | 15.6 % | | 16.1 % | | |
| Project Leap charges(a) | 0.9 | | — | | 0.8 | | — | | 0.6% - 0.7% |
| India Defined Contribution Obligation(b) | — | | — | | (0.4) | | — | | (0.4) % |
| (Gain) on sale of property and equipment(c) | — | | — | | — | | (0.4) | | — |
| Adjusted Operating Margin | 16.3 % | | 16.0 % | | 16.0 % | | 15.7 % | | ~16.1% |
| | | | | | | | | | |
| GAAP net income | $ 627 | | $ 274 | | $ 1,925 | | $ 1,582 | | |
| Effect of adjustments to income from operations, pre- | 51 | | — | | 54 | | (62) | | |
| Non-operating foreign currency exchange (gains) | (2) | | (4) | | (27) | | (13) | | |
| Tax effect of above adjustments(e) | (6) | | 15 | | 23 | | 34 | | |
| One-time income tax expense related to the enactment | — | | 390 | | — | | 390 | | |
| Adjusted Net Income | $ 670 | | $ 675 | | $ 1,975 | | $ 1,931 | | |
| | | | | | | | | | |
| GAAP diluted earnings per share | $ 1.39 | | $ 0.56 | | $ 4.14 | | $ 3.22 | | |
| Effect of adjustments to income from operations, pre- | 0.11 | | — | | 0.12 | | (0.13) | | (a)(b)(c) |
| Non-operating foreign currency exchange (gains) | — | | (0.01) | | (0.06) | | (0.03) | | (d) |
| Tax effect of above adjustments(e) | (0.01) | | 0.04 | | 0.05 | | 0.08 | | (d) |
| One-time income tax expense related to the enactment | — | | 0.80 | | — | | 0.79 | | — |
| Adjusted Diluted Earnings Per Share | $ 1.49 | | $ 1.39 | | $ 4.25 | | $ 3.93 | | |
| | |||||||||
| (1) A full reconciliation of Adjusted Operating Margin and Adjusted Diluted Earnings Per Share guidance to the corresponding GAAP measures on a forward-looking basis cannot be provided without unreasonable efforts, as we are unable to provide reconciling information with respect to unusual items, net non-operating foreign currency exchange gains or losses and the tax effects of these adjustments, and such adjustments may be significant. |
| | |
| Notes: | |
| (a) | Project Leap charges for the three months ended |
| (b) | On Labor law reforms implemented by the |
| (c) | During the three months ended |
| (d) | Non-operating foreign currency exchange gains and losses, inclusive of gains and losses related to foreign exchange forward contracts not designated as hedging instruments for accounting purposes, are reported in "Foreign currency exchange gains (losses), net" in our unaudited consolidated statements of operations. Non-operating foreign currency exchange gains and losses are subject to high variability and low visibility and therefore cannot be provided on a forward-looking basis without unreasonable efforts. |
| (e) | Presented below are the tax impacts of our non-GAAP adjustment to pre-tax income for the: |
| | |
| | (in millions) | Three Months Ended | | Nine Months Ended | ||||
| | | 2026 | | 2025 | | 2026 | | 2025 |
| | Non-GAAP income tax benefit (expense) related to: | | | | | | | |
| | Project Leap charges | 14 | | — | | 36 | | — |
| | India Defined Contribution Obligation | — | | — | | (21) | | — |
| | Gain on sale of property and equipment | — | | — | | — | | (9) |
| | Foreign currency exchange gains and losses | (8) | | (15) | | (38) | | (25) |
| | The effective tax rate related to non-operating foreign currency exchange gains and losses varies depending on the jurisdictions in which such income and expenses are generated and the statutory rates applicable in those jurisdictions. As such, the income tax effect of non-operating foreign currency exchange gains and losses shown in the above table may not appear proportionate to the net pre-tax foreign currency exchange gains and losses reported in our unaudited consolidated statements of operations. |
| (f) | In |
The above tables serve to reconcile the Non-GAAP financial measures to the most directly comparable GAAP measures. Refer to the "About Non-GAAP Financial Measures and Performance Metrics" section of our press release for further information on the use of these Non-GAAP measures.
| Revenue by Business Segment and Geography (Unaudited) | |||||||
| | |||||||
| (dollars in millions) | Three Months Ended | ||||||
| | | | | | Year over Year | ||
| | $ | | % of total | | % Change | | Constant |
| Revenues by Segment: | | | | | | | |
| Health Sciences | $ 1,587 | | 28.0 % | | (1.1) % | | (0.9) % |
| Financial Services | 1,767 | | 31.2 % | | 12.0 % | | 12.3 % |
| Products and Resources | 1,371 | | 24.2 % | | (0.9) % | | (0.8) % |
| | 939 | | 16.6 % | | 10.5 % | | 10.7 % |
| Total Revenues (b)(c) | $ 5,664 | | | | 4.6 % | | 4.8 % |
| Revenues by Geography: | | | | | | | |
| | $ 4,258 | | 75.2 % | | 5.7 % | | 5.8 % |
| | 532 | | 9.4 % | | 5.8 % | | 6.2 % |
| Continental | 525 | | 9.3 % | | (2.6) % | | (1.5) % |
| Europe - Total | 1,057 | | 18.7 % | | 1.4 % | | 2.2 % |
| Rest of World | 349 | | 6.1 % | | 1.2 % | | 1.4 % |
| Total Revenues (b)(c) | $ 5,664 | | | | 4.6 % | | 4.8 % |
| | | | | | | | |
| | Nine Months Ended | ||||||
| | | | | | Year over Year | ||
| | $ | | % of total | | % Change | | Constant |
| Revenues by Segment: | | | | | | | |
| Health Sciences | $ 4,738 | | 28.6 % | | 0.3 % | | (0.3) % |
| Financial Services | 5,144 | | 31.1 % | | 12.1 % | | 11.4 % |
| Products and Resources | 4,014 | | 24.2 % | | 1.2 % | | 0.3 % |
| | 2,662 | | 16.1 % | | 6.7 % | | 6.2 % |
| Total Revenues (b)(c) | $ 16,558 | | | | 5.0 % | | 4.3 % |
| Revenues by Geography: | | | | | | | |
| | $ 12,437 | | 75.1 % | | 5.5 % | | 5.4 % |
| | 1,533 | | 9.3 % | | 6.3 % | | 4.1 % |
| Continental | 1,590 | | 9.6 % | | 2.4 % | | (1.5) % |
| Europe - Total | 3,123 | | 18.9 % | | 4.3 % | | 1.2 % |
| Rest of World | 998 | | 6.0 % | | 1.1 % | | 0.4 % |
| Total Revenues (b)(c) | $ 16,558 | | | | 5.0 % | | 4.3 % |
| Notes: | |
| (a) | Constant currency revenue growth is not a measure of financial performance prepared in accordance with GAAP. See "About Non-GAAP Financial Measures and Performance Metrics" section of our press release for further information. |
| (b) | For the three months ended |
| (c) | For the quarter ended |
| CONDENSED CONSOLIDATED STATEMENTS OF CASH FLOWS (Unaudited) | |||||||
| | |||||||
| (in millions) | Three Months Ended | | Nine Months Ended | ||||
| | 2026 | | 2025 | | 2026 | | 2025 |
| Cash flows from operating activities: | | | | | | | |
| Net income | $ 627 | | $ 274 | | $ 1,925 | | $ 1,582 |
| Adjustments for non-cash income and expenses | 213 | | 600 | | 729 | | 897 |
| Changes in operating assets and liabilities, net of effects of businesses | 164 | | 353 | | (818) | | (454) |
| Net cash provided by operating activities | 1,004 | | 1,227 | | 1,836 | | 2,025 |
| Cash flows from investing activities: | | | | | | | |
| Purchases of property and equipment | (79) | | (67) | | (254) | | (211) |
| Proceeds from sale of property and equipment | — | | — | | — | | 70 |
| Net (purchases) maturities of investments | (50) | | 1 | | (50) | | (14) |
| Payments for business combinations, net of cash acquired | 21 | | — | | (1,313) | | — |
| Net cash (used in) investing activities | (108) | | (66) | | (1,617) | | (155) |
| Cash flows from financing activities: | | | | | | | |
| Issuance of common stock under stock-based compensation plans | 12 | | 13 | | 41 | | 46 |
| Repurchases of common stock | (270) | | (463) | | (1,877) | | (1,040) |
| Repayment of Term Loan borrowings and finance lease obligations | (11) | | (11) | | (34) | | (32) |
| Proceeds from borrowing under the revolving credit facility | — | | — | | 1,000 | | — |
| Repayment of notes outstanding under the revolving credit facility | — | | — | | — | | (300) |
| Dividends paid | (149) | | (151) | | (465) | | (459) |
| Net cash (used in) financing activities | (418) | | (612) | | (1,335) | | (1,785) |
| Effect of exchange rate changes on cash, cash equivalents and restricted cash | (1) | | (4) | | (3) | | 25 |
| Increase (decrease) in cash, cash equivalents and restricted cash | 477 | | 545 | | (1,119) | | 110 |
| Cash, cash equivalents and restricted cash, beginning of period | 1,038 | | 1,796 | | 2,634 | | 2,231 |
| Cash and cash equivalents, end of period | $ 1,515 | | $ 2,341 | | $ 1,515 | | $ 2,341 |
| SUPPLEMENTAL CASH FLOW INFORMATION | |||
| | |||
| (in millions) | Three Months Ended | ||
| Stock Repurchases under Board of Directors' authorized stock repurchase program: | 2026 | | 2025 |
| Number of shares repurchased | 4.9 | | 6.3 |
| | | | |
| Remaining authorized balance as of | $ 2,080 | | |
| Reconciliation of Free Cash Flow Non-GAAP Financial Measure | |||||||
| | |||||||
| (in millions) | Three Months Ended | | Nine Months Ended | ||||
| | 2026 | | 2025 | | 2026 | | 2025 |
| Net cash provided by operating activities | $ 1,004 | | $ 1,227 | | $ 1,836 | | $ 2,025 |
| Purchases of property and equipment | (79) | | (67) | | (254) | | (211) |
| Proceeds from sale of property and equipment | — | | — | | — | | 70 |
| Free cash flow | $ 925 | | $ 1,160 | | $ 1,582 | | $ 1,884 |
| 1 | Constant currency ("CC") revenue growth, Adjusted Operating Margin, Adjusted Diluted Earnings Per Share ("Adjusted Diluted EPS" or "Adjusted EPS") and free cash flow are not measures of financial performance prepared in accordance with |
| 2 | GAAP Diluted EPS includes a one-time non-cash income tax charge that negatively impacted Q3 2025 by |
| 3 | Guidance as of |
| 4 | A full reconciliation of Adjusted Operating Margin and Adjusted Diluted EPS guidance to the corresponding GAAP measures on a forward-looking basis cannot be provided without unreasonable efforts. See "About Non-GAAP Financial Measures and Performance Metrics" for more information and a partial reconciliation to the most directly comparable GAAP financial measures at the end of this release. |

 View original content to download multimedia:https://www.prnewswire.com/news-releases/cognizant-reports-third-quarter-2026-results-302922946.html
SOURCE