| HIGHLIGHTS: | ||
| • | Definitive Feasibility Study confirms Assafou's potential to become a cornerstore asset for | |
| > | 320kozpa production at AISC of | |
| > | 16-year mine life based on P&P reserves of 4.4Moz (77.4Mt at 1.76g/t); M&I resources of 5.0Moz (80.1Mt at 1.93g/t). | |
| > | Robust project economics with after-tax NPV(5%) of | |
| > | Upfront capital of | |
| • | Significant exploration potential with over 20 highly prospective targets defined: | |
| > | Assafou deposit (5.0Moz M&I resource) mineralisation is open along strike and at depth; Pala Trend 3 (0.2Moz maiden M&I resource) satellite located 1km away is mineralised from surface. | |
| > | Assafou is the first discovery in a highly prospective and underexplored belt. | |
| • | Early works launched including long-lead orders, detailed engineering and design, and key tenders. | |
| • | Final investment decision targeted before end-2026, with subsequent 24 – 30 month construction. | |
| • | Assafou underpins the Group’s sector-leading organic growth outlook to 1.5Moz, at first quartile AISC, by 2030. | |
Assafou has the potential to become another cornerstone asset for
The impressive project economics demonstrate our ability to rapidly generate value through the drill bit. Assafou was discovered for
Since its discovery, the Assafou M&I resource has grown 470%, to over 5 million ounces, and we are increasingly excited by more than 20 highly prospective satellite targets, in close proximity to the deposit.
Working closely with our supportive in-country stakeholders, we are advancing the project’s mining convention, and we are targeting a final investment decision before the end of the year. Simultaneously, we have launched early works, detailed engineering and design, key tenders and long-lead orders to expedite construction.
As we advance Assafou, we will remain disciplined and prioritise maximising free cash flow from every ounce of gold we produce, ensuring that we continue to deliver sector leading shareholder returns, while we organically grow production to 1.5 million ounces by 2030.”
| Table 1: Assafou Project Highlights | |||
| ASSAFOU DFS | STRATEGIC TARGETS | ||
| P&P Reserve, Moz1 | 4.4 | >3.0 | |
| Mine life, years | 16 | >10 | |
| Average annual production, kozpa | First 8 years | 320 | >200 |
| Life of mine | 257 | ||
| AISC, $/oz2 | First 8 years | 1,026 | 1st quartile |
| Life of mine | 1,062 | ||
| Post-tax NPV5%, $m2 | 2,059 | n.a. | |
| Post-tax IRR, %2 | 28 | >20 | |
| ¹Based on a | |||
The key operational and economic highlights of the Assafou DFS are summarised in Tables 2 and 3 below.
| Table 2: Assafou DFS Summary | |
| OPERATION TYPE | |
| Mine type | |
| Plant type | 5.0Mtpa Gravity / CIL Plant |
| RESERVES & RESOURCES1 | |
| P&P reserves | 77.4Mt at 1.76g/t Au for 4.4Moz |
| M&I resources (inclusive of reserves) | 80.1Mt at 1.93g/t Au for 5.0Moz |
| Inferred resources | 0.9Mt at 2.34g/t Au for 0.1Moz |
| LIFE OF MINE PRODUCTION | |
| Mine life, years | 16 |
| Strip ratio, W:O | 6.3 |
| Tonnes processed, Mt | 77.4 |
| Grade processed, Au g/t | 1.76 |
| Gold contained processed, Moz | 4.4 |
| Average recovery rate, % | 94 |
| Gold production, Moz | 4.1 |
| Average annual production, kozpa | 257 |
| Cash costs, $/oz2 | 952 |
| AISC, $/oz2 | 1,062 |
| AVERAGE FOR YEARS 1 TO 8 | |
| Production, kozpa | 320 |
| Cash costs, $/oz | 887 |
| AISC, $/oz2 | 1,026 |
| CAPITAL COST | |
| Upfront capital cost, $m | 1,061 |
| ENVIRONMENTAL DATA | |
| GHG Emissions Intensity3, t CO2e/oz | 0.59 |
| Energy Intensity, GJ/oz | 7.39 |
| ¹Based on a reserves gold price of | |
| Table 3: Assafou DFS Project Economics | ||||
| Gold Price | ||||
| PRE-TAX | ||||
| NPV5%, $m | 1,625 | 2,909 | 4,250 | 6,934 |
| IRR, %1 | 23 | 34 | 45 | 66 |
| Payback Period, yr1 | 4.14 | 3.01 | 2.43 | 1.81 |
| AFTER-TAX | ||||
| NPV5%, $m | 1,074 | 2,059 | 3,077 | 5,113 |
| IRR, %1 | 18 | 28 | 37 | 55 |
| Payback Period, yr1 | 4.97 | 3.52 | 2.73 | 1.95 |
| ¹Payback period and IRR are calculated from the start of commercial production | ||||
Overview
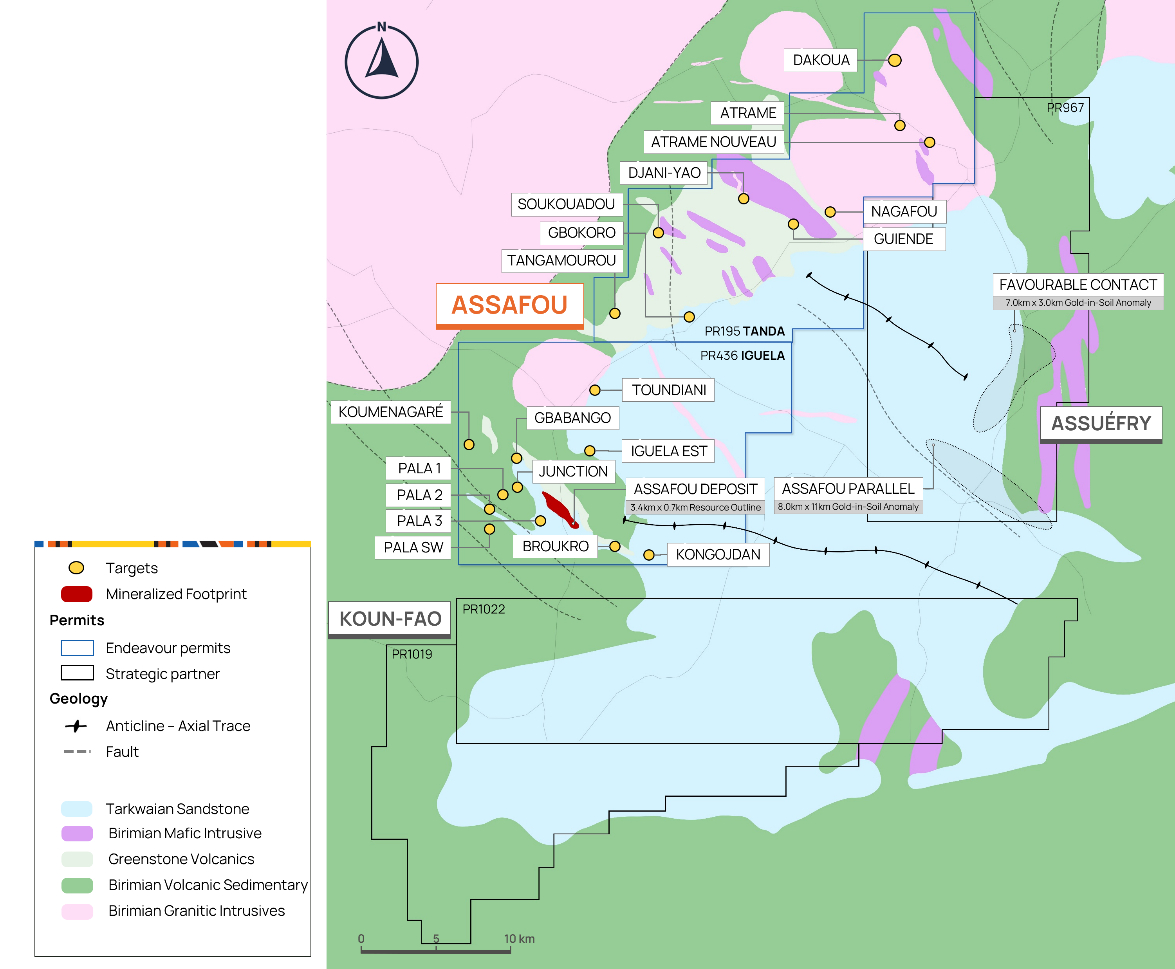
The 100% owned Tanda and Iguela exploration permits (“Tanda-Iguela”) are located in the eastern region of Côte d’Ivoire, approximately 280km northeast of
Figure 1: Tanda-Iguela Regional Map
A maiden Indicated resource of 1.1Moz (14.9Mt at 2.33 g/t Au) was published on
As shown in Figure 2 below, the DFS demonstrates Assafou’s potential to deliver 320kozpa at all-in sustaining cost (“AISC”) of
Figure 2: Assafou DFS Production and AISC Profile1
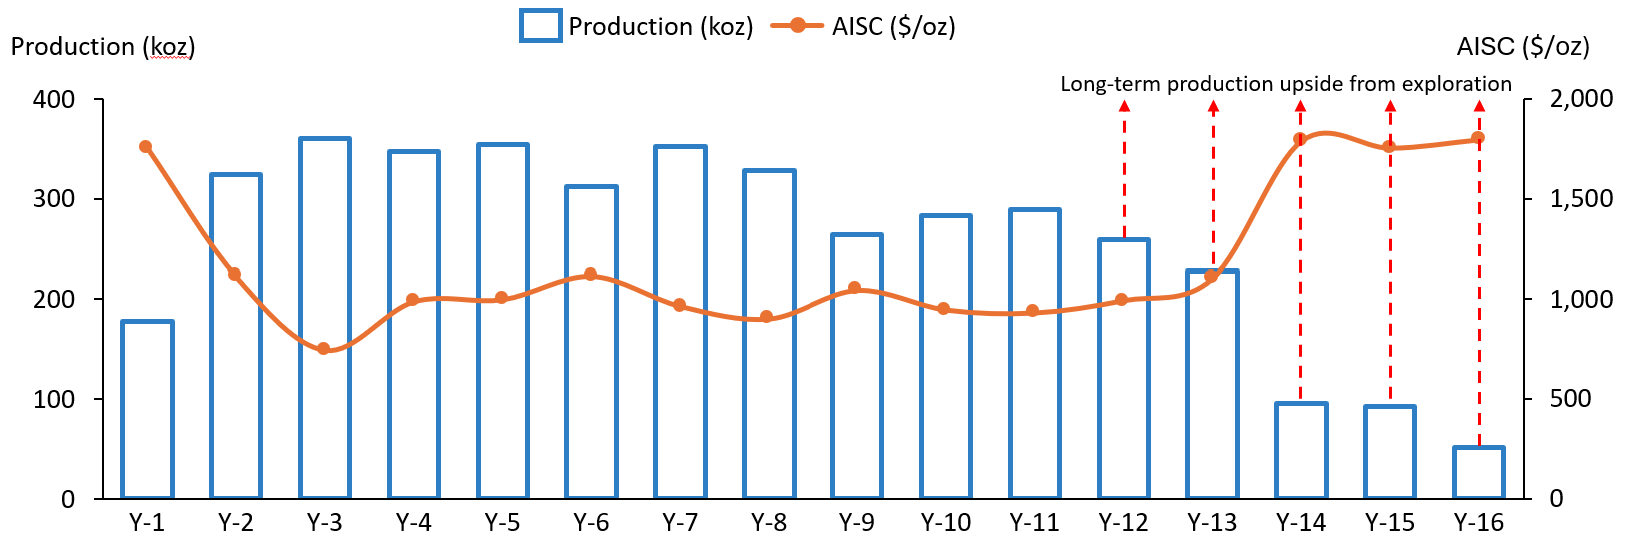
1AISC based on a gold price of
The DFS production profile is based on the Assafou deposits’ mineral reserves only, with an effective date of
Reserves and Resources
The Assafou Project’s
| Table 4: Assafou Project Reserves and Resources | ||||
| Tonnage | Grade | Content | ||
| On a 100% basis | (Mt) | (Au g/t) | (Au koz) | |
| Assafou Deposit (DFS) | ||||
| Proven Reserves | 21.5 | 1.87 | 1,295 | |
| Probable Reserves | 55.9 | 1.72 | 3,085 | |
| P&P Reserves | 77.4 | 1.76 | 4,379 | |
| Measured Resource (incl. reserves) | 20.8 | 2.05 | 1,367 | |
| Indicated Resources (incl. reserves) | 59.4 | 1.89 | 3,606 | |
| M&I Resources | 80.1 | 1.93 | 4,972 | |
| Inferred Resources | 0.9 | 2.34 | 69 | |
| Pala Trend 3 | ||||
| Proven Reserves | - | - | - | |
| Probable Reserves | - | - | - | |
| P&P Reserves | - | - | - | |
| Measured Resource (incl. reserves) | - | - | - | |
| Indicated Resources (incl. reserves) | 4.7 | 1.55 | 231 | |
| M&I Resources | 4.7 | 1.55 | 231 | |
| Inferred Resources | 1.0 | 1.68 | 53 | |
| Proven Reserves | 21.5 | 1.87 | 1,295 | |
| Probable Reserves | 55.9 | 1.72 | 3,085 | |
| P&P Reserves | 77.4 | 1.76 | 4,379 | |
| Measured Resource (incl. reserves) | 20.8 | 2.05 | 1,367 | |
| Indicated Resources (incl. reserves) | 64.0 | 1.86 | 3,837 | |
| M&I Resources | 84.8 | 1.91 | 5,203 | |
| Inferred Resources | 1.9 | 2.00 | 122 | |
1Mineral Resource Estimate effective 31 December 2025. Mineral Reserve Estimate effective 31 December 2025. Mineral Resource and Reserve Estimates follow the
For technical notes and drilling results from the Assafou drill programme, please see the Technical Notes section below.
Mining Operations
The Assafou deposit mineralisation extends from surface to depths in excess of 300 metres and is amenable to conventional open-pit, drill and blast, mining. The mine planning, resource and cost estimation for the DFS is based on a contract mining operation with a maximum mining capacity of 53.0 Mt per year, that is expected to be achieved 5 months after the commencement of mining. Mining capacity is expected to exceed processing capacity in order to accumulate stockpiles to allow high grade material to be preferentially processed early in the mine plan.
During the pre-commercial production period approximately 49.3 Mt of pre-stripping is expected to support an accelerated production ramp up. The projects and operations teams will review opportunities to reduce the impact of pre-stripping at the Assafou deposit through supplementing the ore feed with near-surface ore from the Pala Trend 3 deposit, located 1km southwest of the Assafou deposit, as well as additional satellite deposits in close proximity to the Assafou deposit.
Ore mining is expected to occur in 15-metre benches and 6.0 x 2.5-metre flitches in fresh rock, while waste is expected to be mined in 5-metre flitches. Smaller excavators will be used for ore loading to decrease dilution.
Diesel excavators and dump trucks will be used for loading and haulage, with a contractor fleet expected to comprise of 300-tonne class face excavators for waste mining, and 150-tonne class excavators for ore mining.
Processing Operations
Ore will be processed via a 5.0 Mtpa gravity / carbon-in-leach (“CIL”) processing plant. Over the life of mine, the plant will be fed with approximately 88% fresh ore and 12% oxide and transitional ore.
The comminution circuit is expected to comprise of two-stage crushing followed by a high-pressure grinding roll and a ball milling circuit. A primary gyratory crusher will crush ore to a coarse crush size, followed by dual secondary cone crushers. A live primary crushed ore stockpile will provide a buffer storage of primary crushed ore, with reclaim to feed the secondary crushing unit. Ore will then be fed through the high-pressure grinding roll circuit that feeds the ball mill. In the event that the secondary crushers or the high-pressure grinding roll circuits are offline, a fines stockpile located after the high-pressure grinding roll circuit will ensure there is feed available for the ball mill. The ball mill will mill the ore to 80% passing 106µm (microns).
The milled ore will pass through a gravity circuit comprising two Knelson concentrators for separation and recovery of coarse free gold, to produce a gravity concentrate for cyanidation and electrowinning that can be smelted to produce gold doré. High gravity recovery of approximately 70% is estimated.
Coarse feed is returned to the ball mill while screened cyclone overflow is passed via the leach feed thickener to a CIL circuit containing one pre-leach tank and six CIL tanks, in series, for leaching and absorption. Leach residence time will be approximately 36 hours. Following leaching and absorption, gold will be recovered from activated carbon by elution, electrowinning, and gold smelting to produce gold doré.
Extensive multiphase metallurgical test work has demonstrated that ore from the Assafou deposit contains free-milling gold, with a high proportion of gravity recoverable gold, that is amenable to cyanidation. The majority of the remaining gold has a high leach extraction potential resulting in an overall gold recovery rate of 94% over the life of mine.
Operating Cost Summary
Mining operating costs, which are based on Q3-2025 estimates, were prepared by
| Table 5: Assafou Project Life of Mine Operating Unit Costs (-10/+15%) | |
| UNIT COSTS (US$) | |
| Open Pit Mining and Rehandling | |
| Processing | |
| G&A | |
| Based on Q3-2025 estimates that exclude escalation. | |
Operating costs have been based on a delivered diesel price of
Capital Cost and Infrastructure Summary
The project upfront capital cost, which is based on Q3-2025 estimates, was compiled by Lycopodium with input from Knight Piésold
The initial capital cost is summarized in the table below.
| Table 6: Assafou Project Upfront Capital Cost Estimate Summary (-10/+15%) | |
| CAPITAL COSTS (US$M) | |
| Pre-production Mining | 111.4 |
| Processing Plant Costs | 155.8 |
| Reagents and Plant Services | 30.9 |
| Site Infrastructure | 250.2 |
| Contractor Distributables | 65.4 |
| 215.7 | |
| Management Costs | 50.7 |
| Subtotal | 880.1 |
| 76.3 | |
| Contingency | 85.4 |
| Taxes and Duties | 18.8 |
| Total Upfront Capital Cost | 1060.6 |
| Based on Q3-2025 estimates that exclude escalation. | |
The Assafou project capital cost estimate assumes a contractor mining model, selected due to the additional fleet flexibility that can accommodate the pre-production mining ramp-up and the potential incorporation of satellite deposits into the mine plan.
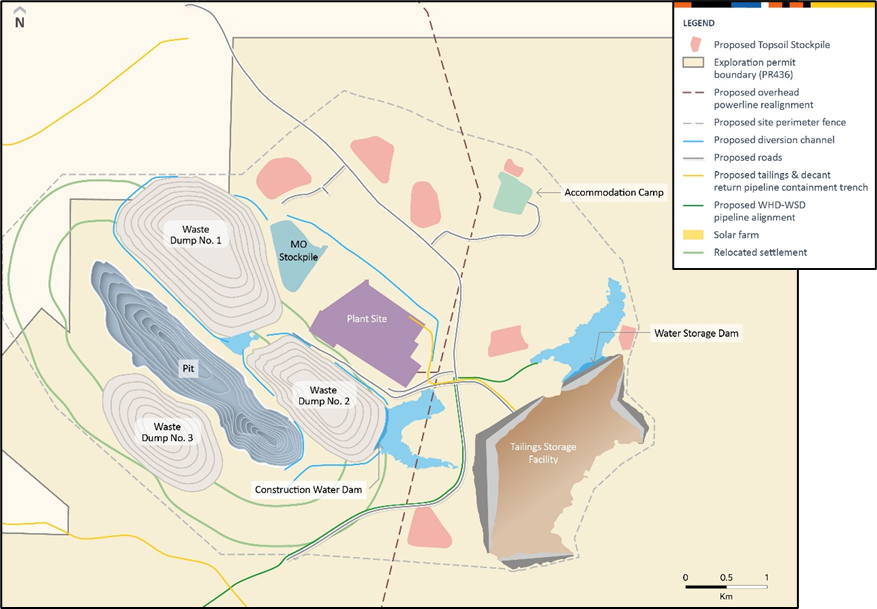
The Assafou project benefits from good surrounding infrastructure, including access to the 90kV ring main power supply, which will be diverted via a new 12km transmission line, and access to the A1 national road, which will be diverted via an assumed 55km extension around the operation. In addition, backup power comprised of 28 containerised diesel generators with prime output of 28.0MW has been included in the upfront capital costs. Furthermore, land provision within the existing mine perimeter for a potential 31.5MW solar power plant has been provided. The airstrip will be built 10km from the site’s permanent accommodation. Resettlement of two villages, within close proximity to the project, is required and is included in the upfront capital cost estimate. The tailings storage facility (“TSF”) is expected to be a High-Density Polyethylene (“HDPE“) lined cross-valley storage facility, utilising the natural topography of the project area, that will be formed by multi-zoned earth fill embankments, with a total footprint area (including the basin area) of approximately 239ha for the stage 1 TSF to 265ha for the final TSF. TSF construction will benefit from the high availability of fresh waste rock from the mining pre-stripping activities. The TSF is designed to a life-of-mine capacity accommodating a total of 72.0Mt of tailings. The Stage 1 TSF is designed for 7.5Mt, approximately 18 months storage capacity, and subsequently, downstream raise construction will be used to progressively increase capacity.
Estimated resettlement disbursements and related costs are included in the
Figure 3 below highlights the proposed site and infrastructure layout.
Figure 3: Assafou Project Schematic Site Layout
Ownership, Permitting, Taxes and Royalties
A corporate tax rate of 25% of gross profit, a royalty rate of 8.0% above a gold price of
The
Timetable,
A 24 to 30 month construction period is projected following the final investment decision, which is targeted before the end of 2026. The final investment decision and the construction period do not reflect any potential impact from current hostilities in the
As shown below in Figure 4, commencement of procurement for long-lead items, detailed engineering and design, and the EPCM, power and earthworks tenders are already underway.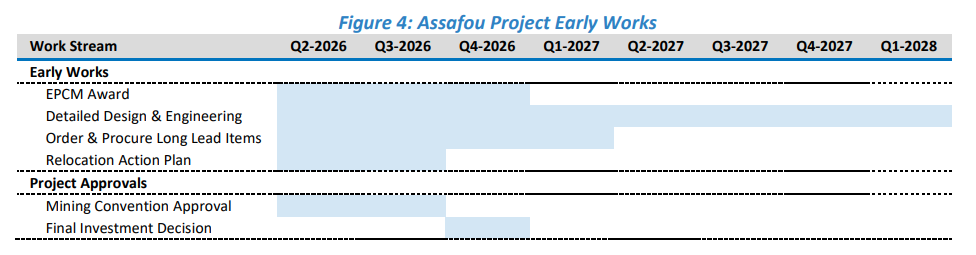
For FY-2026, growth capital guidance of between
Following the final investment decision, construction is expected to start, initially prioritising the resettlement, which is on the critical path, and the site infrastructure and earth works. Subsequently tailings and water dam construction, then power supply and process plant construction will commence.
The critical path includes the resettlement, mining pre-stripping and process ore commissioning. The resettlement is required to commence mining pre-stripping. Mining pre-stripping is expected to start approximately five quarters after the final investment decision, in order to provide access to thick, high-grade zones of the ore body early, and support a short processing plant and production ramp-up.
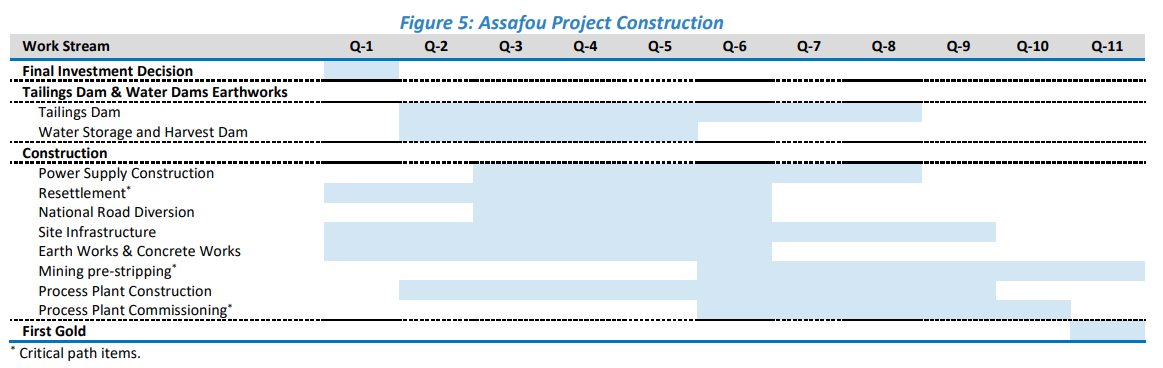
* Critical path items.
Next steps
- Q2-2026: Procurement of long-lead items has been launched.
- Q2-2026: Detailed engineering and design is underway.
- Q2-2026: EPCM, power and earthworks tender reviews are advancing towards finalisation.
- Q2-2026: Development of the relocation action plan is underway to support the resettlement.
- Q3-2026: Expected completion of mining convention negotiations.
- End-2026: Final investment decision is targeted before the end of 2026.
2026 DFS vs 2024 PFS
The key changes between the Assafou PFS news release published on
| Table 7: Assafou Project DFS vs PFS Highlights | |||
| DFS | PFS | DFS VS PFS | |
| PLANT TYPE, SIZE & CAPEX | |||
| Plant type | Gravity / CIL | Gravity / CIL | |
| Mill capacity, Mtpa | 5.0 | 5.0 | - |
| RESERVES & RESOURCES4 | |||
| P&P Reserves, koz | 4,379 | 4,115 | +6% |
| M&I Resources, koz | 4,972 | 4,604 | +8% |
| Inferred Resources, koz | 69 | 208 | (67)% |
| LIFE OF MINE PRODUCTION | |||
| Mine life, years | 16 | 15 | +7% |
| Strip ratio, W:O | 6.3 | 5.9 | +7% |
| Tonnes processed, Mt | 77.4 | 72.8 | +6% |
| Grade processed, Au g/t | 1.76 | 1.76 | - |
| Gold contained processed, Moz | 4.4 | 4.1 | +6% |
| Average recovery rate, % | 94 | 94 | - |
| Gold production, Moz | 4.1 | 3.9 | +5% |
| CAPITAL AND OPERATING COSTS | |||
| Upfront capital cost, $m | 1,061 | 734 | +45% |
| Open Pit Mining & Rehandling, $/t mined | 4.11 | 4.08 | +1% |
| Processing, $/t processed | 14.38 | 12.25 | +17% |
| G&A, $/t processed | 4.48 | 4.10 | +9% |
| AVERAGE FOR YEARS 1 TO 8 | |||
| Average annual production, kozpa | 320 | 327 | (2)% |
| Cash costs, $/oz1 | 887 | 854 | +4% |
| AISC, $/oz1 | 1,026 | 949 | +8% |
| ENVIRONMENTAL DATA | |||
| GHG Emissions Intensity2, t CO2e/oz | 0.59 | 0.55 | +7% |
| Energy Intensity, GJ/oz | 7.39 | 7.23 | +2% |
| ECONOMICS (BASED ON | |||
| Pre-Tax Returns | |||
| NPV5%, $m | 2,909 | 3,408 | (15)% |
| IRR, % | 34 | 48 | (29)% |
| Payback, years3 | 3.0 | 2.4 | 25% |
| After-Tax Returns | |||
| NPV5%, $m | 2,059 | 2,485 | (17)% |
| IRR, % | 28 | 40 | (30)% |
| Payback, years3 | 3.5 | 2.7 | 30% |
| ¹ AISC and cash costs based on a gold price of | |||
Table 8 demonstrates a significant uplift in resource and reserve size and confidence within the Assafou deposit. P&P reserves at the Assafou deposit increased by 6% while M&I resources increased by 8%, following 99,000 metres of additional drilling both within, and outside of, the Assafou pit shell, subsequent to the completion of the PFS.
This additional drilling also supported improved reserve and resource confidence, which is reflected by the addition of maiden Proven reserves of 21.5Mt at 1.87g/t for 1.3Moz alongside maiden Measured resources of 20.8Mt at 2.05g/t for 1.4Moz, which cover 40% of the first five years of the mine plan. This improvement is underpinned by closer spaced drilling at 20 x 25 metre spacing, compared to previous drilling at 33 x 40 metre spacing and 100 x 80 metre spacing that supported the PFS and the maiden resources respectively. The increased reserve and resource confidence supports de-risking of the ramp up and the first five years of the mine plan.
| Table 8: Assafou Project Mineral Reserves and Resources1 | |||||||||
| VARIANCE | |||||||||
| On a 100% basis. M&I Resources shown inclusive of Reserves. | Tonnage | Grade | Content | Tonnage | Grade | Content | Au Content | ||
| (Mt) | (Au g/t) | (Au koz) | (Mt) | (Au g/t) | (Au koz) | (Au koz) | |||
| Proven Reserves | 21.5 | 1.87 | 1,295 | - | - | - | +1,295 | ||
| Probable Reserves | 55.9 | 1.72 | 3,085 | 72.8 | 1.76 | 4,115 | -1,030 | ||
| P&P Reserves | 77.4 | 1.76 | 4,379 | 72.8 | 1.76 | 4,115 | +264 | ||
| Measured Resource (incl. reserves) | 20.8 | 2.05 | 1,367 | - | - | - | +1,367 | ||
| Indicated Resources (incl. reserves) | 59.4 | 1.89 | 3,606 | 73.6 | 1.95 | 4,604 | -998 | ||
| M&I Resources (incl. reserves) | 80.1 | 1.93 | 4,972 | 73.6 | 1.95 | 4,604 | +368 | ||
| Inferred Resources | 0.9 | 2.34 | 69 | 3.3 | 1.97 | 208 | -139 | ||
| ¹Excludes maiden Mineral resource Estimate for the Pala Trend 3 deposit, which is excluded from the DFS mine plan. ²Mineral resource Estimate effective 31 December 2025. Mineral Reserve Estimate effective 31 December 2025. Mineral Resource and Reserve Estimates follow the | |||||||||
The updated mineral resource estimate for the Assafou deposit, based on a gold price of
| Table 9: Assafou Deposit Mineral Resource Estimate Sensitivity1 | |||
| Tonnage | Grade | Content | |
| Measured Resource | (Mt) | (Au g/t) | (Au koz) |
| Based on a gold price of | 20.2 | 2.05 | 1,334 |
| Based on a gold price of $1900/oz | 20.8 | 2.05 | 1,367 |
| Based on a gold price of $2000/oz | 20.8 | 2.05 | 1,370 |
| Based on a gold price of $2100/oz | 20.9 | 2.04 | 1,372 |
| Based on a gold price of | 20.9 | 2.04 | 1,375 |
| Based on a gold price of | 21.0 | 2.04 | 1,382 |
| Indicated Resource | |||
| Based on a gold price of | 54.0 | 1.92 | 3,328 |
| Based on a gold price of $1900/oz | 59.4 | 1.89 | 3,606 |
| Based on a gold price of $2000/oz | 60.1 | 1.88 | 3,635 |
| Based on a gold price of $2100/oz | 60.3 | 1.88 | 3,645 |
| Based on a gold price of | 62.3 | 1.87 | 3,738 |
| Based on a gold price of | 63.3 | 1.86 | 3,777 |
| Inferred Resource | |||
| Based on a gold price of | 0.6 | 2.46 | 46 |
| Based on a gold price of $1900/oz | 0.9 | 2.34 | 69 |
| Based on a gold price of $2000/oz | 1.0 | 2.28 | 72 |
| Based on a gold price of $2100/oz | 1.0 | 2.25 | 74 |
| Based on a gold price of | 1.4 | 2.20 | 97 |
| Based on a gold price of | 1.7 | 2.14 | 115 |
¹Mineral resource estimate effective 31 December 2025. Mineral reserve estimate effective 31 December 2025. Mineral resource and reserve Estimates follow the
As illustrated in the figure 6 below, Assafou’s mine life has been extended by approximately one year due to the increase in P&P reserves, while its average annual production and cost profile remain similar to the PFS.
Figure 6: Assafou Project DFS vs PFS Production Profile1
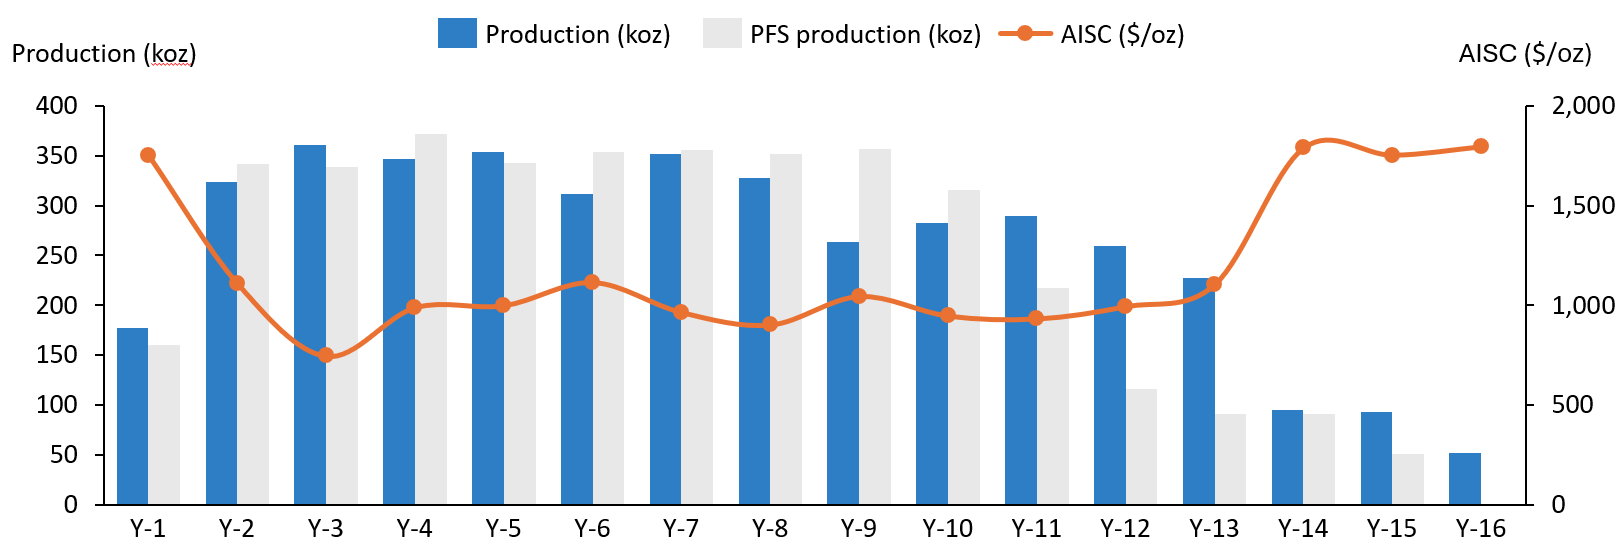
¹AISC based on a gold price of
The upfront capital cost for the project has increased from
| Table 10: Assafou Project PFS - DFS Capital Cost Changes | ||
| Capital cost changes | PFS vs DFS | Rationale |
| Site infrastructure: |
|
|
| Owner project and operations costs: |
|
|
| Processing plant costs: |
|
|
| Pre-production mining and pre-production working capital: |
|
|
| Contractor distributables: |
|
|
| Management costs: - |
|
|
Geology
Mineralisation at the Assafou deposit is both hosted in quartz veins and disseminated within the Tarkwaian Sandstones. The deposit appears to be monometallic, with no potentially deleterious elements associated with the gold. Mineralisation starts at surface and extends to depths of more than 300 metres. It is continuous along strike, following a prominent northwest-trending structure that separates the Tarkwaian Sandstones from the mafic Birimian Basement rocks. The deposit comprises a thick main (up to 100 metres), flat-lying, continuous lens, overlain by a series of stacked lenses dipping at a low angle to the northeast.
High grade mineralisation and the thickest mineralised intercepts are located adjacent to the structural contact between the mafic Birimian Basement rocks and the Tarkwaian Sandstones along the northeast boundary of the Assafou deposit.
Assafou Exploration
The Assafou deposit was discovered in 2022 with the maiden Indicated resource of 14.9Mt at 2.33g/t containing 1.1Moz and an Inferred resource of 32.9Mt at 1.80g/t containing 1.9Moz defined on
Subsequently, an updated Indicated resource of 70.9Mt at 1.97g/t containing 4.5Moz and an Inferred resource of 2.9Mt at 1.91g/t containing 0.2Moz was defined on
In 2025, the mineral resource estimate was updated, with a Measured and Indicated resource of 84.8Mt at 1.91g/t for 5.2Moz and an Inferred resource of 1.9Mt at 1.95g/t containing 0.1Moz, based on 99,000 metres of drilling. This includes the maiden Mineral Resource estimate at Pala Trend 3.
Mineralisation at Assafou remains open along strike along the 20km long structural corridor extending from Koumenagaré in the northwest to Kongojdan in the southeast, as well as at depth where mineralisation has been identified below the current resource pit shell, and within the basement mafic Birimian volcanic rocks.
Figure 7 below highlights the additional drilling at the Assafou deposit that supports the increased reserve and resource size and confidence in the DFS. Infill and advanced grade control drilling on the Assafou deposit was completed during 2025 and reconfirmed the existing resource model, providing increased confidence in the initial phases of ore mining at the deposit. Resource definition drilling was completed at the Pala Trend 3 target located approximately 1 kilometre west of the Assafou deposit defining maiden resources.
Figure 7: Assafou Deposit Map
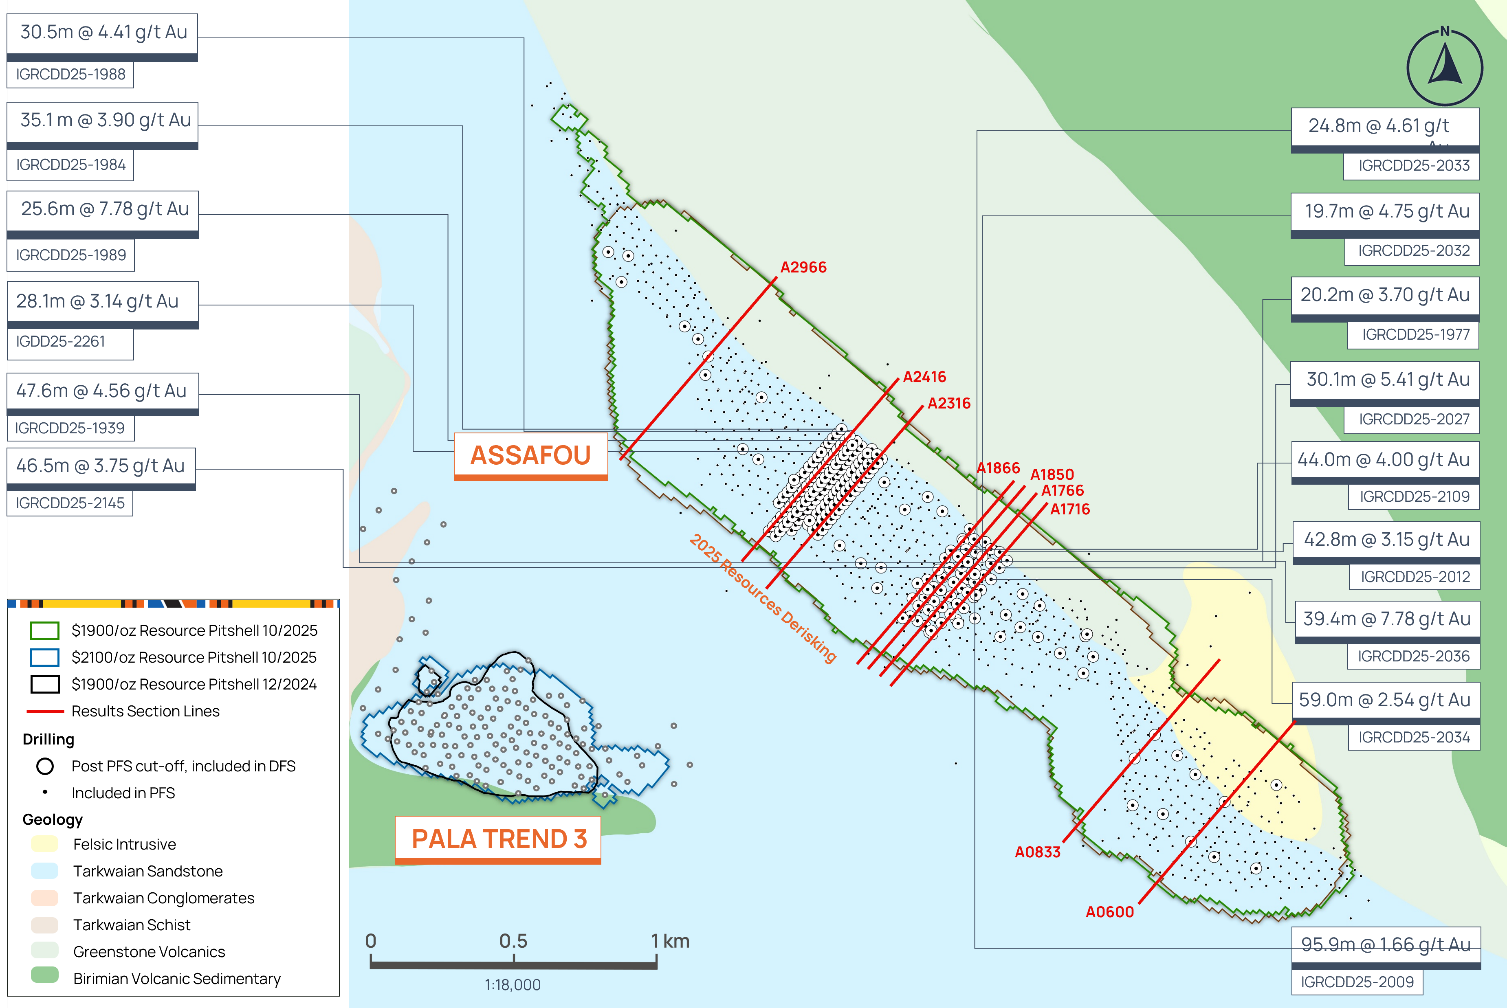
Figure 8 below highlights that 2025 drilling has identified mineralisation towards the southeast of the Assafou deposit, below the existing pit shell. Mineralisation starts at surface within the Tarkwaian Sandstones but extends into the Birimian Basement at depth, where it remains open, with further drilling planned for 2026.
Figure 8: Assafou Cross Section A0600
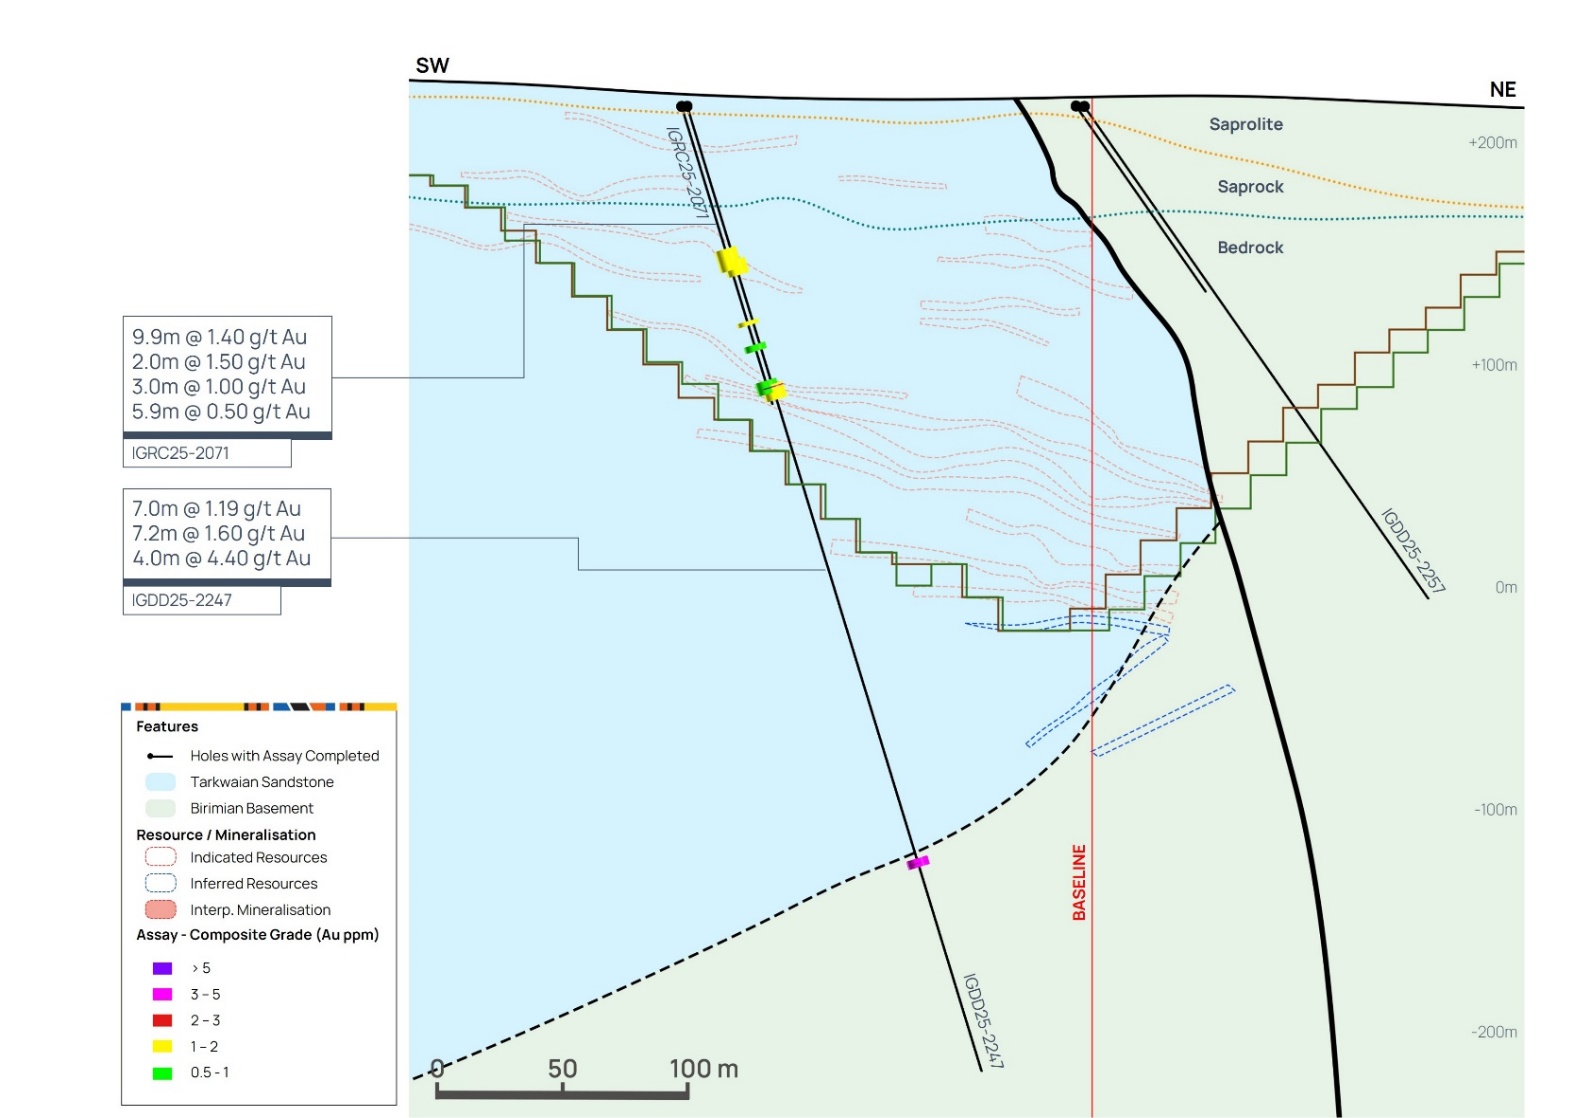
Figure 9 below highlights that 2025 drilling has identified high-grade mineralisation towards the southeast of the Assafou deposit, below the existing pit shell, at the basal contact of the Tarkwaian basin.
Figure 9: Assafou Cross Section A0833
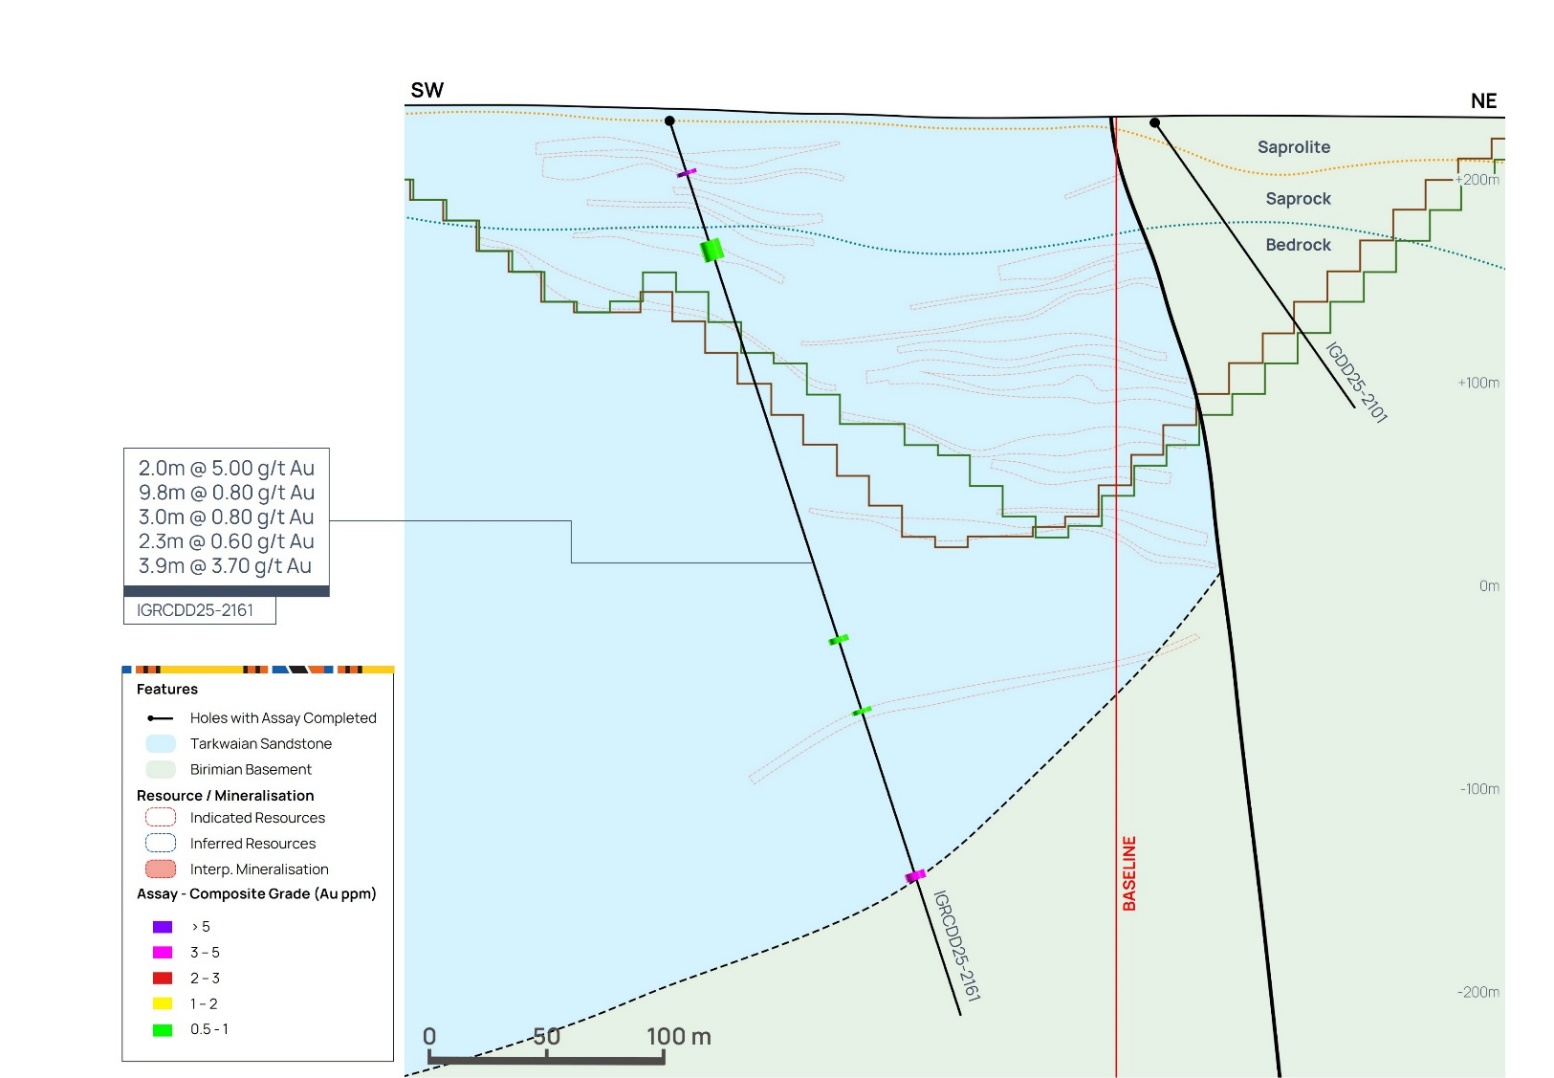
Figure 10 below highlights several thick, stacked lenses of high-grade mineralisation within the central portion of the Assafou deposit, with mineralisation extending below the resource pit shell and in some cases into the Birimian basement rocks.
Figure 10: Assafou Cross Section A1716
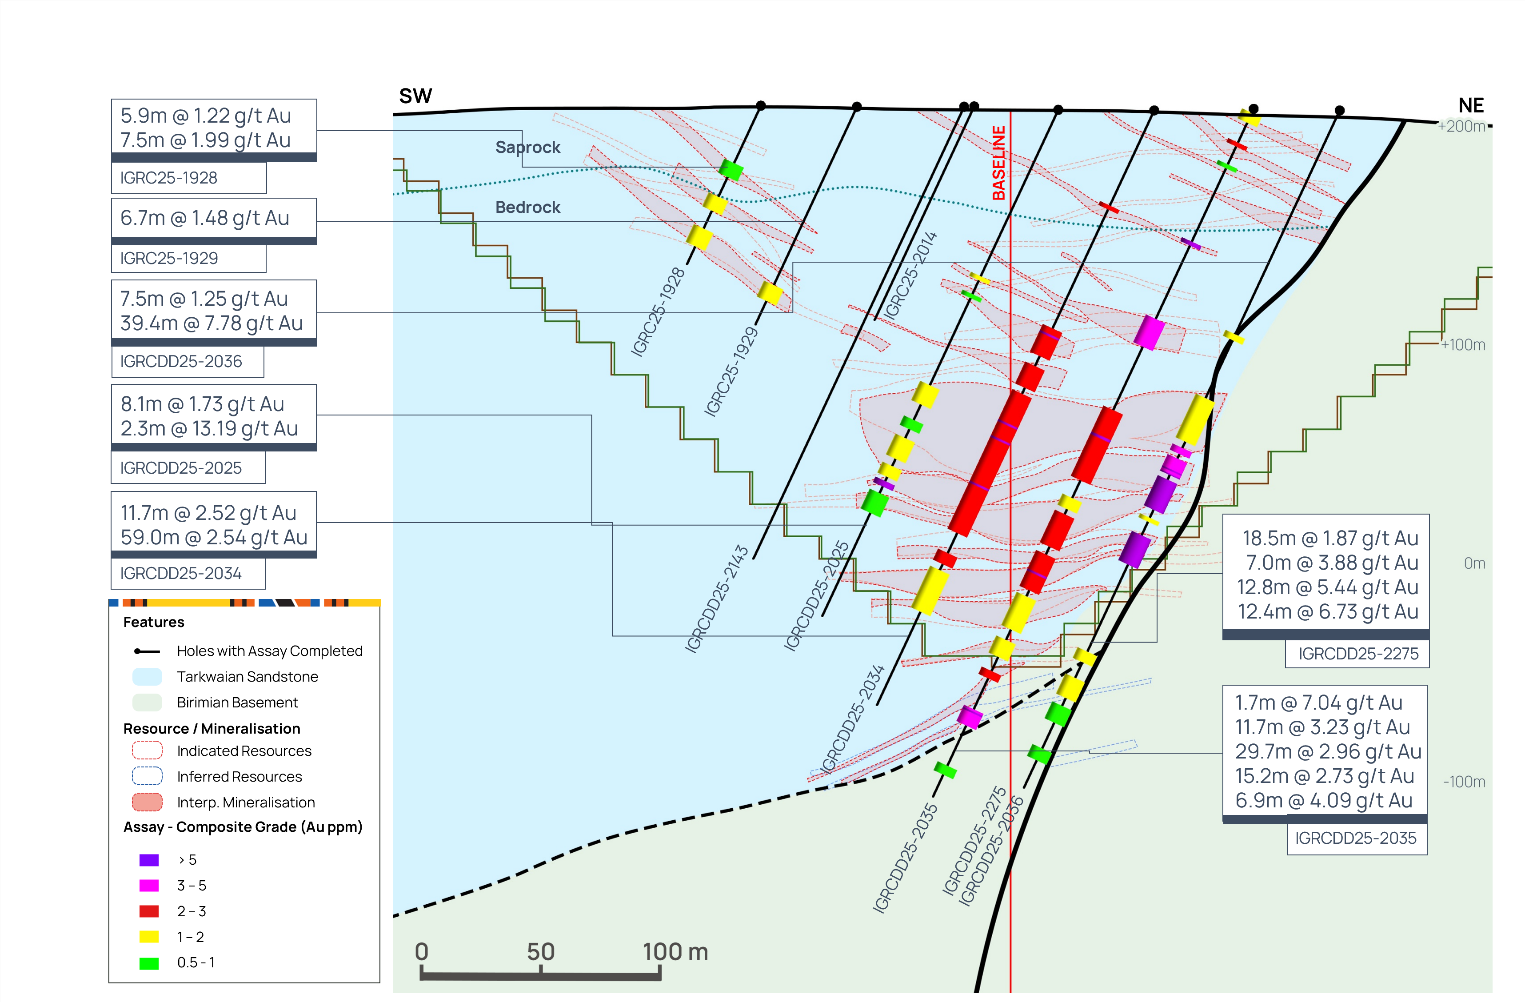
Figure 11 below highlights thick continuous stacked lenses of deep-seated mineralisation in the centre of the Assafou deposit.
Figure 11: Assafou Cross Section A1766
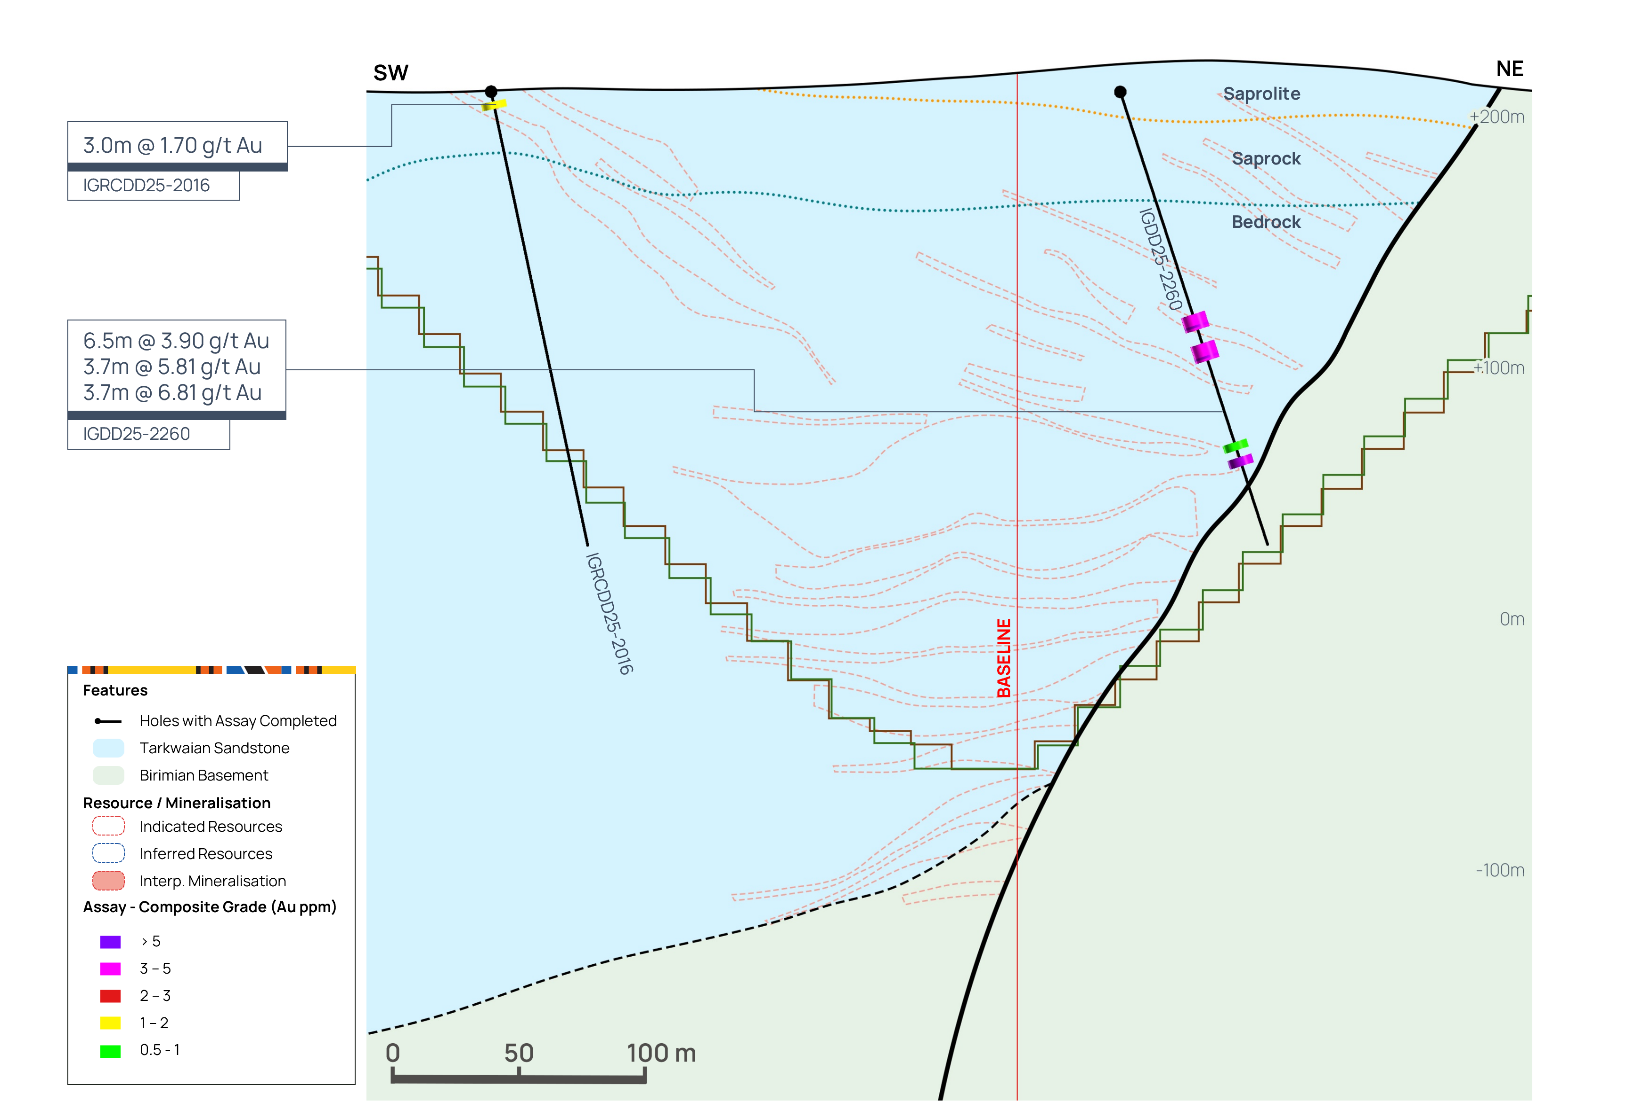
Figure 12 below highlights that drilling within the centre of the Assafou deposit has improved the confidence in several high-grade stacked lenses of mineralisation throughout the deposit and confirmed the continuation of mineralisation along the contact between the Birimian and the Tarkwaian rocks at depth.
Figure 12: Assafou Cross Section A1850
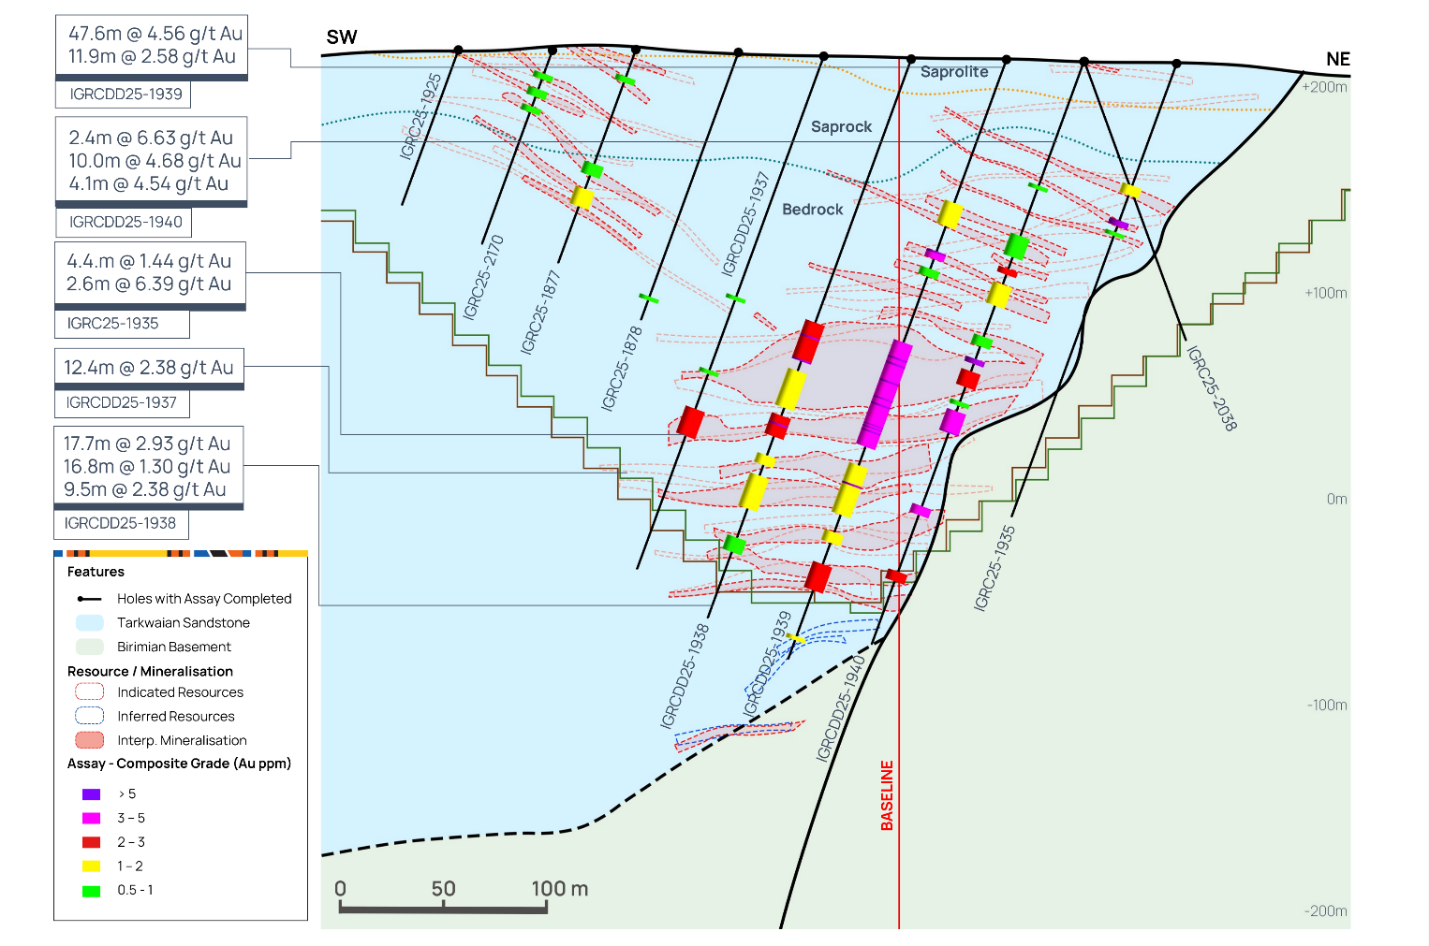
Figure 13 below highlights that drilling within the centre of the Assafou deposit has identified several high-grade intercepts below and adjacent to the existing pit shell, with further drilling planned for 2026 to test the continuity of mineralisation at depth and towards the southwest within the sedimentary basin.
Figure 13: Assafou Cross Section A1866
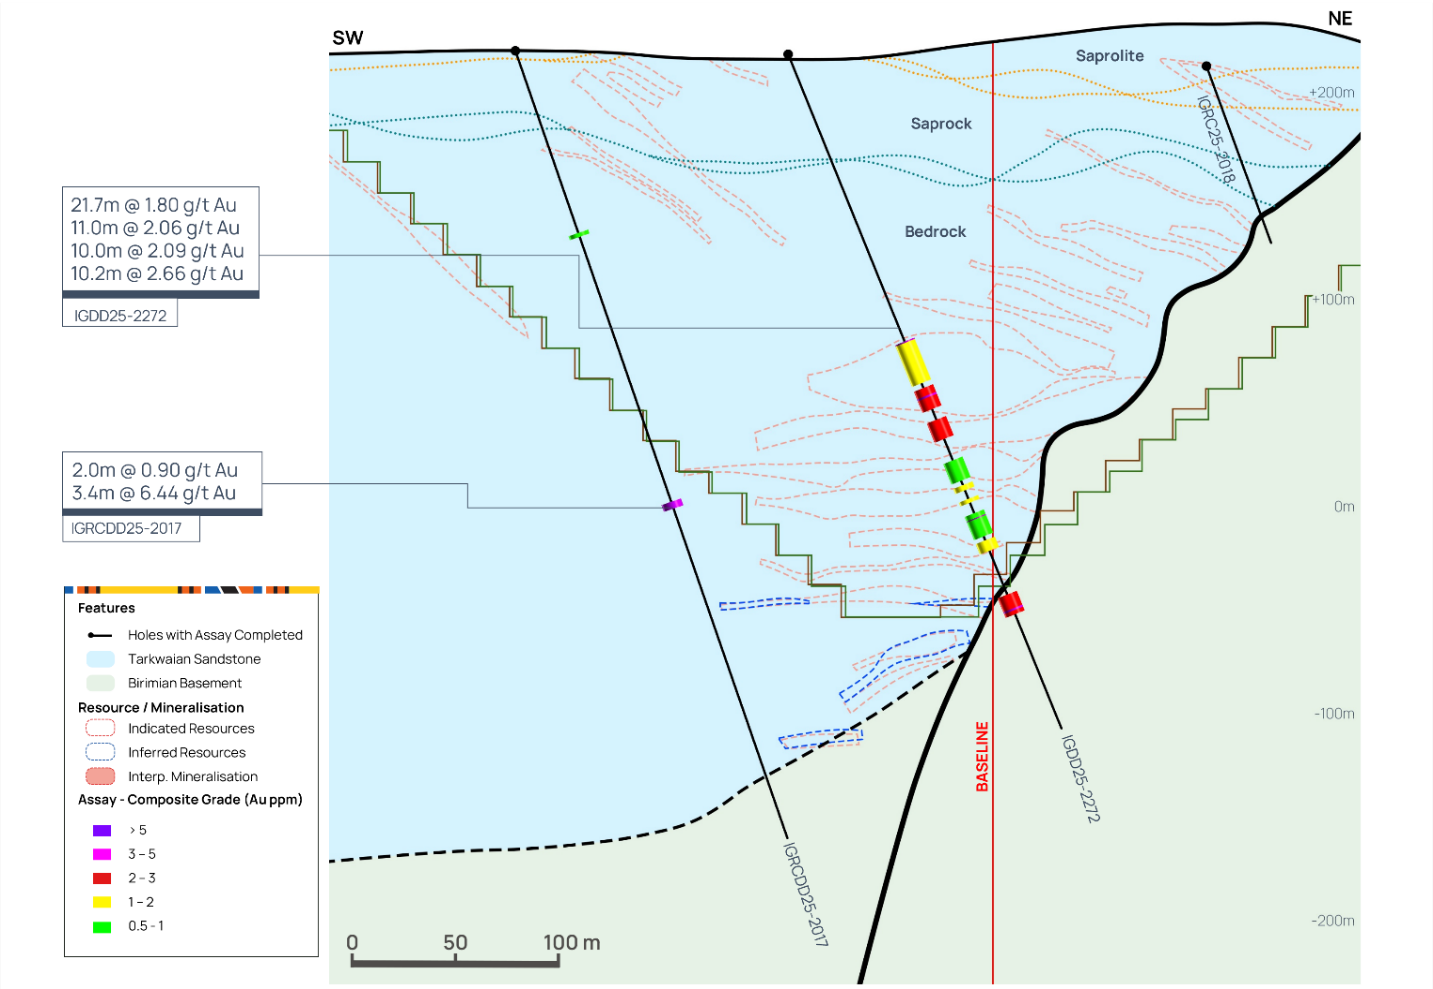
Figure 14 below highlights that drilling in 2025 towards the northwest of the Assafou deposit has confirmed the continuity of several high-grade stacked lenses of mineralisation and identified continuous mineralisation towards the southwest of the Assafou deposit and up to 100 metres below the existing Assafou pit shell.
Figure 14: Assafou Cross Section A2316
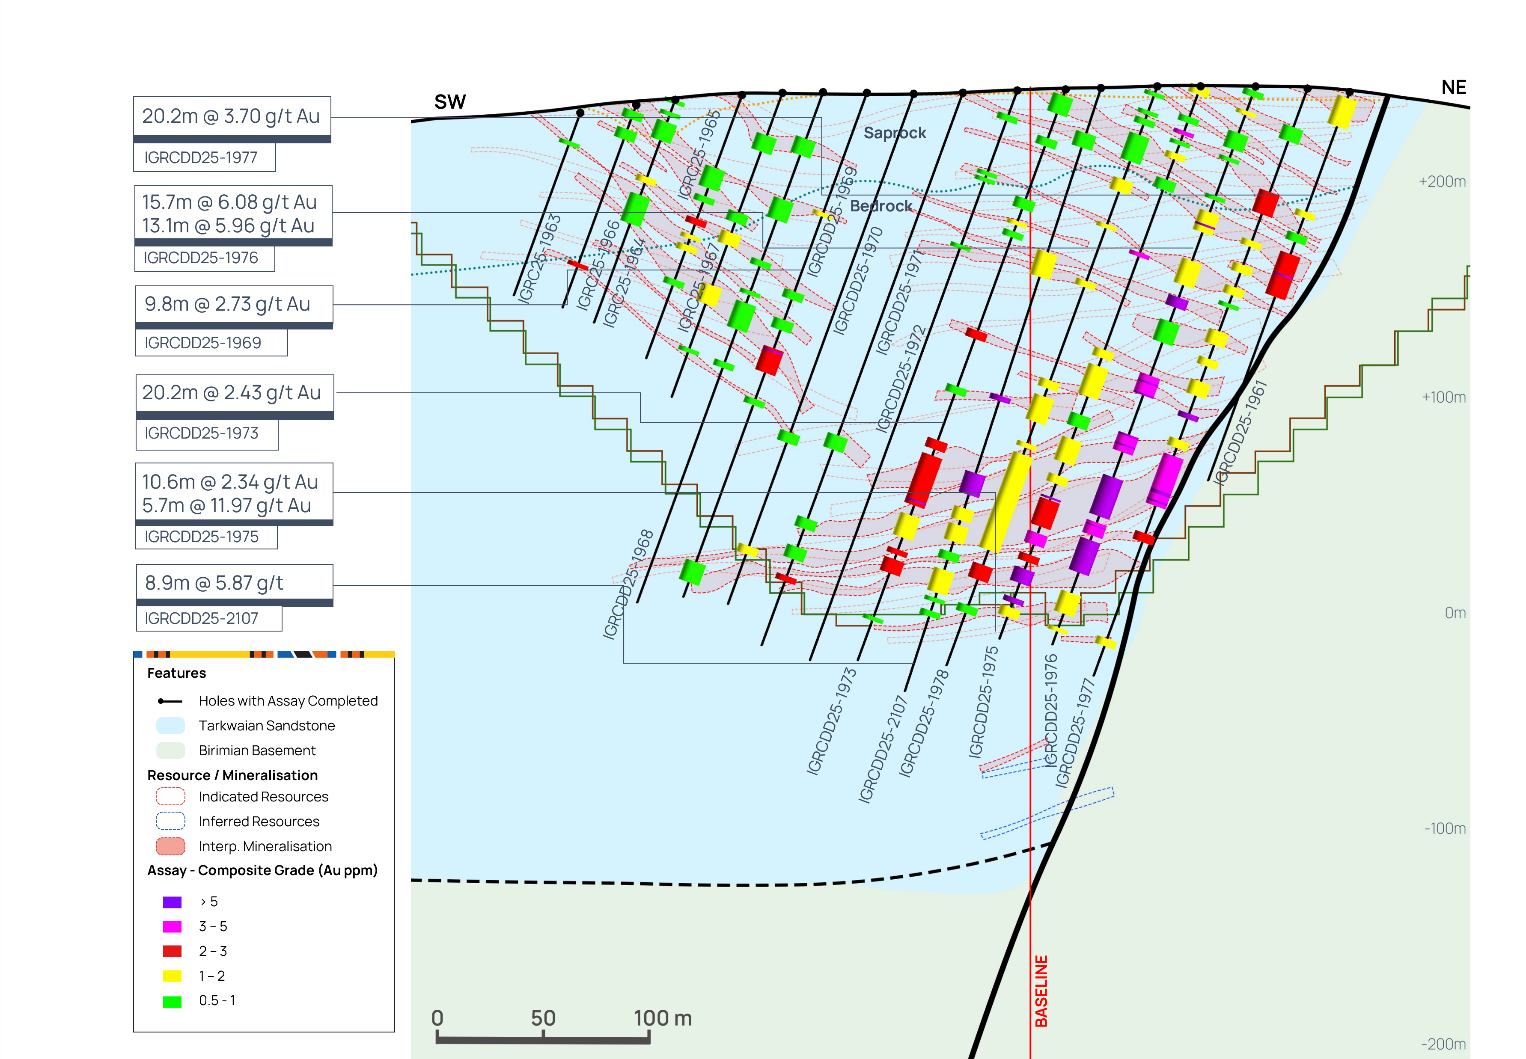
Figure 15 below highlights that drilling towards the northwest of the Assafou deposit has confirmed several high-grade stacked lenses of mineralisation throughout the Assafou deposit. Mineralisation has also been identified up to 50 metres below the Assafou resource pit shell.
Figure 15: Assafou Cross Section A2416
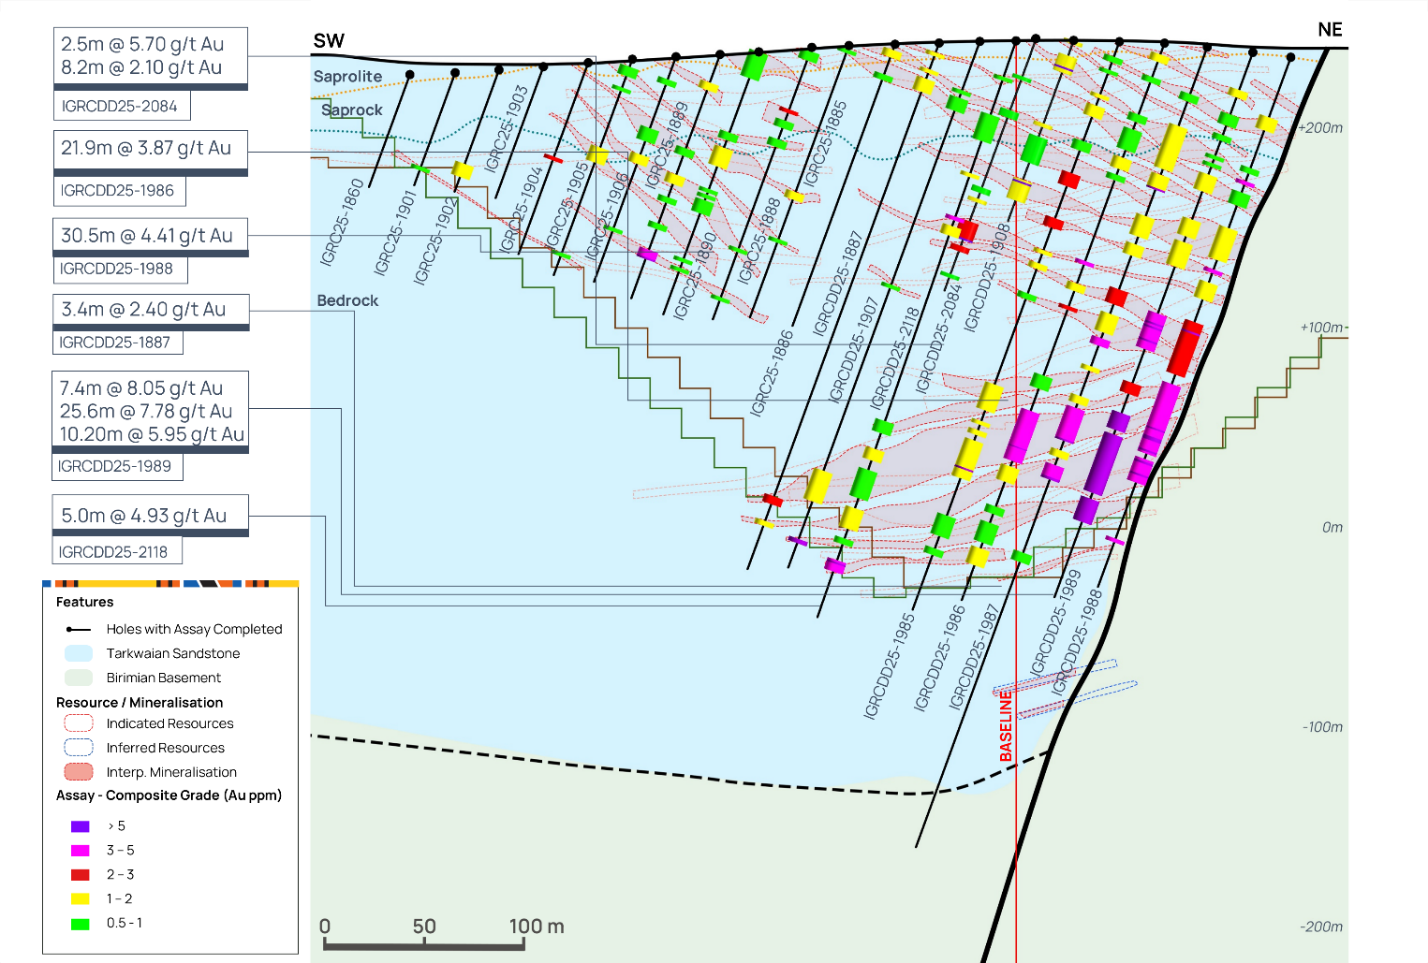
Figure 16 below highlights that drilling towards the northwest of the Assafou deposit has identified significant mineralisation that extends below the existing Assafou pit shell.
Figure 16: Assafou Cross Section A2966
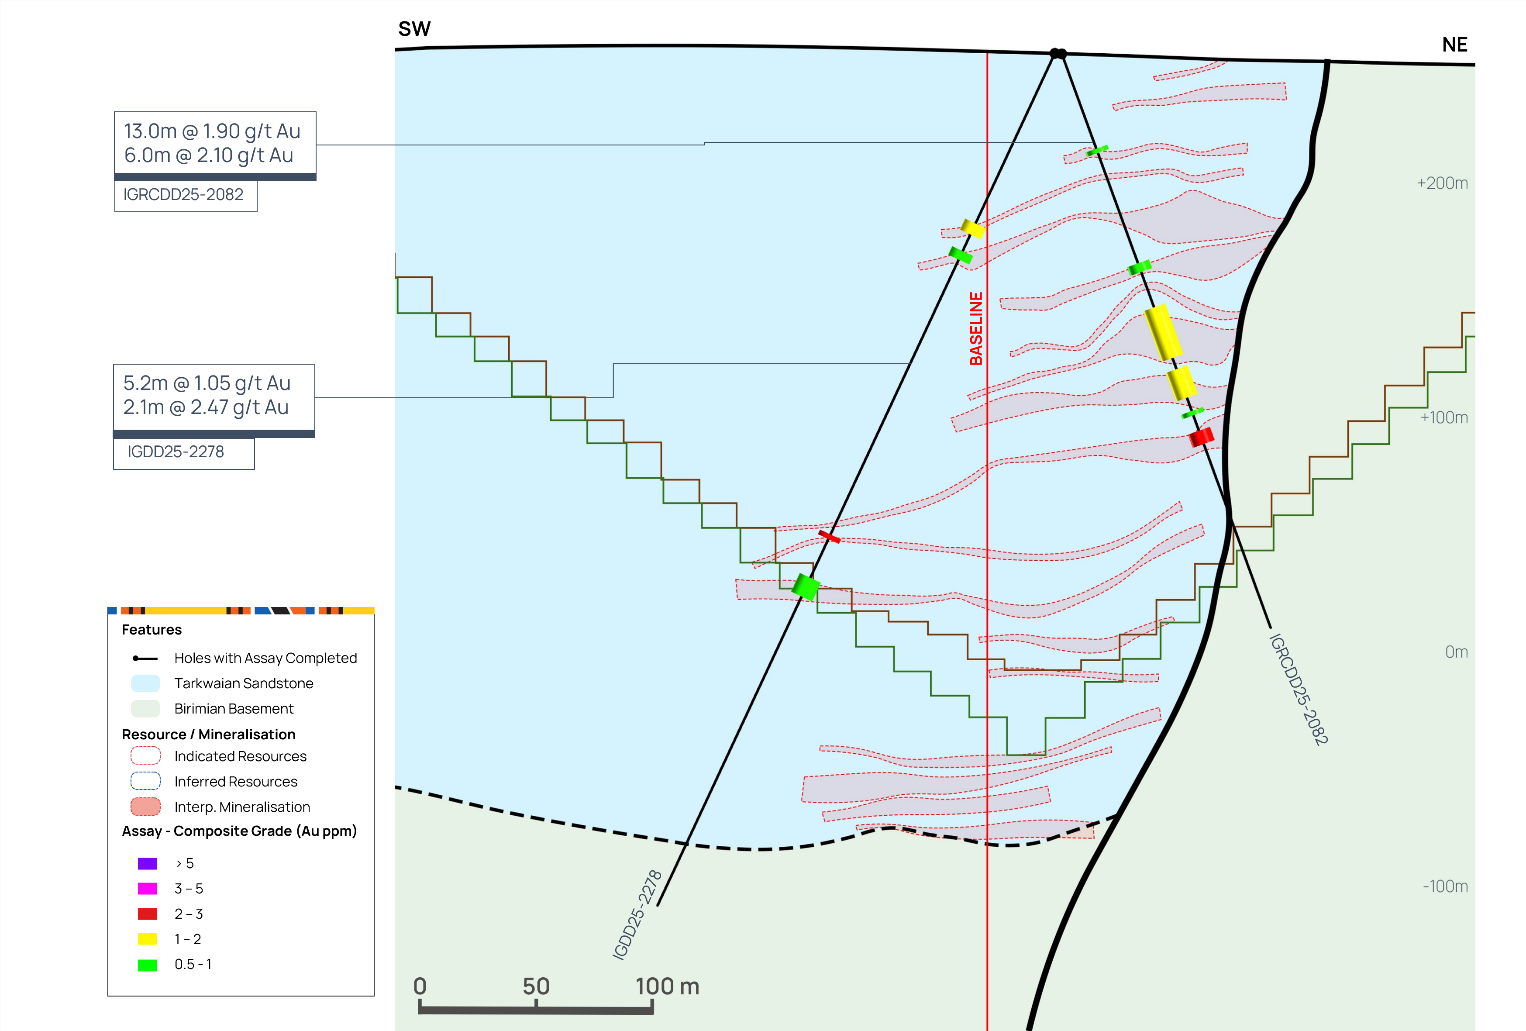
Regional Exploration
Endeavour’s 2026 – 2030 exploration strategy, published on
For FY-2026 exploration at Assafou will advance with a
Following an extensive soil geochemistry and geological mapping campaign, several new targets in close proximity to Assafou have been identified, with planned follow up in 2026. Figure 17 below, highlights some of the high-grade mineralised intercepts identified at these potential satellite targets.
Figure 17: Iguela Regional Map
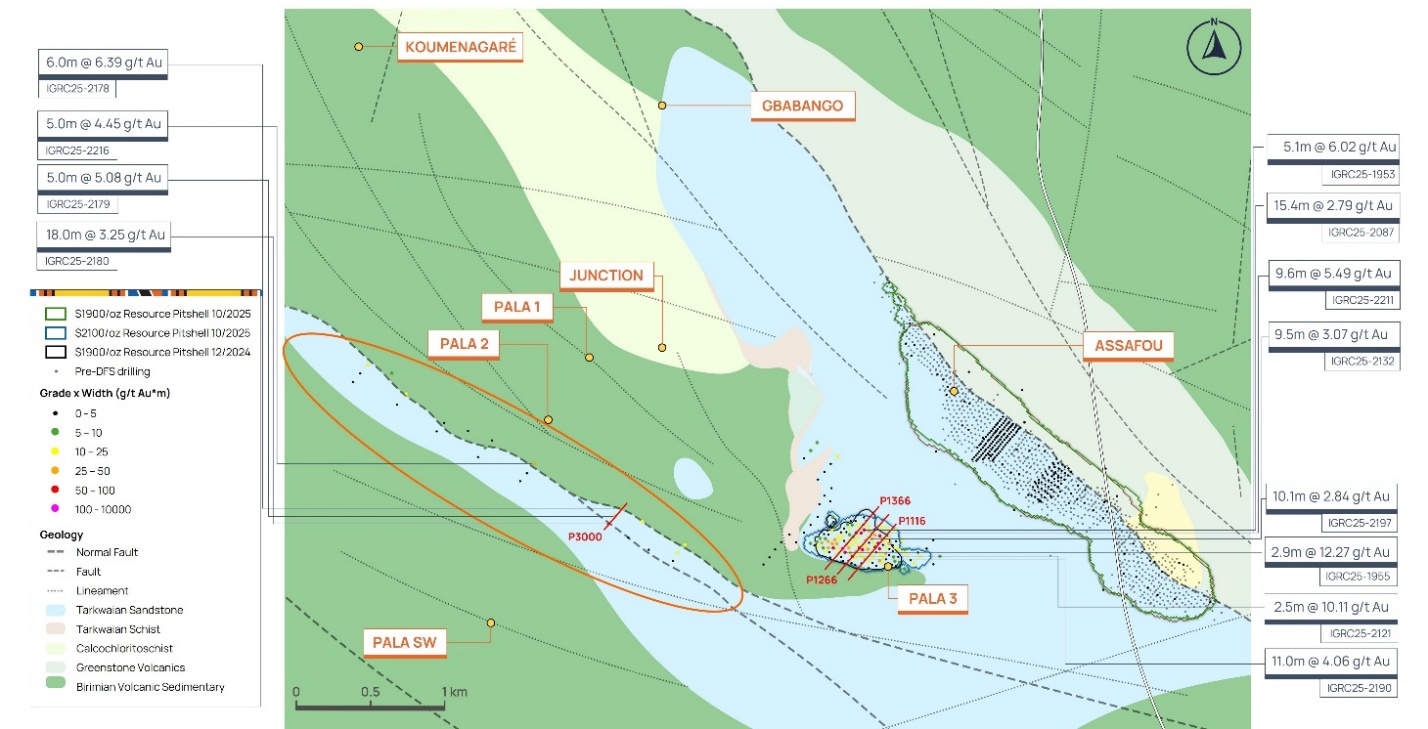
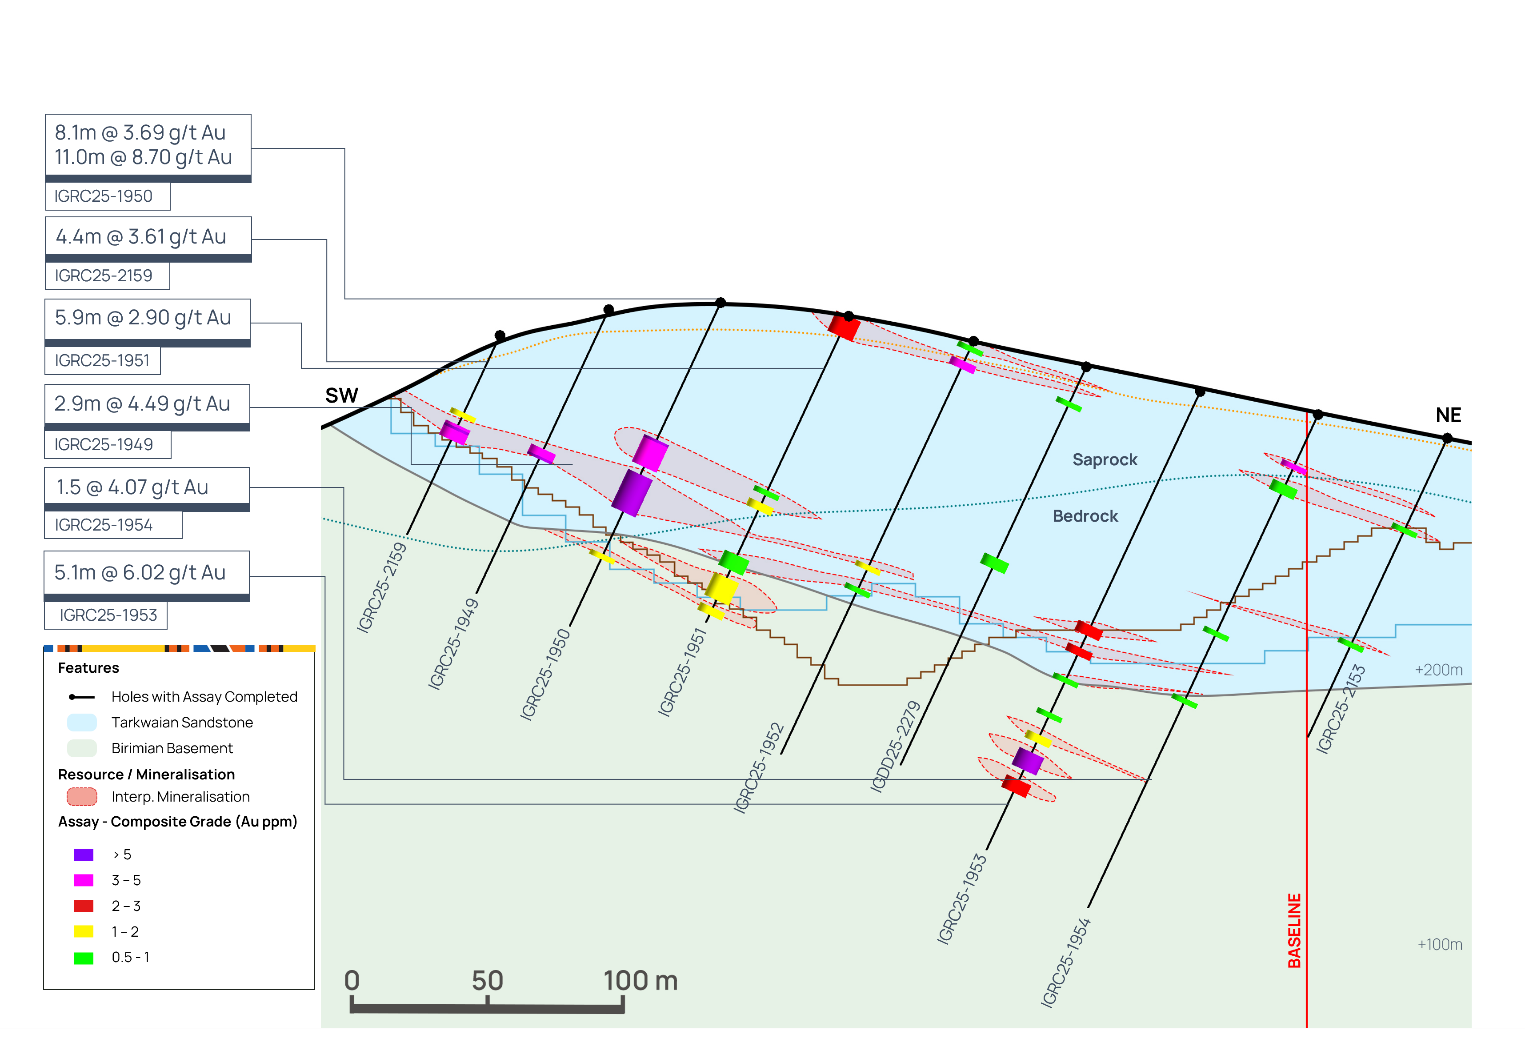
Figures 18, 19 and 20 below highlight the drilling completed at the Pala Trend 3 target in 2025. A 20,000 metre drill programme was completed confirming the presence of continuous lenses of mineralisation in both the Tarkwaian sediments and Birimian basement, close to the contact.
In 2026, a maiden Indicated resource at Pala Trend 3 of 4.7Mt at 1.55g/t for 0.2Moz and a maiden Inferred resource of 1.0Mt at 1.68g/t for 53koz was declared. Pala Trend 3 is located approximately 1 kilometre southwest of Assafou. Mineralisation is high-grade and starts from surface with the potential to supplement near-term production at the Assafou project.
Mineralisation remains open towards the northeast and depth, with further drilling at Pala Trend 3 and the other Pala targets planned for FY-2026.
Figure 18: Pala Trend 3 Cross Section P1166
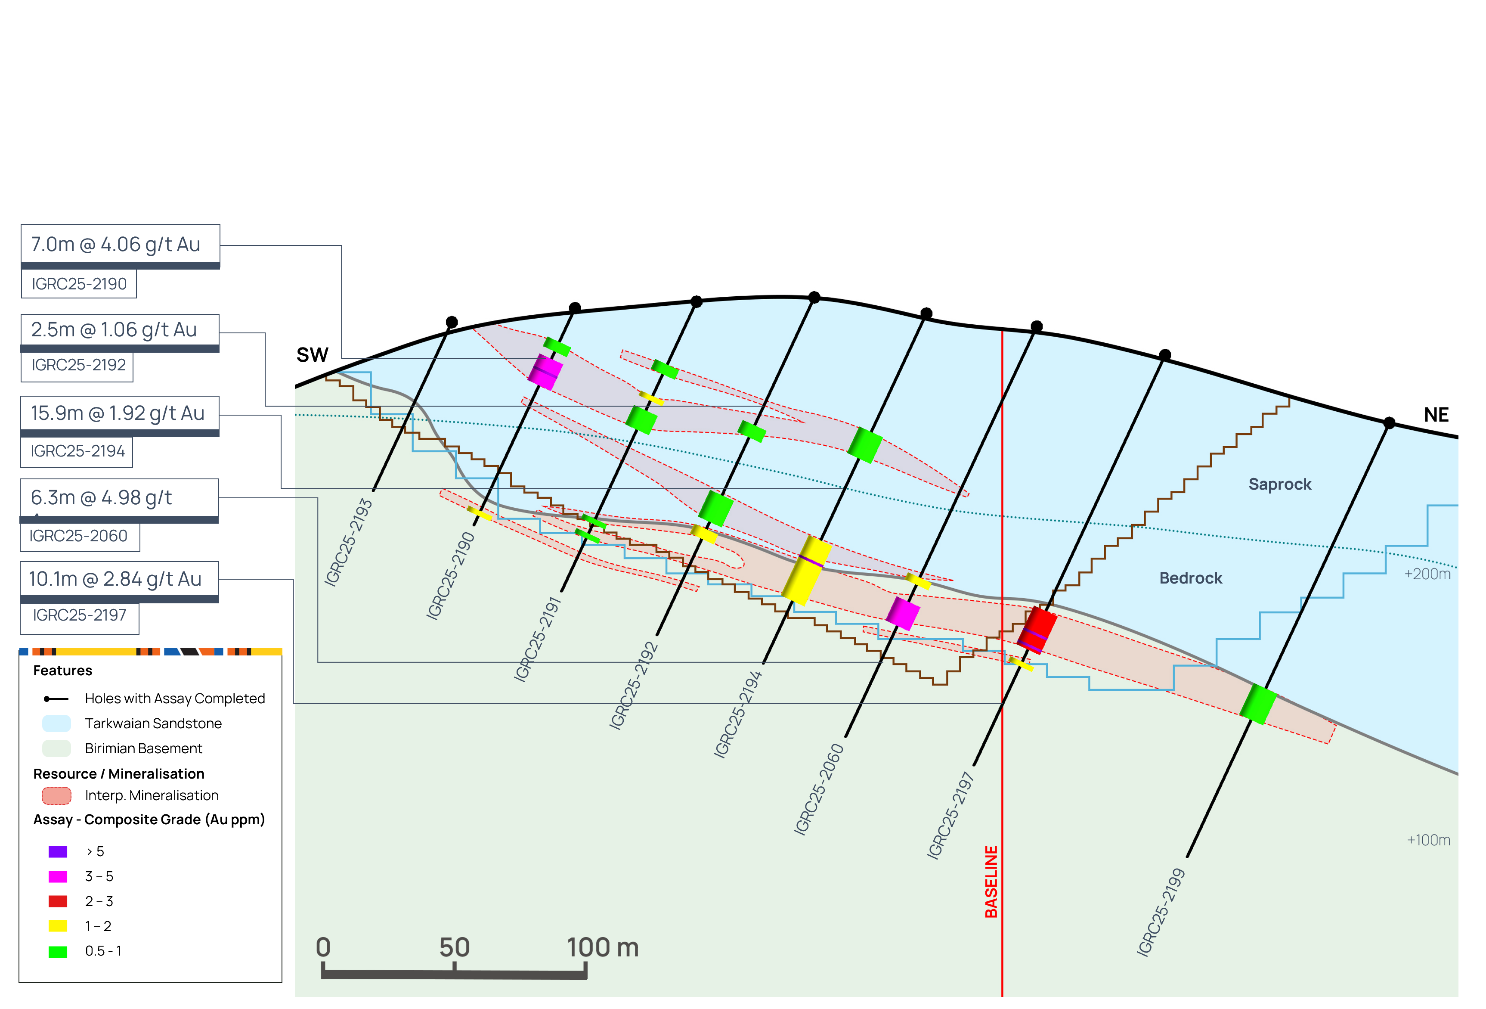
Figure 19: Pala Trend 3 Cross Section P1266
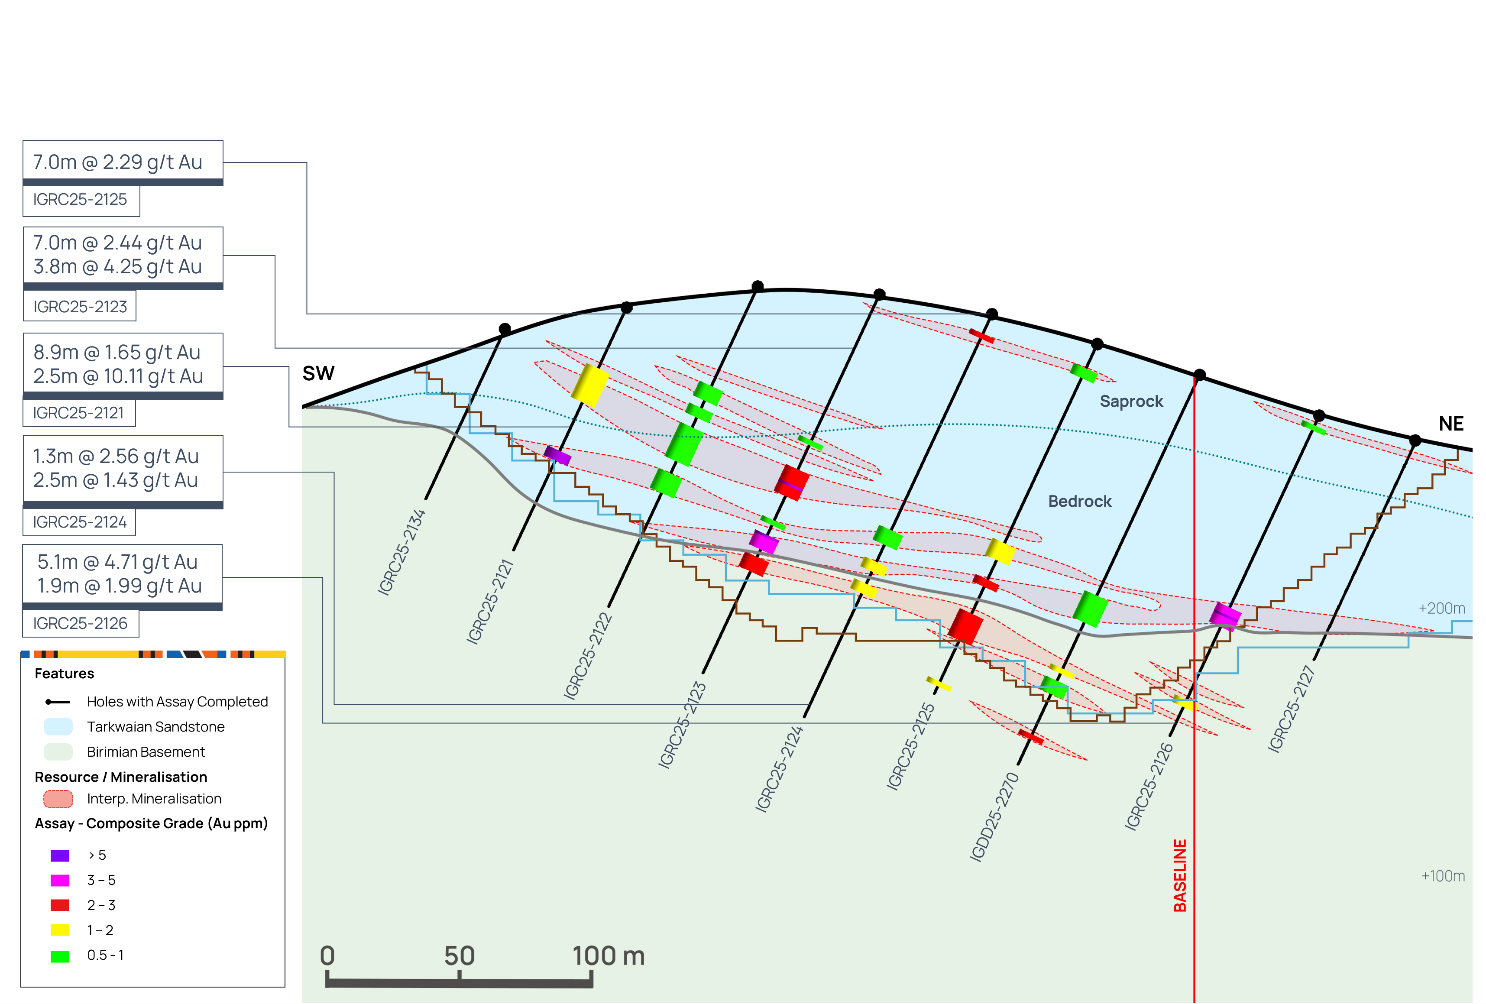
Figure 20: Pala Trend 3 Cross Section P1366
At Pala Trend 2, a 3,331 metre drilling programme was completed during 2025 and defined a 3 kilometre long mineralised trend at the contact between Tarkwaian sediments and Birimian basement. Pala Trend 2 is located approximately 4 kilometres west of the Assafou deposit with continuous, high-grade mineralisation hosted in Birimian Basement rocks.
ASSAFOU TECHNICAL NOTES
All figures are expressed in
Assafou Geology
Mineralisation at Assafou is mainly hosted in Tarkwaian Sandstone, at/or immediately in the vicinity of the structural contact with Birimian Basement rocks (mainly mafic rocks). Gold mineralisation occurs both as disseminated occurrences within pervasively altered sandstone and within, or at the edges of, quartz (±carbonate) veins and breccias that crosscut the altered sandstones. Alteration is reflected by an induration (silicification) and by the presence of sulphides (pyrite), disseminated within the matrix and distributed along the sandstone bedding. The more intense the silicification (and presence of pyrite), the more mineralised the sandstones tend to be.
The structural contact likely controlled the initial sandstone deposition (normal fault in extensional regime). It was then reactivated under an SSW-NNE compressive regime at the brittle-ductile transition, associated with strong mylonitisation and alteration (quartz, carbonate, pyrite, ± sericite, ± chlorite) of the Birimian Basement rocks, and with mafic and felsic intrusions as dykes and sills. Gold mineralisation is likely to have occurred during this reversal, in the post-Tarkwaian reactivation event. Mineralising hydrothermal fluids are believed to have preferentially invaded the Tarkwaian Sandstones rather than the Birimian Basement rocks, due to their higher initial porosity, permeability and competency.
Assafou Resource Modelling
The statistical analysis, geological modelling and resource estimation were prepared by Endeavour’s resource team. The Qualified Person as defined by NI 43-101 responsible for the statistical analysis, geological modelling and mineral resource estimate is
The Assafou mineral resource model was developed in Seequent’s Leapfrog Geo, Snowden’s Supervisor and Geovia’s Surpac software. The database used to generate the mineral resources comprised some 1,367 drill holes, totalling 278,454 metres. The drill hole data was supported by industry-standard quality assurance and quality control systems, with quality control sampling comprising blanks, coarse blanks, certified reference materials, and field and pulp duplicates. The QP has reviewed the QA/QC data available and considers the assay data to be suitable for use in the subsequent mineral resource estimate.
Mineralisation domains were modelled with the Vein System tool in Leapfrog Geo using the interval selection for each vein. The gold assays from the drill holes were composited to 1.0 metre intervals. Grade capping values were applied depending on the mineralised domain, between no cap and 40 g/t Au. Spatial analysis of the gold distribution within the mineralised zone indicated good continuity of the grades along strike and down dip within the mineralised zones. A geostatistical analysis (variography) of the composited gold assay grades was undertaken based on the representative estimation domains. During the variogram analysis, geological interpretation and modelling identified two distinct structural trends: northeast (NE) dipping trend and southwest (SW) dipping trend.
To properly capture spatial continuity within these orientations, the domains containing the highest number of samples were selected for detailed study. Domain 103 for the SW trend and Domain 238 for the NE trend. Variography has been applied using Snowden’s Supervisor for those domains and experimental variogram models were produced for these domains.
Density measurements from 10,224 samples covering each of the lithologies, were averaged based on the material type (and lithology, in the case of fresh material). Average density values were applied to the associated portions of the block model as outlined below:
- Laterite 1.98 g/cm3
- Saprolite: 1.91 g/cm3
- Saprock: 2.38 g/cm3
- Fresh: 2.77 g/cm3
Gold grades were estimated in Geovia’s Surpac using Inverse Distance Squared (‘IDW2’) and Ordinary Kriging ('OK’). The grade was estimated in multiple passes to define the higher confidence areas and extend the grade to the interpreted mineralised zone extents.
The grade estimation was validated with visual and statistical analysis, and comparison with the drilling data on sections with swath plots comparing the block grades with the composites.
The majority of the resource is within the fresh rock, approximately 1.0% of the ounces is oxide, 11.0% is transition and 88.0% is fresh rock.
Mineral resources are reported within an optimised pit shell using a cut-off grade of 0.40 g/t Au and a gold price of
- Mining cost:
$3.75 /t ore and$2.72 /t waste - Processing cost: Oxide/Transitional:
$11.08 /t ore; Fresh:$11.66 /t ore - G&A cost:
$4.68 /t ore - Sustaining capital cost:
$1.45 /t ore - Other ore related costs (including grade control):
$0.78 /t ore - Selling cost:
$71.50 /oz Au - Mining recovery: 95.0%; Dilution 0.0%
- Processing recovery: 95.7% for Oxide/transitional ore and 93.1% for fresh ore at the average grade
- Average slope angles: 28-43°, dependent on geotechnical domain
Drilling, Assay, Quality Assurance and Quality Control Procedures
Reverse Circulation (“RC”) and Air Core (“AC”) drilling uses high pressure compressed air to deliver rock materials to the surface. The compressed air is delivered via a dual tube drill rod system, with an outer tube for air going down-hole, and an inner-tube for return going back to surface. In RC drilling, compressed air drives a percussion hammer. In both RC and AC drilling, compressed air carries rock particles back to surface via the inner tube, minimizing potential contamination affects.
The samples are collected from the cyclone at surface at 1 metre intervals. The cyclone is cleaned after every 6-metre rod by flushing the hole and physical opening of the cyclone and blowing out with compressed air at the end of each hole. Additional manual cleaning is required in saprolitic or wet ground, closely monitored by the site geologist / geo-technician to ensure no sample-to-sample contamination occurs. Samples are manually split at the drill site using two different riffle splitters, based on bulk sample weight. 2 to 5 kilograms laboratory samples and a second 2 to 5 kilograms reference sample are collected. Bulk and laboratory sample weights, in addition to moisture levels are recorded. Representative samples for each interval were collected with a spear, sieved into chip trays and retained for reference.
Diamond drilling collects drill core (PQ, HQ and NQ size) samples that are selected by
Blanks, field duplicates and certified reference material (“CRM’s”) are inserted into the sample sequence by
In 2021 and 2022, 1,757 samples were sent to ALS Ouagadougou for umpire (referee) analysis. For 2023, 6,999 samples were sent for umpire testing at ALS Ouagadougou for preparation and analysis. When the original results for all umpire samples from BV are compared to ALS, for 2021 and 2022 the correlation coefficient is 95.9%. For 2023, the correlation coefficient is 87.7%. Correlation measures the relationship between the two values. The closer a value is to 100%, represents increased correlation. The absolute percent difference between the calculated means for the datasets is 3.15% for 2021 and 2022 and 2.7% for 2023. There is good correlation between the original results and those from the umpire laboratory. Core sampling and assay data were monitored through a quality assurance/quality control program designed to follow NI 43-101 and industry best practice.
Assafou Mineral Reserve Estimate
The Mineral Reserve Estimate (as at
The open pit is designed with three phases, an interim stage, a final phase, and a southern extension. The life-of-mine plan for the Project includes modification to the Resource model to generate the mining block through re-blocking, which introduces a degree of dilution, the pre-mining topographic surface and the
A marginal gold cut-off grade of 0.40 g/t was used in the calculation of the open pit quantities for the production schedule and the mineral reserve estimate. The economic cut-off grade is calculated based on the processing cost parameters including cost of; grade control and run-of-mine re-handling; ore premium; processing the ore, plant/infrastructure maintenance, general and administration charges, and sustaining capital costs. Mineral reserve cut-off grades are 0.40 g/t Au for Laterite/, Saprolite/ and Saprock, and 0.50 g/t Au for Fresh rock.
The mineral reserve is reported from an engineered pit design, as a scheduled mining and processing estimate, that includes stockpiling. The scheduled mineral reserve is reported based on aggregating all Measured and Indicated mineral resource blocks incorporated within the life-of-mine plan, and reported inclusive of all appropriate dilution, diluted grade and losses; and all inferred material treated as waste.
QUALIFIED PERSONS
CONTACT INFORMATION
Vice President, Investor Relations +44 203 011 2723 jack.garman@endeavourmining.com | +44 207 404 5959 ccable@brunswickgroup.com |
ABOUT
A member of the
For more information, please visit www.endeavourmining.com.
CAUTIONARY NOTE REGARDING FORWARD-LOOKING INFORMATION
This news release contains "forward-looking statements" within the meaning of applicable securities laws. All statements, other than statements of historical fact, are "forward-looking statements". Generally, these forward-looking statements can be identified by the use of forward-looking terminology such as "expects", "expected", "budgeted", "forecasts", and "anticipates".
Forward-looking statements, while based on management's reasonable estimates, projections and assumptions at the date the statements are made, are subject to risks and uncertainties that may cause actual results to be materially different from those expressed or implied by such forward-looking statements, including but not limited to: risks related to international operations; risks related to general economic conditions and the impact of credit availability on the timing of cash flows and the values of assets and liabilities based on projected future cash flows; Endeavour’s financial results, cash flows and future prospects being consistent with
ESG-related disclosures are inherently subject to measurement uncertainties and methodological limitations. Certain ESG metrics, including greenhouse gas emissions, climate scenario analysis, biodiversity impacts and supply chain data, are based on evolving standards, estimates, assumptions and third-party information, and may not have the same degree of accuracy, comparability or assurance as financial information prepared in accordance with IFRS. As ESG reporting frameworks and regulatory requirements in the
Although
Attachments
- 260423 - NR - Assafou DFS
- 260423 - Financial Model - Assafou DFS
- 260423 - Drill Results - Assafou project