All of the amounts disclosed in this press release are in
| The entire suite of the Company’s 4Q25 financial results can be found on our IR website at https://enlightenergy.co.il/data/financial-reports/ |
Financial Highlights
12 months ending
- Revenues and income of
$582m , up 46% year over year - Net income of
$161m , up 142% year over year - Adjusted EBITDA1 of
$438m , up 51% year over year - Cash flow from Operating activities2 of
$283m , up 11% year over year
3 months ending
- Revenues and income of
$152m , up 46% year over year - Net income of
$21m , up 153% year over year - Adjusted EBITDA of
$99m , up 51% year over year - Cash flow from Operating activities of
$75m , up 38% year over year
1 Adjusted EBITDA is a non-IFRS measure. Please refer to the reconciliation table in Appendix 2. The Company is unable to provide a reconciliation of Adjusted EBITDA to Net Income on a forward-looking basis without unreasonable effort because items that impact this IFRS financial measure are not within the Company’s control and/or cannot be reasonably predicted.
2 Interest payments and receipts are classified as cash flows from financing and investing activities, respectively, rather than as cash flows from operating activities. Adjustments were made for the years 2023–2025 following a change in accounting policy; for further details, see Appendix 4 in the Earning release
Summary of key financial results for 4Q25 and 2025
| For the three months ended | For the twelve months ended | |||||
| ($ millions) | 2025 | 2024 | % change | 2025 | 2024 | % change |
| Revenues and Income | 152 | 104 | 46% | 582 | 399 | 46% |
| Net Income | 21 | 8 | 153% | 161 | 66 | 142% |
| Adjusted EBITDA | 99 | 65 | 51% | 438 | 289 | 51% |
| Cash Flow from Operating Activities | 75 | 54 | 38% | 283 | 255 | 11% |
2026 guidance
Financial guidance
- Total revenues and income3 are expected to range between
$755m and$785m , a 32% increase (at the midpoint) from 2025. Adjusted EBITDA is expected to range between$545m and$565m , a 27% increase (at the midpoint) from 2025.
Key assumptions underlying the forecast:
- Approximately 90% of the electricity volumes expected to be generated in 2026 will be sold at fixed prices through PPAs or hedges.
- Exchange rates are based on 2026 forward curves.
- Of the projected revenues and income, 39% are expected to be denominated in USD, 34% in ILS, and 27% in EUR.
Construction and commissioning
- Expected commissioning of 1.1 FGW4, added to the current operational component of the portfolio (3.9 FGW), representing approximately
$137m of annualized revenues and income and$107m of annualized adjusted EBITDA. - In addition, the company estimates that during 2026 it will begin construction of projects totaling 3 to 4 FGW, leading to a total capacity under construction of 6.5 to 7.5 FGW.
- The operating and under construction components of the portfolio are expected to total 10.4 to 11.4 FGW by the end of 2026, representing annualized revenues (year-end 2028) of
$1.8 to$2 billion in full operation.
3 Total revenues and income include revenues from the sale of electricity along with income from tax benefits from US projects amounting to
4 FGW (Factored GW) is the company’s consolidated metric combining generation and storage capacity into a uniform figure based on the ratio of construction costs. Current weighted average construction cost ratio is 3.5 GWh of storage per 1 GW of generation: FGW = GW + GWh / 3.5.
Portfolio Review
This quarter Enlight continued to expand its portfolio and advance projects through the various phases of development. As of the earning release date, Enlight’s total portfolio is comprised of 20.6 GW of generation capacity and 61 GWh energy storage (totaling 38 FGW), an increase of 26% from the total portfolio of 30.2 FGW at the end of 2024. Of this, the mature component of the portfolio (including operating projects, projects under construction or in pre-construction) contains 6.4 GW generation capacity and 17.5 GWh of storage (11.4 FGW in total), an increase of 33% from the mature component of 8.6 FGW at the end of 2024. Enlight’s mature storage component, a primary growth engine for the company, has surged by 105% over the past 12 months.
The growth of the mature component stems primarily from the completion of development for the CO Bar complex, a mega-project and one of the largest in the US. Located in
- Enlight has completed the final development milestones for the project, including the signing of a 1 GW grid connection agreement and a long-term availability Energy Storage Agreement (ESA) for Phases 4 and 5, which have a combined storage capacity of approximately 3.2 GWh (approximately 0.9 FGW). Following the achievement of these milestones, Phases 4 and 5 transitioned from the advanced development pipeline to the pre-construction pipeline, joining Phases 1 through 3 in the mature component of our portfolio. CODs are expected during the second half of 2027 and the first half of 2028.
- The total expected investment in the complex is estimated at
$2,860 -$3,010 million , and$1 ,550–$1,630 million net of tax benefits. In its first full year of operation, the complex is expected to generate an EBITDA of approximately$209 -$219 million , with an unlevered project yield ranging from 13.1% to 13.5%. This yield demonstrates Enlight’s "Connect and Expand" strategy, which focuses on optimizing existing grid connection infrastructure and maximizing project returns.
As of the earnings release date, Enlight has met Safe Harbor requirements, securing eligibility for US tax benefits for a total capacity of 13.2 FGW. Of this total, 4.3 FGW secured Safe Harbor status within the last three months. This capacity encompasses the entire mature component of the
The composition of Enlight’s portfolio appears in the following table:
| Component | Status | FGW | Annual revenues & income run rate5($m) | ||
| Operating | Commercial operation | 3.9 | ~750-770 | ||
| Under construction | Under construction | 3.5 | ~700 | ||
| Pre-construction | 0-12 months to start of construction | 4.0 | ~600 | ||
| Total Mature Portfolio | Mature | 11.4 | |||
| Advanced development | 13-24 months to start of construction | 6.4 | N/A | ||
| Development | 2+ years to start of construction | 21.3 | N/A | ||
| Total Portfolio | 38.0 | N/A | |||
5 As of
- Operating component of the portfolio: 3.9 FGW
- In the last twelve months, Enlight’s operating component expanded by 29%, primarily due to the commercial operation of
Quail Ranch and Roadrunner (with aggregated capacity of 0.8 FGW) in the fourth quarter of 2025, doubling the operational portfolio in theU.S. - Operating portfolio generates annualized revenues and income run rate of approximately
$760m .
- In the last twelve months, Enlight’s operating component expanded by 29%, primarily due to the commercial operation of
- Under construction component of the portfolio: 3.5 FGW
- During the last 12 months construction has commenced in projects with capacity totaling 2.6 FGW.
- The under-construction component includes four major projects in the
U.S. with a total capacity of 2.9 FGW, all benefit from long-term Busbar PPA agreements.
The following projects in the
-
-
- Phases 1 and 2 in the CO Bar complex, totaling approximately 1 FGW advanced to under-construction.
- Crimson Orchard in
Idaho ,U.S. , with solar generation capacity of 120 MW and storage capacity of 400 MWh (approximately 230 FMW). - Another project that advanced to under-construction during 2025 is Snowflake A in
Arizona ,U.S. , with solar generation capacity of 594 MW and storage capacity of 1,900 MWh (approximately 1.1 FGW). The project is expected to become operational in the second half of 2027. This is the first phase of the Snowflake complex and its larger second phase is in the advanced development component. Both phases have a joint grid connection of 1 GW. Snowflake is an example of Enlight’s Connect and Expand strategy, which drives lower risk and maximizes returns.
-
-
- Under construction projects are expected to contribute
~$700m to annual revenues and income run rate during their first full year of operation.
- Under construction projects are expected to contribute
- Pre-construction component of the portfolio: 4 FGW
- During the past 12 months projects with a capacity amounting to more than 2.5 FGW advanced to pre-construction.
- Notable additions during the quarter:
-
-
- Phases 4 and 5 of the CO Bar complex with storage capacity of 3.2 GWh (approximately 0.9 FGW) progressed from advanced development to pre-construction.
-
-
- An agreement was signed for the acquisition of 51% from the Jupiter project in
Germany (with an option to increase ownership to 60%), with an energy storage capacity of 2,000 MWh and solar generation of 150 MW (a total of 720 FMW). The project has secured grid connection of 500 MW. The total investment in the project is expected to amount to$559 -$587 million and the first year EBITDA is expected to amount to$82 - 87 million, reflecting an unlevered return of approximately 15%. The acquisition expands Enlight’s footprint inGermany , one of the world’s most attractive renewable energy markets. - Additional projects that were added to pre-construction in the past 12 months:
- An agreement was signed for the acquisition of 51% from the Jupiter project in
-
-
- Bertikow, an 860 MWh (246 FMW) stand-alone storage project acquired in
Germany , marking Enlight’s first project in the country. Nardo Solar inItaly with Solar generation capacity of 100 MW. The project also includes storage capacity of 872 MWh (approximately 250 FMW) in pre-construction.- Edison, a 208 MWh (59 FMW) stand-alone storage project acquired in
Poland . - 1,350 MWh (386 FMW) high-voltage storage projects in Israel.
- Bertikow, an 860 MWh (246 FMW) stand-alone storage project acquired in
- Pre-construction projects are expected to contribute
~$600m to the annual revenues and income run rate during their first full year of operation.
-
With the completion of the current Mature portfolio by year-end 2028, Enlight’s operating capacity is expected to rise to 12-13 FGW and to generate an annualized revenues and income run rate of
- Advanced development component of the portfolio component: 6.4 FGW
- 4.6 FGW in the
U.S. , of which 2 FGW in follow-on projects as part of Enlight’s Connect and Expand strategy: Snowflake B (1.3 FGW) and Atrisco 2 (0.7 FGW). - 89% of the capacity has met Safe Harbor requirements, securing eligibility for US tax benefits.
- 89% of the capacity have completed the System Impact Study, the key milestone in securing grid interconnection.
- The advanced development portfolio also includes 1 FGW in
Europe and 0.8 FGW in MENA.
- 4.6 FGW in the
- Development component of the portfolio: 20.2 FGW
- 13.8 FGW in the
U.S. with broad geographic presence, including the WECC, PJM, SPP and MISO regions. 53% and 19% of the capacity completed the System Impact Study and has achieved Safe Harbor, respectively. - The development portfolio also includes 2.7 FGW in
Europe and 3.7 FGW in MENA.
- 13.8 FGW in the
Roadmap to Revenues and Income Run-Rate of
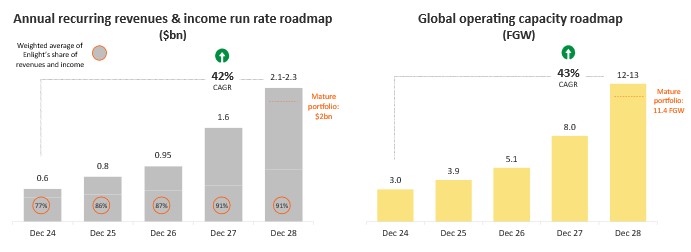
6 Expected Adjusted EBITDA margin of approximately 70%-80% (including tax benefits) for the years shown. FGW (Factored GW) is a consolidated metric combining generation and storage capacity into a uniform figure based on the ratio of construction costs. The company’s current weighted average construction cost ratio is 3.5 GWh of storage per 1 GW of generation: FGW = GW + GWh / 3.5. The expected growth in 2028 encompasses the Company’s operations in all geographies. Expected growth relies on business plans which rely on development conditions and assumptions regarding electricity prices, and are contingent on current trends known to the Company at this time; The company's revenues from tax benefits are estimated at approximately 19-23% of the total revenues & income run rate for
Project and Corporate Finance
- During 2025, the Company secured project finance from multiple sources:
- Financial close totaling approximately
$1.4bn of loans for the Snowflake A project (1.1 FGW). - Tax equity financing for the Roadrunner and
Quail Ranch projects (0.8 FGW combined) totaling approximately$470m . - Completion of a
$350m mezzanine loan with competitive margins of 2.7% - 3.2% above SOFR and flexible drawdown and repayment terms, supporting the development and operational needs of projects now under construction in theU.S. - Raising approximately
$300m in share equity through a private placement to Israeli institutional investors and$245 million in debentures in the Tel Aviv Stock Exchange. - The sale of 44% of the Sunlight cluster generated cash flow of
$50 million .
- Financial close totaling approximately
- Cash and cash equivalents at the “topco” level7 were
$217m as at the balance sheet date. - As of the balance sheet date, the Company maintained
$525m of credit facilities, of which$162m has been drawn. In addition, of approximately$1.5bn of LC and surety bond facilities,$713m was drawn at end of the quarter.
7 Including Enlight Renewable Energy, headquarter companies in
Financial Results Analysis
| Revenues & Income by Segment | ||||||
| ($ millions) | For the three months ended | For the twelve months ended | ||||
| Segment | % change | % change | ||||
| MENA | 49 | 34 | 44% | 222 | 156 | 43% |
| 55 | 50 | 10% | 200 | 197 | 1% | |
| 48 | 18 | 167% | 159 | 37 | 333% | |
| Other | 0 | 2 | (100%) | 1 | 9 | (84%) |
| Total Revenues & Income | 152 | 104 | 46% | 582 | 399 | 46% |
Revenues & Income
In the fourth quarter of 2025, the Company’s total revenues and income increased to
Most of the increase is attributed to newly operational projects. In the past 12 months 452 MW and 1,535 MWh of new projects were connected to the grid and began selling electricity. An addition of
Net Income
In the fourth quarter of 2025, the Company reported a net income of
Adjusted EBITDA8
The Company’s Adjusted EBITDA grew by 51% to
8 The Company is unable to provide a reconciliation of Adjusted EBITDA to Net Income on a forward-looking basis without unreasonable effort because items that impact this IFRS financial measure are not within the Company’s control and/or cannot be reasonably predicted. Please refer to the reconciliation table in Appendix 2.
Conference Call Information
Enlight plans to hold its Fourth Quarter 2025 Conference Call and Webcasts on
English Conference Call at
Please pre-register to join the live conference call:
https://register-conf.media-server.com/register/BI71bd607581334a0d815bc9804aaa1271
English Webcast at
Please register and join by webcast at the following link:
https://edge.media-server.com/mmc/p/airnx7q2
Hebrew Webcast at
Please join the webcast at the following link:
https://enlightenergy-co-il.zoom.us/webinar/register/WN_0dDsbEwLSI2oMCd27K8MSQ
The press release with the financial results as well as the investor presentation materials will be accessible from the Company’s website prior to the conference call. An archived version of the webcast will be available on the Company’s investor relations website at https://enlightenergy.co.il/info/investors/.
Supplemental Financial and Other Information
We intend to announce material information to the public through the Enlight investor relations website at https://enlightenergy.co.il/info/investors,
Non-IFRS Financial Measures
This release presents Adjusted EBITDA, a financial metric, which is provided as a complement to the results provided in accordance with the International Financial Reporting Standards as issued by the
We define Adjusted EBITDA as net income (loss) plus depreciation and amortization, share based compensation, finance expenses, taxes on income and share in losses of equity accounted investees and minus finance income and non-recurring portions of other income, net. For the purposes of calculating Adjusted EBITDA, compensation for inadequate performance of goods and services procured by the Company are included in other income, net. Compensation for inadequate performance of goods and services reflects the profits the Company would have generated under regular operating conditions and is therefore included in Adjusted EBITDA. With respect to gains (losses) from asset disposals, as part of Enlight’s strategy to accelerate growth and reduce the need for equity financing, the Company sells parts of or the entirety of selected renewable project assets from time to time, and therefore includes realized gains or losses from these asset disposals in Adjusted EBITDA. In the case of partial assets disposals, Adjusted EBITDA includes only the actual consideration less the book value of the assets sold. Our management believes Adjusted EBITDA is indicative of operational performance and ongoing profitability and uses Adjusted EBITDA to evaluate the operating performance and for planning and forecasting purposes.
Non-IFRS financial measures have limitations as analytical tools and should not be considered in isolation or as substitutes for financial information presented under IFRS. There are a number of limitations related to the use of non-IFRS financial measures versus comparable financial measures determined under IFRS. For example, other companies in our industry may calculate the non-IFRS financial measures that we use differently or may use other measures to evaluate their performance. All of these limitations could reduce the usefulness of our non-IFRS financial measures as analytical tools. Investors are encouraged to review the related IFRS financial measure, Net Income, and the reconciliations of Adjusted EBITDA provided below to Net Income and to not rely on any single financial measure to evaluate our business.
Special Note Regarding Forward-Looking Statements
This press release contains forward-looking statements within the meaning of the
These statements are neither promises nor guarantees, but involve known and unknown risks, uncertainties and other important factors that may cause our actual results, performance or achievements to be materially different from any future results, performance or achievements expressed or implied by the forward-looking statements, including, but not limited to, the following: our ability to site suitable land for, and otherwise source, renewable energy projects and to successfully develop and convert them into Operational Projects; availability of, and access to, interconnection facilities and transmission systems; our ability to obtain and maintain governmental and other regulatory approvals and permits, including environmental approvals and permits; construction delays, operational delays and supply chain disruptions leading to increased cost of materials required for the construction of our projects, as well as cost overruns and delays related to disputes with contractors; disruptions in trade caused by political, social or economic instability in regions where our components and materials are made; our suppliers’ ability and willingness to perform both existing and future obligations; competition from traditional and renewable energy companies in developing renewable energy projects; potential slowed demand for renewable energy projects and our ability to enter into new offtake contracts on acceptable terms and prices as current offtake contracts expire; offtakers’ ability to terminate contracts or seek other remedies resulting from failure of our projects to meet development, operational or performance benchmarks; exposure to market prices in some of our offtake contracts; various technical and operational challenges leading to unplanned outages, reduced output, interconnection or termination issues; the dependence of our production and revenue on suitable meteorological and environmental conditions, and our ability to accurately predict such conditions; our ability to enforce warranties provided by our counterparties in the event that our projects do not perform as expected; government curtailment, energy price caps and other government actions that restrict or reduce the profitability of renewable energy production; electricity price volatility, unusual weather conditions (including the effects of climate change, could adversely affect wind and solar conditions), catastrophic weather-related or other damage to facilities, unscheduled generation outages, maintenance or repairs, unanticipated changes to availability due to higher demand, shortages, transportation problems or other developments, environmental incidents, or electric transmission system constraints and the possibility that we may not have adequate insurance to cover losses as a result of such hazards; our dependence on certain operational projects for a substantial portion of our cash flows; our ability to continue to grow our portfolio of projects through successful acquisitions; changes and advances in technology that impair or eliminate the competitive advantage of our projects or upsets the expectations underlying investments in our technologies; our ability to effectively anticipate and manage cost inflation, interest rate risk, currency exchange fluctuations and other macroeconomic conditions that impact our business; our ability to retain and attract key personnel; our ability to manage legal and regulatory compliance and litigation risk across our global corporate structure; our ability to protect our business from, and manage the impact of, cyber-attacks, disruptions and security incidents, as well as acts of terrorism or war; changes to existing renewable energy industry policies and regulations that present technical, regulatory and economic barriers to renewable energy projects; the reduction, elimination or expiration of government incentives or benefits for, or regulations mandating the use of, renewable energy; our ability to effectively manage the global expansion of the scale of our business operations; our ability to perform to expectations in our new line of business involving the construction of PV systems for municipalities in
These statements reflect management’s current expectations regarding future events and operating performance and speak only as of the date of this press release. You should not put undue reliance on any forward-looking statements. Although we believe that the expectations reflected in the forward-looking statements are reasonable, we cannot guarantee that future results, levels of activity, performance and events and circumstances reflected in the forward-looking statements will be achieved or will occur. Except as required by applicable law, we undertake no obligation to update or revise publicly any forward-looking statements, whether as a result of new information, future events or otherwise, after the date on which the statements are made or to reflect the occurrence of unanticipated events.
About Enlight
Founded in 2008, Enlight develops, finances, constructs, owns, and operates utility-scale renewable energy projects. Enlight operates across the three largest renewable segments today: solar, wind and energy storage. A global platform, Enlight operates in
Company Contacts
Director IR
investors@enlightenergy.co.il
Sapphire Investor Relations, LLC
+1 617 542 6180
investors@enlightenergy.co.il
Appendix 1 – Financial information
Consolidated Statements of Income
| For the year ended | For the three months ended | ||||||||
| 2025 | 2024 | 2025 | 2024 | ||||||
| USD in | USD in | USD in | USD in | ||||||
| Thousands | thousands | thousands | thousands | ||||||
| Revenues | 488,596 | 377,935 | 124,185 | 93,345 | |||||
| Tax benefits | 93,668 | 20,860 | 28,175 | 10,758 | |||||
| Total revenues and income | 582,264 | 398,795 | 152,360 | 104,103 | |||||
| Cost of sales (*) | (134,381) | (80,696) | (38,542) | (26,120) | |||||
| Depreciation and amortization | (149,922) | (108,889) | (39,763) | (30,912) | |||||
| General and administrative expenses | (57,955) | (38,847) | (18,987) | (12,693) | |||||
| Development expenses | (12,190) | (11,601) | (3,817) | (3,709) | |||||
| Total operating expenses | (354,448) | (240,033) | (101,109) | (73,434) | |||||
| Gains from projects disposals | 96,431 | 611 | - | - | |||||
| Other income, net | 7,931 | 16,162 | 2,146 | 1,305 | |||||
| Operating profit | 332,178 | 175,535 | 53,397 | 31,974 | |||||
| Finance income | 40,851 | 20,439 | 4,559 | 2,140 | |||||
| Finance expenses | (164,730) | (107,844) | (28,273) | (22,008) | |||||
| Total finance expenses, net | (123,879) | (87,405) | (23,714) | (19,868) | |||||
| Profit before tax and equity loss | 208,299 | 88,130 | 29,683 | 12,106 | |||||
| Share of profit (loss) of equity accounted investees | (3,722) | (3,350) | 182 | (1,613) | |||||
| Profit before income taxes | 204,577 | 84,780 | 29,865 | 10,493 | |||||
| Taxes on income | (43,875) | (18,275) | (8,792) | (2,121) | |||||
| Profit for the period | 160,702 | 66,505 | 21,073 | 8,372 | |||||
| Profit for the period attributed to: | |||||||||
| Owners of the Company | 132,104 | 44,209 | 14,263 | 5,156 | |||||
| Non-controlling interests | 28,598 | 22,296 | 6,810 | 3,216 | |||||
| 160,702 | 66,505 | 21,073 | 8,372 | ||||||
| Earnings per ordinary share (in USD) with a par | |||||||||
| value of | |||||||||
| parent Company: | |||||||||
| Basic earnings per share | 1.07 | 0.37 | 0.11 | 0.04 | |||||
| Diluted earnings per share | 1.00 | 0.36 | 0.10 | 0.04 | |||||
| Weighted average of share capital used in the | |||||||||
| calculation of earnings: | |||||||||
| Basic per share | 123,717,373 | 118,293,556 | 131,912,631 | 118,496,434 | |||||
| Diluted per share | 132,619,069 | 123,312,565 | 142,375,410 | 123,403,415 | |||||
(*) Excluding depreciation and amortization.
| Consolidated Statements of Financial Position as of | |||||
| 2025 | 2024 | ||||
| USD in | USD in | ||||
| Thousands | Thousands | ||||
| Assets | |||||
| Current assets | |||||
| Cash and cash equivalents | 528,497 | 387,427 | |||
| Restricted cash | 409,424 | 87,539 | |||
| Trade receivables | 95,118 | 50,692 | |||
| Other receivables | 62,286 | 99,651 | |||
| Other financial assets | 524 | 975 | |||
| Assets of disposal groups classified as held for sale | - | 81,661 | |||
| Total current assets | 1,095,849 | 707,945 | |||
| Non-current assets | |||||
| Restricted cash | 130,358 | 60,802 | |||
| Other long-term receivables | 64,349 | 61,045 | |||
| Deferred costs in respect of projects | 235,615 | 357,358 | |||
| Deferred borrowing costs | 1,749 | 276 | |||
| Loans to investee entities | 85,131 | 18,112 | |||
| Investments in equity accounted investees | 59,310 | - | |||
| Fixed assets, net | 6,281,418 | 3,699,192 | |||
| Intangible assets, net | 303,971 | 291,442 | |||
| Deferred taxes assets | 4,692 | 10,744 | |||
| Right-of-use asset, net | 225,495 | 210,941 | |||
| Financial assets at fair value through profit or loss | 83,582 | 69,216 | |||
| Other financial assets | 58,383 | 59,812 | |||
| Total non-current assets | 7,534,053 | 4,838,940 | |||
| Total assets | 8,629,902 | 5,546,885 | |||
| Consolidated Statements of Financial Position as of (Cont.) | |||||
| 2025 | 2024 | ||||
| USD in | USD in | ||||
| Thousands | Thousands | ||||
| Liabilities and equity | |||||
| Current liabilities | |||||
| Credit and current maturities of loans from | |||||
| banks and other financial institutions | 884,120 | 212,246 | |||
| Trade payables | 137,230 | 161,991 | |||
| Other payables | 405,741 | 107,825 | |||
| Current maturities of debentures | 173,571 | 44,962 | |||
| Current maturities of lease liability | 12,396 | 10,240 | |||
| Other financial liabilities | 16,147 | 8,141 | |||
| Liabilities of disposal groups classified as held for sale | - | 46,635 | |||
| Total current liabilities | 1,629,205 | 592,040 | |||
| Non-current liabilities | |||||
| Debentures | 477,315 | 433,994 | |||
| Other financial liabilities | 378,303 | 107,865 | |||
| Convertible debentures | 273,801 | 133,056 | |||
| Loans from banks and other financial institutions | 2,981,786 | 1,996,137 | |||
| Loans from non-controlling interests | 86,946 | 75,598 | |||
| Financial liabilities through profit or loss | 26,946 | 25,844 | |||
| Deferred taxes liabilities | 77,688 | 41,792 | |||
| Employee benefits | 1,645 | 1,215 | |||
| Lease liability | 231,135 | 211,941 | |||
| Deferred income related to tax equity | 370,734 | 403,384 | |||
| Asset retirement obligation | 99,460 | 83,085 | |||
| Total non-current liabilities | 5,005,759 | 3,513,911 | |||
| Total liabilities | 6,634,964 | 4,105,951 | |||
| Equity | |||||
| Ordinary share capital | 3,711 | 3,308 | |||
| Share premium | 1,319,716 | 1,028,532 | |||
| Capital reserves | 99,311 | 25,273 | |||
| Proceeds on account of convertible options | 25,380 | 15,494 | |||
| Accumulated profit | 240,023 | 107,919 | |||
| Equity attributable to shareholders of the Company | 1,688,141 | 1,180,526 | |||
| Non-controlling interests | 306,797 | 260,408 | |||
| Total equity | 1,994,938 | 1,440,934 | |||
| Total liabilities and equity | 8,629,902 | 5,546,885 |
| Consolidated Statements of Cash Flows | ||||||||
| For the year ended | For the three months ended | |||||||
| 2025 | 2024 | 2025 | 2024 | |||||
| USD in | USD in | USD in | USD in | |||||
| Thousands | Thousands | Thousands | Thousands | |||||
| Cash flows for operating activities | ||||||||
| Profit for the period | 160,702 | 66,505 | 21,073 | 8,372 | ||||
| Income and expenses not associated with cash flows: | ||||||||
| Depreciation and amortization | 149,922 | 108,889 | 39,763 | 30,912 | ||||
| Finance expenses, net | 118,680 | 83,560 | 22,886 | 18,378 | ||||
| Share-based compensation | 10,470 | 8,360 | 5,423 | 2,333 | ||||
| Taxes on income | 43,875 | 18,275 | 8,792 | 2,121 | ||||
| Tax benefits | (89,437) | (20,860) | (27,378) | (10,758) | ||||
| Other income, net | 4,922 | (4,352) | 10,707 | (1,239) | ||||
| Company’s share in losses (profits) of investee partnerships | 3,722 | 3,350 | (182) | 1,613 | ||||
| Gains from projects disposals | (96,431) | (611) | - | - | ||||
| 145,723 | 196,611 | 60,011 | 43,360 | |||||
| Changes in assets and liabilities items: | ||||||||
| Change in other receivables | (1,866) | 12,261 | 934 | 5,714 | ||||
| Change in trade receivables | (27,366) | (9,892) | (1) | (296) | ||||
| Change in other payables | 14,546 | 294 | (13,859) | 321 | ||||
| Change in trade payables | 5,179 | 746 | 10,597 | 1,687 | ||||
| (9,507) | 3,409 | (2,329) | 7,426 | |||||
| Income Tax paid | (14,270) | (11,246) | (4,177) | (5,162) | ||||
| Net cash from operating activities | 282,648 | 255,279 | 74,578 | 53,996 | ||||
| Cash flows for investing activities | ||||||||
| Sale (Acquisition) of consolidated entities, net | 34,295 | 1,871 | (3,537) | 3,720 | ||||
| Changes in restricted cash and bank deposits, net | (378,648) | 29,959 | (180,478) | 74,234 | ||||
| Purchase, development, and construction in respect of projects | (1,812,570) | (899,257) | (648,901) | (220,288) | ||||
| Interest receipts | 14,795 | 12,684 | 4,874 | 4,879 | ||||
| Loans provided and Investment in investees | (56,255) | (26,531) | (12,991) | (11,330) | ||||
| Repayment of loans to investees | 30,815 | 87 | - | 24 | ||||
| Loans provided to non-controlling interests | (297) | - | - | - | ||||
| Payments on account of acquisition of consolidated company | (6,543) | (32,777) | 904 | (17,080) | ||||
| Purchase of long-term financial assets measured at fair value through profit or loss, net | (6,475) | (14,719) | (1,218) | (2,515) | ||||
| Net cash used in investing activities | (2,180,883) | (928,683) | (841,347) | (168,356) | ||||
| Consolidated Statements of Cash Flows (Cont.) | ||||||||
| For the year ended | For the three months ended | |||||||
| 2025 | 2024 | 2025 | 2024 | |||||
| USD in | USD in | USD in | USD in | |||||
| Thousands | Thousands | Thousands | Thousands | |||||
| Cash flows from financing activities | ||||||||
| Receipt of loans from banks and other financial institutions | 1,783,974 | 939,627 | 459,450 | 271,770 | ||||
| Repayment of loans from banks and other financial institutions | (505,360) | (699,584) | (98,121) | (439,614) | ||||
| Interest paid | (86,860) | (74,891) | (31,327) | (23,343) | ||||
| Issuance of debentures | 125,838 | 177,914 | - | 177,914 | ||||
| Issuance of convertible debentures | 114,685 | - | - | - | ||||
| Repayment of debentures | (47,545) | (26,016) | - | - | ||||
| Dividends and distributions by subsidiaries to non-controlling interests | (29,805) | (25,536) | (12,479) | (1,641) | ||||
| Proceeds from investments by tax-equity investors | 440,484 | 410,845 | 312,789 | 366,520 | ||||
| Repayment of tax-equity investment | (13,609) | (839) | (2,019) | (839) | ||||
| Deferred borrowing costs | (68,225) | (21,639) | (21,149) | (15,771) | ||||
| Receipt of loans from non-controlling interests | 182 | - | - | - | ||||
| Repayment of loans from non-controlling interests | (858) | (2,960) | - | (943) | ||||
| Increase in holding rights of consolidated entity | (1,392) | (167) | - | - | ||||
| Issuance of shares | 290,698 | - | - | - | ||||
| Exercise of share options | 53 | 15 | 8 | 1 | ||||
| Repayment of lease liability | (8,580) | (5,852) | (581) | (1,139) | ||||
| Proceeds from investment in entities by non-controlling interest | 12,799 | 179 | - | - | ||||
| Net cash from financing activities | 2,006,479 | 671,096 | 606,571 | 332,915 | ||||
| Increase (Decrease) in cash and cash equivalents | 108,244 | (2,308) | (160,198) | 218,555 | ||||
| Balance of cash and cash equivalents at beginning of period | 387,427 | 403,805 | 679,827 | 208,791 | ||||
| Changes in cash of disposal groups classified as held for sale | - | (5,753) | - | (5,753) | ||||
| Effect of exchange rate fluctuations on cash and cash equivalents | 32,826 | (8,317) | 8,868 | (3,545) | ||||
| Cash and cash equivalents at end of period | 528,497 | 387,427 | 528,497 | 178,170 | ||||
Information related to Segmental Reporting
| For the year ended | ||||||||||||
| MENA | Total reportable segments | Others | Total | |||||||||
| USD in thousands | ||||||||||||
| Revenues | 222,388 | 199,763 | 64,911 | 487,062 | 1,534 | 488,596 | ||||||
| Tax benefits | - | - | 93,668 | 93,668 | - | 93,668 | ||||||
| Total revenues and income | 222,388 | 199,763 | 158,579 | 580,730 | 1,534 | 582,264 | ||||||
| Segment adjusted EBITDA | 189,304 | 159,015 | 142,567 | 490,886 | 1,034 | 491,920 | ||||||
| Reconciliations of unallocated amounts: | ||||||||||||
| Headquarter costs (*) | (54,135) | |||||||||||
| Intersegment profit | 188 | |||||||||||
| Gains from projects disposals | 54,597 | |||||||||||
| Depreciation and amortization and share-based compensation | (160,392) | |||||||||||
| Operating profit | 332,178 | |||||||||||
| Finance income | 40,851 | |||||||||||
| Finance expenses | (164,730) | |||||||||||
| Share in the losses of equity accounted investees | (3,722) | |||||||||||
| Profit before income taxes | 204,577 | |||||||||||
(*) Including general and administrative and development expenses (excluding depreciation and amortization and share based compensation).
Information related to Segmental Reporting
| For the year ended | ||||||||||||
| MENA | Total reportable segments | Others | Total | |||||||||
| USD in thousands | ||||||||||||
| Revenues | 155,693 | 197,143 | 15,748 | 368,584 | 9,351 | 377,935 | ||||||
| Tax benefits | - | - | 20,860 | 20,860 | - | 20,860 | ||||||
| Total revenues and income | 155,693 | 197,143 | 36,608 | 389,444 | 9,351 | 398,795 | ||||||
| Segment adjusted EBITDA | 123,724 | 165,385 | 33,539 | 322,648 | 4,141 | 326,789 | ||||||
| Reconciliations of unallocated amounts: | ||||||||||||
| Headquarter costs (*) | (37,774) | |||||||||||
| Intersegment profit | 100 | |||||||||||
| Depreciation and amortization and share-based compensation | (117,249) | |||||||||||
| Other incomes not attributed to segments | 3,669 | |||||||||||
| Operating profit | 175,535 | |||||||||||
| Finance income | 20,439 | |||||||||||
| Finance expenses | (107,844) | |||||||||||
| Share in the losses of equity accounted investees | (3,350) | |||||||||||
| Profit before income taxes | 84,780 | |||||||||||
(*) Including general and administrative and development expenses (excluding depreciation and amortization and share based compensation).
Information related to Segmental Reporting
| For the three months ended | ||||||||||||
| MENA | Total reportable segments | Others | Total | |||||||||
| USD in thousands | ||||||||||||
| Revenues | 49,208 | 55,260 | 19,455 | 123,923 | 262 | 124,185 | ||||||
| Tax benefits | - | - | 28,175 | 28,175 | - | 28,175 | ||||||
| Total revenues and income | 49,208 | 55,260 | 47,630 | 152,098 | 262 | 152,360 | ||||||
| Segment adjusted EBITDA | 29,002 | 41,586 | 44,396 | 114,984 | (58) | 114,926 | ||||||
| Reconciliations of unallocated amounts: | ||||||||||||
| Headquarter costs (*) | (16,359) | |||||||||||
| Intersegment profit | 16 | |||||||||||
| Depreciation and amortization and share-based compensation | (45,186) | |||||||||||
| Operating profit | 53,397 | |||||||||||
| Finance income | 4,559 | |||||||||||
| Finance expenses | (28,273) | |||||||||||
| Share in the losses of equity accounted investees | 182 | |||||||||||
| Profit before income taxes | 29,865 | |||||||||||
(*) Including general and administrative and development expenses (excluding depreciation and amortization and share based compensation).
Information related to Segmental Reporting
| For the three months ended | ||||||||||||
| MENA | Total reportable segments | Others | Total | |||||||||
| USD in thousands | ||||||||||||
| Revenues | 34,086 | 49,979 | 7,137 | 91,202 | 2,143 | 93,345 | ||||||
| Tax benefits | - | - | 10,758 | 10,758 | - | 10,758 | ||||||
| Total revenues and income | 34,086 | 49,979 | 17,895 | 101,960 | 2,143 | 104,103 | ||||||
| Segment adjusted EBITDA | 24,065 | 35,999 | 17,574 | 77,638 | 283 | 77,921 | ||||||
| Reconciliations of unallocated amounts: | ||||||||||||
| Headquarter costs (*) | (12,690) | |||||||||||
| Intersegment loss | (12) | |||||||||||
| Depreciation and amortization and share-based compensation | (33,245) | |||||||||||
| Operating profit | 31,974 | |||||||||||
| Finance income | 2,140 | |||||||||||
| Finance expenses | (22,008) | |||||||||||
| Share in the losses of equity accounted investees | (1,613) | |||||||||||
| Profit before income taxes | 10,493 | |||||||||||
(*) Including general and administrative and development expenses (excluding depreciation and amortization and share based compensation).
| Appendix 2 - Reconciliations between Net Income to Adjusted EBITDA | ||||||||||||
| ($ thousands) | For the year ended | For the three months | ||||||||||
| | ended | |||||||||||
| 2025 | 2024 | 2025 | 2024 | |||||||||
| Net Income | 160,702 | 66,505 | 21,073 | 8,372 | ||||||||
| Depreciation and amortization | 149,922 | 108,889 | 39,763 | 30,912 | ||||||||
| Share based compensation | 10,470 | 8,360 | 5,423 | 2,333 | ||||||||
| Finance income | (40,851) | (20,439) | (4,559) | (2,140) | ||||||||
| Finance expenses | 164,730 | 107,844 | 28,273 | 22,008 | ||||||||
| Gains from projects disposals (*) | (54,597) | - | - | - | ||||||||
| Non-recurring other income, net (**) | - | (3,669) | - | - | ||||||||
| Share of losses of equity accounted investees | 3,722 | 3,350 | (182) | 1,613 | ||||||||
| Taxes on income | 43,875 | 18,275 | 8,792 | 2,121 | ||||||||
| Adjusted EBITDA | 437,973 | 289,115 | 98,583 | 65,219 | ||||||||
| * Profit from revaluation linked to partial sale of asset. ** Recognition of income related to lower earn-out payments offset by a revaluation in the value of financial assets. | ||||||||||||
Appendix 3 – Debentures Covenants
Debentures Covenants
As of
Minimum equity
The company's equity shall be maintained at no less than
As of
Net financial debt to net CAP
The ratio of standalone net financial debt to net CAP shall not exceed 70% for two consecutive financial periods so long as debentures F remain outstanding and shall not exceed 65% for two consecutive financial periods so long as debentures C, D,
As of
Net financial debt to EBITDA
So long as debentures F remain outstanding, standalone financial debt shall not exceed
For as long as debentures
For as long as debentures
As of
Equity to balance sheet
The standalone equity to total balance sheet ratio shall be maintained at no less than 20% ,25% and 28%, respectively, for two consecutive financial periods for as long as debentures F, debentures
As of
Appendix 4 – Change in accounting policy
Until
During the fourth quarter of 2025, management elected to change the classification of interest paid, including payments relating to interest rate swap (IRS) instruments to cash flows used in financing activities, and interest received to cash flows from investing activities. Management believes that this change in presentation provides a more comprehensive view of the cost of financing the Company's operations and better reflects management’s view of the financing nature of these transactions.
Accordingly, comparative information has been retrospectively adjusted to reflect this change in accounting policy in the Consolidated Statements of Cash Flows, as presented below:
| ($ thousands) | For the year ended | |||||||||
| As reported | Adjustment | As adjusted | ||||||||
| Net cash from operating activities | 193,072 | 62,207 | 255,279 | |||||||
| Net cash used in investing activities | (941,367) | 12,684 | (928,683) | |||||||
| Net cash from financing activities | 745,987 | (74,891) | 671,096 | |||||||
| Decrease in cash and cash equivalents | (2,308) | - | (2,308) | |||||||
| ($ thousands) | For the three months ended | |||||||||
| As reported | Adjustment | As adjusted | ||||||||
| Net cash from operating activities | 35,532 | 18,464 | 53,996 | |||||||
| Net cash used in investing activities | (173,235) | 4,879 | (168,356) | |||||||
| Net cash from financing activities | 356,258 | (23,343) | 332,915 | |||||||
| Decrease in cash and cash equivalents | (218,555) | - | (218,555) | |||||||
A figure accompanying this announcement is available at https://www.globenewswire.com/NewsRoom/AttachmentNg/f7aa135c-f713-47d3-aa0f-bf8798b23d94


Roadmap to Revenues and Income Run-Rate of ~$2.1-2.3bn by the end of 2028
