The improvement in net income reflects higher operating revenues and higher net investment income, partially offset by higher income tax expense. Net investment income was
Average assets under management (AUM) for the fiscal year ended
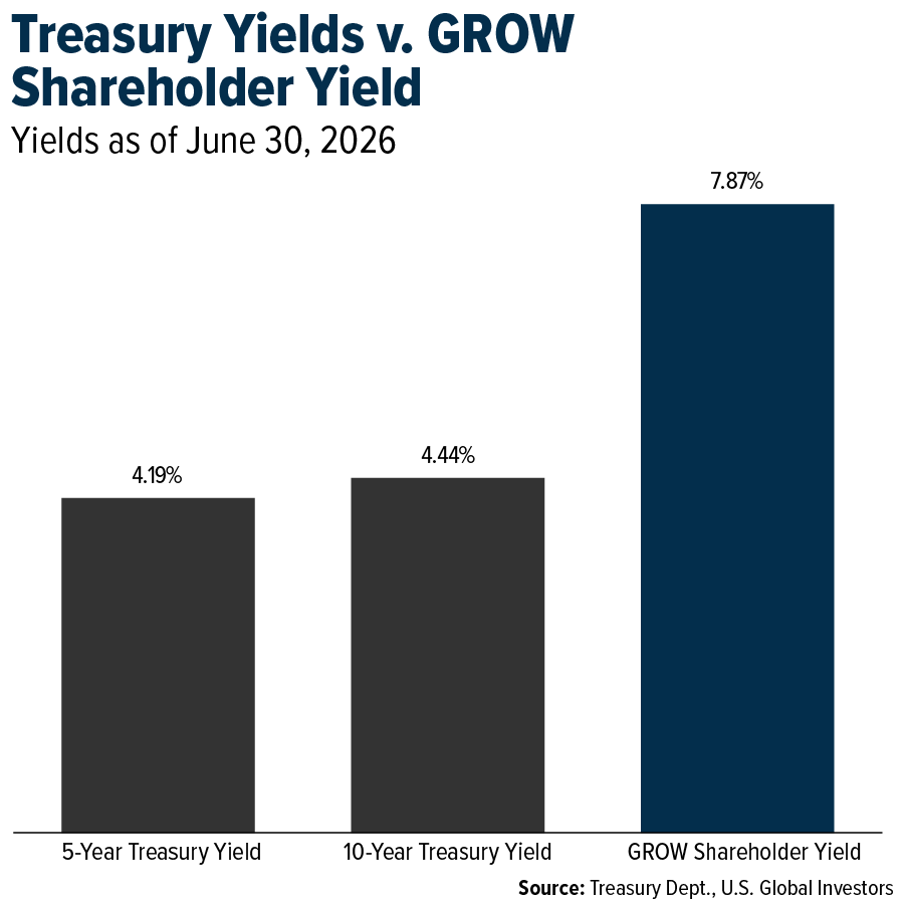
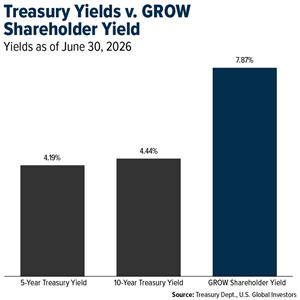
The shareholder yield as of
Gold and Natural Resources Drove Revenue Growth
Advisory fees from
Central bank buying remained an important source of gold demand during the fiscal year. According to the
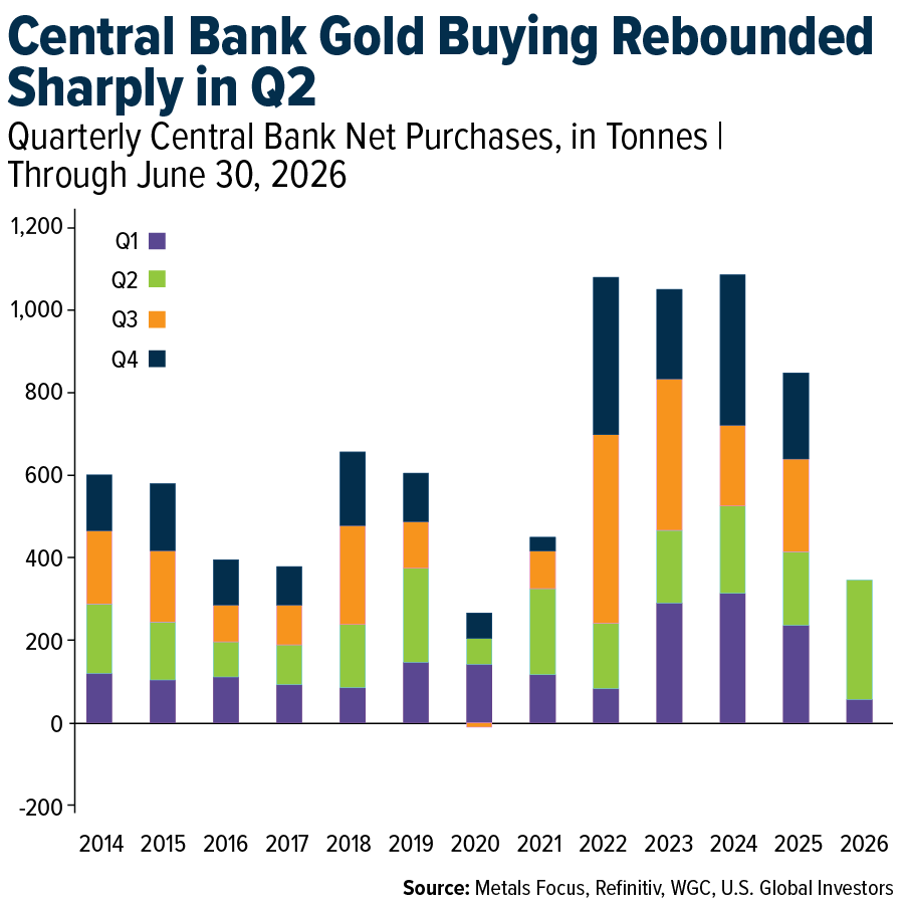
“Gold set a record near
Advisory fees from ETF clients totaled
WAR ETF Builds Strong Momentum, Growing Assets Nearly Sevenfold
“Defense used to mean tanks, ships and fighter jets,” says
Share Repurchases and Monthly Dividends
During the fiscal year ended
As of
Liquidity and Capital Resources
As of
Tune In to the Earnings Webcast
The Company has scheduled a webcast for
Selected Financial Data (unaudited): (dollars in thousands, except per share data)
| 12 months ended | ||||||
| Operating Revenues | $ | 10,251 | $ | 8,452 | ||
| Operating Expenses | 10,854 | 11,438 | ||||
| Operating Income (Loss) | (603 | ) | (2,986 | ) | ||
| Total Other Income | 4,487 | 2,724 | ||||
| Income (Loss) Before Income Taxes | 3,884 | (262 | ) | |||
| Income Tax Expense | 829 | 72 | ||||
| Net Income (Loss) | $ | 3,055 | $ | (334 | ) | |
| Net Income (Loss) Per Share (Basic and Diluted) | $ | 0.24 | $ | (0.03 | ) | |
| Avg. Common Shares Outstanding (Basic) | 12,674,691 | 13,343,506 | ||||
| Avg. Common Shares Outstanding (Diluted) | 12,686,445 | 13,344,627 | ||||
| Avg. Assets Under Management (Billions) | $ | 1.5 | $ | 1.4 | ||
About U.S. Global Investors, Inc.
The story of U.S. Global Investors goes back more than 50 years when it began as an investment club. Today, U.S. Global Investors, Inc. (www.usfunds.com) is a registered investment adviser that focuses on niche markets around the world. Headquartered in San Antonio, Texas, the Company provides investment management and other services to U.S. Global Investors Funds and U.S. Global ETFs.
Forward-Looking Statements and Disclosure
This news release and other statements by U.S. Global Investors may include certain “forward-looking statements,” including statements relating to revenues, expenses and expectations regarding market conditions. You can identify these forward-looking statements by the use of words such as “outlook,” “believes,” “expects,” “potential,” “opportunity,” “seeks,” “anticipates” or other comparable words. Such statements involve certain risks and uncertainties and should be read with corporate filings and other important information on the Company’s website, www.usfunds.com, or the Securities and Exchange Commission’s website at www.sec.gov.
These filings, such as the Company’s annual report and Form 10-Q, should be read in conjunction with the other cautionary statements that are included in this release. Future events could differ materially from those anticipated in such statements and there can be no assurance that such statements will prove accurate and actual results may vary. The Company undertakes no obligation to publicly update or review any forward-looking statements, whether as a result of new information, future developments or otherwise.
Please consider carefully a fund’s investment objectives, risks, charges and expenses. For this and other important information, obtain a statutory and summary prospectus for JETS here, WAR here. Read it carefully before investing.
Investing involves risk, including the possible loss of principal. Shares of any ETF are bought and sold at market price (not NAV), may trade at a discount or premium to NAV and are not individually redeemed from the funds. Brokerage commissions will reduce returns. Because the funds concentrate their investments in specific industries, the funds may be subject to greater risks and fluctuations than a portfolio representing a broader range of industries. The funds are non-diversified, meaning they may concentrate more of their assets in a smaller number of issuers than diversified funds.
The funds invest in foreign securities which involve greater volatility and political, economic and currency risks and differences in accounting methods. These risks are greater for investments in emerging markets. The funds may invest in the securities of smaller-capitalization companies, which may be more volatile than funds that invest in larger, more established companies.
The performance of the funds may diverge from that of the index. Because the funds may employ a representative sampling strategy and may also invest in securities that are not included in the index, the funds may experience tracking error to a greater extent than funds that seek to replicate an index. JETS is not actively managed and may be affected by a general decline in market segments related to their respective indexes. WAR is actively managed and does not seek to track an index.
Airline Companies may be adversely affected by a downturn in economic conditions that can result in decreased demand for air travel and may also be significantly affected by changes in fuel prices, labor relations and insurance costs. Gold, precious metals, and precious minerals funds may be susceptible to adverse economic, political or regulatory developments due to concentrating in a single theme. The prices of gold, precious metals, and precious minerals are subject to substantial price fluctuations over short periods of time and may be affected by unpredicted international monetary and political policies. We suggest investing no more than 5% to 10% of your portfolio in these sectors.
Foreign and emerging market investing involves special risks such as currency fluctuation and less public disclosure, as well as economic and political risk. By investing in a specific geographic region, such as China and/or Taiwan, a regional ETFs returns and share price may be more volatile than those of a less concentrated portfolio.
Distributed by Quasar Distributors, LLC. U.S. Global Investors is the investment adviser to JETS and WAR.
1 Registration does not imply a certain level of skill or training.
2 The Company calculates shareholder yield by adding the percentage of change in shares outstanding, the dividend yield and any debt reduction for the 12 months ended June 30, 2026.
3 World Gold Council. “Gold Demand Trends: Q2 2026,” by Louise Street and Krishan Gopaul, July 30, 2026, https://www.gold.org/goldhub/research/gold-demand-trends/gold-demand-trends-q2-2026.
4 World Gold Council. “Central Bank Gold Reserves Survey 2026,” June 16, 2026, https://www.gold.org/goldhub/research/central-bank-gold-reserves-survey-2026.
Contact:
Holly Schoenfeldt
Director of Marketing
210.308.1268
hschoenfeldt@usfunds.com
Figures accompanying this announcement are available at:
https://www.globenewswire.com/NewsRoom/AttachmentNg/ad93804a-27a2-43d3-b426-61404bb6973c
https://www.globenewswire.com/NewsRoom/AttachmentNg/be3691ff-76f1-4b6c-b078-a70dd0fb13e8

Treasury Yields v. GROW Shareholder Yield
Yields as of June 30, 2026
Central Bank Gold Buying Rebounded Sharply in Q2
