Company Reports Record
Treasury Exceeds 2.00M HYPE, 1.92M KNTQ, & 10.00M HPL Tokens as of
HYPD’s Unique “Triple-Dip” HYPE Deployment Generated >3x Base Staking Income in Q1
Company Raises Adjusted Gross Profit(1) 2026 FY Guidance by ~20%
“We are pleased to report continued scaling of our DeFi operating businesses, accretive balance sheet growth, and prudent cost management,” said
Q3’25, Q4’25, and Q1’26 Summary GAAP and Non-GAAP Financial Measures
| (Figures in $) | Q3 2025 | Q4 2025 | Q1 2026 | ||||
| GAAP | Gross Profit | 302,506 | 192,987 | 244,271 | |||
| Non-GAAP | Adjusted Gross Profit(1) | 439,386 | 820,997 | 959,568 | |||
| GAAP | HYPE Digital Assets | 37,954,590 | 16,233,941 | 25,286,164 | |||
| Non-GAAP | 77,751,604 | 47,837,901 | 71,037,227 | ||||
| Non-GAAP | Net Asset Value(9) | 74,545,583 | 44,154,737 | 69,873,504 | |||
| GAAP | Selling, General and Administrative Expense | 2,594,130 | 4,530,542 | 4,493,604 | |||
| Non-GAAP | Operating Expenses Excluding Stock-Based Compensation(5) | 4,315,016 | 3,007,135 | 2,975,883 | |||
| GAAP | Net Operating (Income) Expenses | (4,125,685 | ) | 39,958,264 | (8,487,848 | ) | |
| Non-GAAP | Treasury Gains (Losses)(6) | 11,868,872 | (36,783,228 | ) | 21,451,862 | ||
| GAAP | Total Other Income (Expense), Net | 2,197,391 | (288 | ) | 108,431 | ||
| Non-GAAP | Adjusted Other Income (Expense)(7) | (42,240 | ) | 48,717 | 52,585 | ||
| GAAP | Net Income (Loss) | 6,625,582 | (39,765,565 | ) | 8,840,550 | ||
| Non-GAAP | Adjusted EBITDA(8) | 7,951,003 | (38,920,649 | ) | 19,488,132 | ||
All figures in this press release are not audited. Throughout this document, totals may not sum due to rounding. Calculations are based on unrounded results.
This press release includes certain non-GAAP financial measures (including on a forward-looking basis) such as Adjusted Gross Profit,
| Adjusted Gross Profit(1) Guidance | Q3'25 | Q4'25 | FY'25 | Q1'26 | Q2'26 | Q3'26 | Q4'26 | FY'26 Guidance | 2026 Guidance vs. 2025 Actual | |||||||||
| Initial Guidance (Q4'25 A) | - | - | - | - | ~ 4x | |||||||||||||
| Current Guidance (Q1'26 A) | - | - | - | ~ 5x | ||||||||||||||
| Adjusted Gross Profit(1)(in $ thousands) | Q3'25 | Q4'25 | Q1'26 | QoQ Growth | |||||||||
| Ecosystem Rewards | - | 285 | 150 | -47% | |||||||||
| DeFi Monetization | <1 | 102 | 245 | 140% | |||||||||
| Yield Enhancement | 78 | 79 | 211 | 165% | |||||||||
| Validator Commissions | 21 | 49 | 40 | -17% | |||||||||
| Staking Yield | 340 | 305 | 313 | 2% | |||||||||
| Adjusted Gross Profit(1) | 439 | 821 | 960 | 17% | |||||||||
| Multiple vs. Staking Yield | 1.3x | 2.7x | 3.1x | ||||||||||
| % Earned in Cash* | 18% | 22% | 48% | ||||||||||
| HYPE Earned in Staking & Validating(2) | 7,895 | 10,076 | 11,458 | 14% | |||||||||
| Effective Average HYPE Price In-Period(3) | 45.76 | 35.12 | 30.82 | ||||||||||
*The portion of Adjusted Gross Profit(1) earned in cash, cash equivalents, and USDH(16)
Please see “Footnotes” and “Non-GAAP Measures of Financial Performance” sections for detailed definitions and reconciliations to the nearest GAAP Metric.
| HYPE Treasury Over Time | ||||||||
| Gross HYPE Tokens(2) | 1.72 M | 1.88 M | 1.94 M | 2.00 M | ||||
| HYPE Token Price | ||||||||
| Cash, Cash Equivalents, and USDH(16) | ||||||||
Please see “Footnotes” and “Non-GAAP Measures of Financial Performance” sections for detailed definitions and reconciliations to the nearest GAAP Metric.
HYPD Investment Thesis
- We are unique among digital asset treasuries with five diversified operating business lines.
- Our “Triple-Dip” HYPE deployment strategy, by which we earned approximately ~3.1x base staking income in Q1’26 versus ~2.7x in Q4’25, is possible because of our management’s unique ability to build on the Hyperliquid Blockchain.
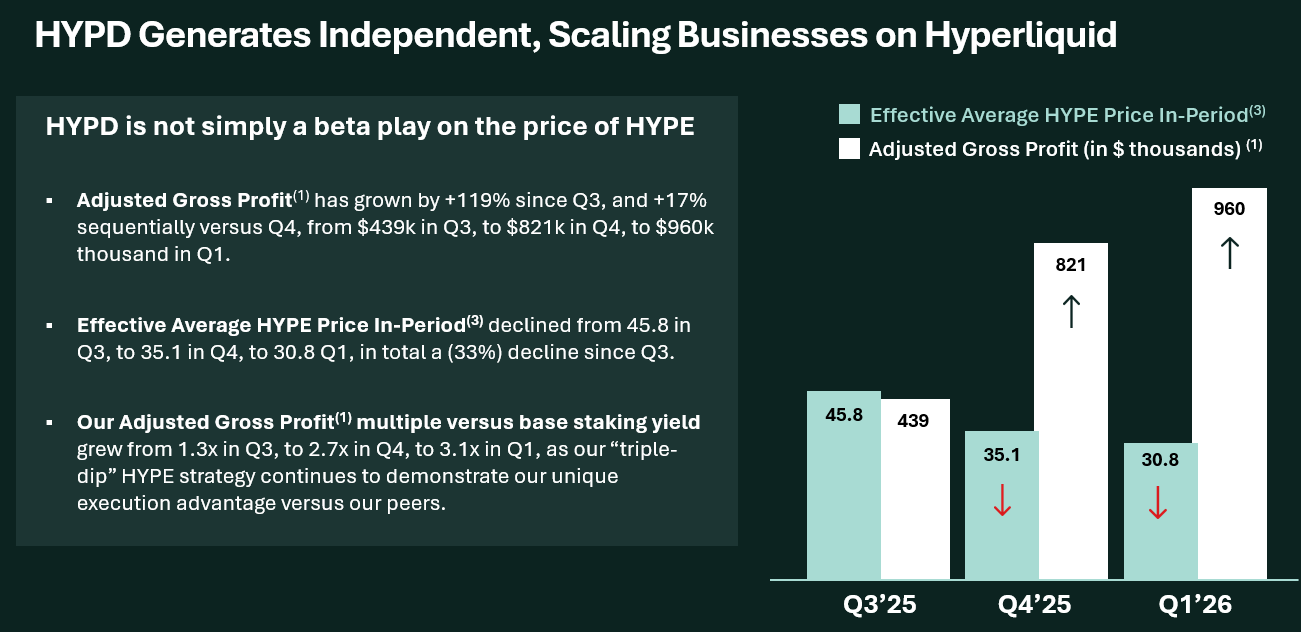
- Even as the Effective Average HYPE Price In-Period(3) declined, we achieved +17% quarter-over-quarter growth in Adjusted Gross Profit(1), driven by ramping DeFi Monetization and Yield Enhancement strategies (each at >100% Q-o-Q growth).
- The portion of our Adjusted Gross Profit(1) earned in cash, cash equivalents, and USDH(16) increased from 22% in Q4’25 to 48% in Q1’26.
- Beyond our growing HYPE treasury, our Hyperliquid ecosystem token holdings (such as KNTQ and HPL) uniquely position HYPD for upside in early-stage builders.
- We operate with strong earnings leverage and a low cost base built for scale. We anticipate Operating Expenses Excluding Stock-Based Compensation(5) to further decline below a quarterly run-rate of
$3.0 million beginning in Q2’26 driven by the exit of legacy biotech operations. - We anticipate
$5M-$7M Adjusted Gross Profit(1) in 2026, ~5x our 2025 FY results, which represents a+$1M increase in range from our Q4’25 earnings release.
Our businesses are designed to simultaneously promote and monetize adoption of the Hyperliquid blockchain. In Q1, our unique ability to “triple-dip” our HYPE tokens across multiple deployment strategies generated ~3.1x the income would have otherwise generated from staking in isolation. Our “HYPD Triple-Dip” strategy is:
1) Stake our HYPE
2) Deploy the staked HYPE into another business activity – our Validator, Yield Enhancement, or DeFi Monetization, and
3) Position ourselves to receive Ecosystem Rewards
Adjusted Gross Profit(1) in Q4’25 and Q1’26
Adjusted Gross Profit(1), a Non-GAAP Metric, aims to capture all of Hyperion DeFi’s value-add operating business activities beyond simply buying and holding HYPE tokens. In total, Adjusted Gross Profit(1) increased +17% quarter-over-quarter from
Below is a summary of all five of our operating business activities included within Adjusted Gross Profit(1) in these periods:
- Staking Yield: We stake our HYPE to our Validator and earn rewards.
- In Q1’26, the Company earned 10,143 HYPE tokens from staking, up 16% quarter-over-quarter versus 8,437 in Q4’25.
- On a dollar basis, our HYPE earned from staking generated
$313 thousand Adjusted Gross Profit(1) in Q1’26 versus$305 thousand in Q4’25 (+2% quarter-over-quarter), while the Effective Average HYPE Price In-Period(3) declined -12% from 35.12 in Q4’25 to 30.82 in Q1’26.
- Validator Commissions: The Company operates its Validator under a Joint Validator Operators Agreement (together with Kinetiq and
Pier Two ) and earns commissions on rewards delivered to third-party tokens delegated to the Validator.- In Q1’26, the Company earned 1,315 HYPE tokens as validator commissions, a modest decline of -3% quarter-over-quarter versus 1,362 in Q4’25.
- On a dollar basis, our HYPE earned from validator commissions generated
$40 thousand Adjusted Gross Profit(1) in Q1’26 versus$49 thousand in Q4’25 (-17% quarter-over-quarter), given the Effective Average HYPE Price In-Period(3) declined -12% from 35.12 in Q4’25 to 30.82 in Q1’26. - 10.2 million HYPE tokens were delegated to our Validator as of
April 30, 2026 , and we are the Top 6 Hyperliquid Validator after theHyper Foundation .
- Yield Enhancement: The Company pursues accretive strategies to enhance yield earned on its tokens.
- Yield Enhancement activities generated
$211 thousand Adjusted Gross Profit(1) in Q1’26 versus$79 thousand in Q4’25 (+165% quarter-over-quarter). - Q1’26 and Q4’25 Yield Enhancement activities included multiple HYPE volatility strategies OTC and on-chain.
- In Q1’26, we began executing within our Institutional Volatility Income Vault, in partnership with the Rysk protocol, further optimizing our Yield Enhancement capabilities while building the infrastructure to accommodate third-party execution within Rysk Premium in the future.
- Yield Enhancement activities generated
- DeFi Monetization: The Company supports and monetizes Hyperliquid DeFi activity with sustainable, scalable practices.
- DeFi Monetization activity generated
$245 thousand Adjusted Gross Profit(1) in Q1’26 versus$102 thousand in Q4’25 (+140% quarter-over-quarter). - DeFi Monetization includes our Temporary HYPE Asset Use Agreements (“HAUS”) and protocol partnerships generating third-party fees.
- In Q1’26, we entered into a HAUS agreement with Silhouette. We provided the use of HYPE tokens to the Silhouette aggregated trading account, allowing Silhouette to pass along reduced trading fees to its customers on the Silhouette platform, and entitling us to earn a portion of those fee savings as income, plus 100% of staking rewards.
- DeFi Monetization activity generated
- Ecosystem Rewards: Through our active participation in the Hyperliquid DeFi ecosystem, the Company positions itself for the receipt of future potential token airdrops, protocol incentives, and other rewards that may become available periodically.
- Ecosystem Rewards generated
$150 thousand Adjusted Gross Profit(1) in Q1’26, versus$285 thousand in Q4’25.- We expect the quarter-over-quarter change in Ecosystem Rewards to be volatile given the unexpected timing of airdrops, token generation events, and other rewards activity.
- In
November 2025 , we received 1,918,478 KNTQ tokens in Kinetiq’s airdrop token generation event. - In
March 2026 , we cumulatively received 10,000,000 HPL tokens from HyperLend in connection with multiple partnership and revenue-sharing agreements in connection with on-chain credit pools. - Silhouette is contractually obligated to award HYPD at least 1% of future token supply or equity, including affiliates and related parties.
- Given our partnerships with other Hyperliquid ecosystem participants such as Rysk, and given that we are continuing to accrue additional Kinetiq points, we anticipate additional ecosystem rewards in 2026.
- Ecosystem Rewards generated
| Non-GAAP Income Summary (Figures in $) | Q3 2025 | Q4 2025 | Q1 2026 | |||
| Adjusted Gross Profit(1) | 439,386 | 820,997 | 959,568 | |||
| Operating Expenses Excluding Stock-Based Compensation(5) | 4,315,016 | 3,007,135 | 2,975,883 | |||
| Treasury Gains (Losses)(6) | 11,868,872 | (36,783,228 | ) | 21,451,862 | ||
| Adjusted Other Income (Expense)(7) | (42,240 | ) | 48,717 | 52,585 | ||
| Adjusted EBITDA(8) | 7,951,003 | (38,920,649 | ) | 19,488,132 | ||
Please see “Footnotes” and “Non-GAAP Measures of Financial Performance” sections for detailed definitions and reconciliations to the nearest GAAP Metric.
Q4’25 and Q1'26 Expense Summary Results
- Operating Expenses Excluding Stock-Based Compensation(5) declined (1%) quarter-over-quarter from
$3.00 million in Q4’25 to$2.98 million in Q1’26. - Research and development expenses were
$287 thousand in Q1’26 versus$189 thousand in Q4’25. - Selling, general, and administrative expenses excluding stock-based compensation decreased (5%) quarter-over-quarter, from
$2.8 million in Q4’25 to$2.7 million in Q1’26. - We expect to wind down legacy biotech operations by the end of Q2’26.
Q4’25 and Q1'26 Treasury Summary
- Gross HYPE Tokens(2) increased from 1.88 million in Q4’25 to 1.94 million in Q1’26.
- Our HYPE treasury has grown to over 2.00 million tokens as of
May 11, 2026 (14).
- Our HYPE treasury has grown to over 2.00 million tokens as of
Gross HYPE Holdings (4) increased from$47.8 million as of Q4’25 to$71.0 million as of Q1’26 as the price of HYPE increased from$25.4 to$36.6 in Q1’26.- Net Asset Value(9) increased from
$44.2 million as of Q4’25 to$69.9 million as of Q1’26. - Treasury Gains (Losses)(6) was
$21.5 million in Q1’26 versus ($36.8 million ) in Q4’25.
Q4'25 and Q1’26 Net Income (Loss) and Adjusted EBITDA(8)
- Q1’26 Net Income of
$8.8 million compares to Q4’25 Net Loss of ($39.8 million ). - Q1’26 Adjusted EBITDA(8) of
$19.5 million compares to Q4’25 Adjusted EBITDA(8) of ($38.9 million )- The primary reconciliation of Net Income to Adjusted EBITDA(8) is our HYPE Liquid Staking Tokens (LSTs), for which the GAAP carrying value is the low-water-mark price of HYPE, as detailed further in our GAAP to Non-GAAP reconciliations section at the end of this release.
- Q1’26 Net Income Attributable to Common Shareholders of
$3.3 million compares to Q4’25 Net Loss Attributable to Common Shareholders of ($40.6 million ). - Q1’26 Net Income per Common Share of
$0.30 on a basic basis (10,610,679 weighted average shares) and$0.26 on a diluted basis (12,686,142 weighted average shares), compares to Q4’25 Net Loss per Share of ($6.29 ) on 6,452,733 on weighted average shares outstanding. - As of
May 11, 2026 , there are 15,025,498 outstanding shares of common stock.
Q4’25 and Q1'26 Cash Flows Summary
- Operating Activities used
$4.2 million net cash in Q1’26 versus$4.1 million in Q4’25.- Q1’26 Operating Cash Flow included
$1.5 million net increase in the levels of operating assets (including acquiring additional USDH stablecoin(16)), without which,Net Cash Used in Operating Activities would have been$2.7 million . - Our cash, cash equivalents, and USDH(16) totaled
$9.1 million as of Q1’26 versus$6.5 million as of Q4’25. - As of
May 11, 2026 , our cash, cash equivalents, and USDH(16) totaled approximately$16.0 million (14).
- Q1’26 Operating Cash Flow included
Net Cash Used in Investing Activities to purchase HYPE was$1.5 million in Q1’26 versus$6.3 million in Q4’25.- QTD Q2’26 as of
May 11, 2026 , we have purchased$2.5 million in HYPE.
- QTD Q2’26 as of
- Net Cash Provided by Financing Activities was
$6.6 million in Q1’26 (primarily from our “at-the-market” offering) versus$9.4 million in Q4’25.- Through
May 11, 2026 , QTD Q2’26 we have raised approximately$1.9 million net proceeds from the sale of 492,783 shares via our “at-the-market” offering(14). - On
May 7, 2026 , we closed a public offering of 2,777,778 common shares and received approximately$8.7 million in net proceeds(14).
- Through
Conference Call & Webcast
Presentation
All growth rates represent quarter-over-quarter comparisons, except as otherwise noted. All amounts in tables are presented in
About the Hyperliquid Platform and the HYPE Token
Hyperliquid is a next-generation layer one blockchain optimized for high frequency, transparent trading. The blockchain includes fully on-chain perpetual futures and spot order books, with every order, cancel, trade, and liquidation occurring within 70 millisecond block times. It also hosts the HyperEVM, a general-purpose smart contract platform that supports permissionless decentralized financial applications akin to Ethereum.
HYPE is the native token of Hyperliquid. Staked HYPE provides utility for users via reduced trading fees and increased referral bonuses. As of
About
For more information, please visit Hyperiondefi.com or follow @hyperiondefi on X.
Forward Looking Statements; Disclaimer
Except for historical information, all the statements, expectations and assumptions contained in this press release are forward-looking statements. Forward-looking statements include, but are not limited to, statements that express our intentions, beliefs, expectations, strategies, predictions or any other statements, our future activities or other future events or conditions, including the viability of, and risks associated with, our cryptocurrency treasury strategy, the growth and revenue potential of the Hyperliquid ecosystem and the growth prospects of the Company. These statements are based on current expectations, estimates and projections about our business based, in part, on assumptions made by management. These statements are not guarantees of future performance and involve risks, uncertainties and assumptions that are difficult to predict. Therefore, actual outcomes and results may, and in some cases are likely to, differ materially from what is expressed or forecasted in the forward-looking statements due to numerous factors discussed from time to time in documents which we file with the U.S. Securities and Exchange Commission.
Any forward-looking statements speak only as of the date on which they are made, and except as may be required under applicable securities laws,
Certain information contained in this press release relates to or is based on studies, publications, surveys and other data obtained from third-party sources and Hyperion DeFi’s own internal estimates and research. While
IR@hyperiondefi.com
(678) 570-6791
Condensed Balance Sheets (unaudited) | ||||||||
| 2026 | 2025 | |||||||
| (unaudited) | ||||||||
| Assets | ||||||||
| Current Assets | ||||||||
| Cash and cash equivalents | $ | 7,380,922 | $ | 6,443,467 | ||||
| Prepaid expenses and other current assets | 1,423,025 | 802,342 | ||||||
| Total Current Assets | 8,803,947 | 7,245,809 | ||||||
| Digital assets | 25,422,127 | 16,345,347 | ||||||
| Digital assets receivable, net | 10,376,105 | 6,935,131 | ||||||
| Digital intangible assets | 16,033,758 | 20,591,555 | ||||||
| Digital intangible assets receivable, net | 8,907,419 | — | ||||||
| Operating lease right-of-use asset | 340,407 | 415,998 | ||||||
| Other assets | 182,200 | 230,416 | ||||||
| Total Assets | $ | 70,065,963 | $ | 51,764,256 | ||||
| Liabilities and Stockholders’ Equity | ||||||||
| Current Liabilities: | ||||||||
| Accounts payable | $ | 428,266 | $ | 317,900 | ||||
| Accrued expenses and other current liabilities | 2,070,181 | 1,871,106 | ||||||
| Operating lease liabilities - current portion | 465,245 | 512,007 | ||||||
| Notes payable - current portion | 1,509,326 | — | ||||||
| Total Current Liabilities | 4,473,018 | 2,701,013 | ||||||
| Notes payable - non-current portion | 6,965,557 | 7,796,136 | ||||||
| Operating lease liabilities, non-current portion | 132,424 | 206,600 | ||||||
| Total Liabilities | 11,570,999 | 10,703,749 | ||||||
| Commitments and contingencies (Note 9) | ||||||||
| Stockholders’ Equity | ||||||||
| Preferred stock, | 524 | 544 | ||||||
| Common stock, | 1,143 | 876 | ||||||
| Additional paid-in-capital | 290,277,174 | 281,937,072 | ||||||
| — | (253,558 | ) | ||||||
| Accumulated deficit | (231,783,877 | ) | (240,624,427 | ) | ||||
| Total Stockholders’ Equity | 58,494,964 | 41,060,507 | ||||||
| Total Liabilities and Stockholders’ Equity | $ | 70,065,963 | $ | 51,764,256 | ||||
Condensed Statements of Operations (unaudited) | ||||||||
| For the Three Months Ended | ||||||||
| 2026 | 2025 | |||||||
| Revenue | $ | 244,271 | $ | 14,720 | ||||
| Cost of revenue | — | (48 | ) | |||||
| Gross Profit | 244,271 | 14,672 | ||||||
| Operating (Income) Expenses: | ||||||||
| Research and development | 286,764 | 673,043 | ||||||
| Selling, general and administrative | 4,493,604 | 2,372,322 | ||||||
| Realized gain - digital assets and digital assets receivable | (3,623,764 | ) | — | |||||
| Unrealized gain - digital assets | (10,973,979 | ) | — | |||||
| Unrealized gain – digital intangible assets receivable | (367,251 | ) | — | |||||
| Impairment loss - digital intangible assets | 1,231,668 | — | ||||||
| Net gains (losses) on derivative instruments | (39,401 | ) | — | |||||
| Provision for credit losses | 504,511 | — | ||||||
| Net Operating (Income) Expenses | (8,487,848 | ) | 3,045,365 | |||||
| Income (Loss) From Operations | 8,732,119 | (3,030,693 | ) | |||||
| Other Income (Expense): | ||||||||
| Other income, net | 90,133 | 3,687 | ||||||
| Gain on extinguishment of liabilities | — | 89,623 | ||||||
| Interest expense | (225,869 | ) | (581,499 | ) | ||||
| Interest income | 244,167 | 35,349 | ||||||
| Total Other Income (Expense), Net | 108,431 | (452,840 | ) | |||||
| Net Income (Loss) | 8,840,550 | (3,483,533 | ) | |||||
| Dividend to preferred stockholders | (815,297 | ) | — | |||||
| Net Income (Loss) Attributable to | 8,025,253 | (3,483,533 | ) | |||||
| Less: income allocated to preferred stockholders | (4,789,742 | ) | — | |||||
| Net Income (Loss) Available to Common Stockholders | $ | 3,235,511 | $ | (3,483,533 | ) | |||
| Net Loss per Share - Basic | $ | 0.30 | $ | (1.59 | ) | |||
| Net Loss per Share - Diluted | $ | 0.26 | $ | (1.59 | ) | |||
| Shares Outstanding - Basic | 10,610,679 | 2,188,938 | ||||||
| Shares Outstanding - Diluted | 12,686,142 | 2,188,938 | ||||||
Condensed Statements of Stockholders’ Equity (Deficit) (unaudited) | |||||||||||||||||||||||||||||||||
| For the Three Months Ended | |||||||||||||||||||||||||||||||||
| Additional | Total | ||||||||||||||||||||||||||||||||
| Preferred Stock | Common Stock | Paid-In | Treasury Stock | Accumulated | Stockholders’ | ||||||||||||||||||||||||||||
| Shares | Amount | Shares | Amount | Capital | Shares | Amount | Deficit | Equity | |||||||||||||||||||||||||
| Balance - | 5,435,897 | $ | 544 | 8,762,329 | $ | 876 | $ | 281,937,072 | 82,324 | $ | (253,558 | ) | $ | (240,624,427 | ) | $ | 41,060,507 | ||||||||||||||||
| Issuance of common stock in At the Market offering [1] | — | — | 1,859,993 | 186 | 6,665,196 | — | — | — | 6,665,382 | ||||||||||||||||||||||||
| Issuance of common stock for payment in kind of preferred stock dividend | — | — | 244,518 | 25 | 939,312 | — | — | — | 939,337 | ||||||||||||||||||||||||
| Issuance of common stock from the delivery of vested restricted stock units | — | — | 33,516 | 3 | (3 | ) | — | — | — | — | |||||||||||||||||||||||
| Issuance of common stock from conversion of preferred stock | (200,000 | ) | (20 | ) | 600,000 | 60 | (40 | ) | — | — | — | — | |||||||||||||||||||||
| Retirement of treasury shares | — | — | (82,324 | ) | (8 | ) | (253,550 | ) | (82,324 | ) | 253,558 | — | — | ||||||||||||||||||||
| Stock-based compensation: | |||||||||||||||||||||||||||||||||
| Amortization of stock option awards | — | — | — | — | 80,880 | — | — | — | 80,880 | ||||||||||||||||||||||||
| Amortization of restricted stock units | — | — | — | — | 1,690,852 | — | — | — | 1,690,852 | ||||||||||||||||||||||||
| Issuance of common stock to vendors as consideration for service provided | — | — | 10,450 | 1 | 32,752 | — | — | — | 32,753 | ||||||||||||||||||||||||
| Preferred stock dividend ( | — | — | — | — | (815,297 | ) | — | — | — | (815,297 | ) | ||||||||||||||||||||||
| Net income | — | — | — | — | — | — | — | 8,840,550 | 8,840,550 | ||||||||||||||||||||||||
| Balance - | 5,235,897 | $ | 524 | 11,428,482 | $ | 1,143 | $ | 290,277,174 | — | $ | — | $ | (231,783,877 | ) | $ | 58,494,964 | |||||||||||||||||
| For the Three Months Ended | ||||||||||||||||||||||||||||
| Additional | Total | |||||||||||||||||||||||||||
| Preferred Stock | Common Stock | Paid-In | Treasury Stock | Accumulated | Stockholders’ | |||||||||||||||||||||||
| Shares | Amount | Shares | Amount | Capital | Shares | Amount | Deficit | Deficit | ||||||||||||||||||||
| Balance - | — | $ | — | 1,506,369 | $ | 151 | $ | 182,213,889 | — | $ | — | $ | (195,309,992 | ) | $ | (13,095,952 | ) | |||||||||||
| Issuance of common stock in At the Market offering [2] | — | — | 1,127,100 | 113 | 5,663,153 | — | — | — | 5,663,266 | |||||||||||||||||||
| Induced exercise of stock warrants [3] | — | — | 197,118 | 19 | 922,731 | — | — | — | 922,750 | |||||||||||||||||||
| Reverse stock split settlement of fractional shares | — | — | (41 | ) | — | (160 | ) | — | — | — | (160 | ) | ||||||||||||||||
| Warrant modification and additional warrants-incremental value [4] | — | — | — | — | 1,194,102 | — | — | — | 1,194,102 | |||||||||||||||||||
| Warrant modification and additional warrants-in issuance costs for inducement [5] | — | — | — | — | (1,194,102 | ) | — | — | — | (1,194,102 | ) | |||||||||||||||||
| Stock-based compensation | — | — | — | — | 279,628 | — | — | — | 279,628 | |||||||||||||||||||
| Net loss | — | — | — | — | — | — | — | (3,483,533 | ) | (3,483,533 | ) | |||||||||||||||||
| Balance - | — | $ | — | 2,830,546 | $ | 283 | $ | 189,079,241 | — | $ | — | $ | (198,793,525 | ) | $ | (9,714,001 | ) | |||||||||||
________________________________
[1] Includes gross proceeds of
[2] Includes gross proceeds of
[3] Includes gross proceeds of
[4] Incremental value from the warrant inducement entered into on
[5] Non-cash warrant modification and additional warrants issuance costs related to the warrant inducement are shown as a separate line item for clarity.
Condensed Statements of Cash Flows (unaudited) | ||||||||
| For the Three Months Ended | ||||||||
| 2026 | 2025 | |||||||
| Cash Flows From Operating Activities | ||||||||
| Net income (loss) | $ | 8,840,550 | $ | (3,483,533 | ) | |||
| Adjustments to reconcile net income (loss) to net cash and cash equivalents used in operating activities: | ||||||||
| Stock-based compensation | 1,804,485 | 279,628 | ||||||
| Change in fair value of shares issued for accrued dividend | 146,719 | — | ||||||
| Amortization of debt discount | 55,461 | 277,972 | ||||||
| Non-cash lease expense | 75,591 | 75,591 | ||||||
| Provision for credit losses | 504,511 | — | ||||||
| Gain on extinguishment of liabilities | — | (89,623 | ) | |||||
| Realized gain - digital assets | (3,623,764 | ) | — | |||||
| Unrealized gain - digital assets | (10,973,979 | ) | — | |||||
| Unrealized gain – digital intangible assets receivable | (367,251 | ) | ||||||
| Net gains on derivative instruments | (39,401 | ) | — | |||||
| Impairment loss - digital intangible assets | 1,231,668 | — | ||||||
| Non-cash revenue, net | (244,271 | ) | — | |||||
| Non-cash portion of other income | (6,041 | ) | — | |||||
| Non-cash interest income from digital assets receivable | (198,957 | ) | — | |||||
| Paid-in-kind interest expense | 83,672 | 198,829 | ||||||
| Changes in operating assets and liabilities: | ||||||||
| Prepaid expenses and other current assets | (1,542,190 | ) | (577,321 | ) | ||||
| License fee and expense reimbursements receivables | — | (960 | ) | |||||
| Accounts payable | 110,366 | (999,807 | ) | |||||
| Accrued expenses and other current liabilities | 67,117 | 28,814 | ||||||
| Lease liabilities | (120,938 | ) | (152,436 | ) | ||||
| (4,196,652 | ) | (4,442,846 | ) | |||||
| Cash Flows From Investing Activities | ||||||||
| Purchase of digital assets | (1,472,835 | ) | — | |||||
| (1,472,835 | ) | — | ||||||
| Cash Flows From Financing Activities | ||||||||
| Proceeds from sale of common stock in At the Market offering | 6,981,098 | 5,851,007 | ||||||
| Proceeds from induced exercise of stock warrants | — | 1,039,206 | ||||||
| Payment of issuance costs for At the Market offering | (315,716 | ) | (187,741 | ) | ||||
| Repayments of notes payable | (58,440 | ) | (152,279 | ) | ||||
| Payment of issuance costs for debt modification | — | (177,228 | ) | |||||
| Payment of cash issuance costs for induced exercise of stock warrants | — | (116,456 | ) | |||||
| Reverse stock split settlement of fractional shares | — | (160 | ) | |||||
| 6,606,942 | 6,256,349 | |||||||
| Net Increase in Cash and Cash Equivalents | 937,455 | 1,813,503 | ||||||
| Cash and Cash Equivalents - Beginning of Period | 6,443,467 | 2,121,463 | ||||||
| Cash and Cash Equivalents - End of Period | $ | 7,380,922 | $ | 3,934,966 | ||||
Condensed Statements of Cash Flows, continued (unaudited) | ||||||
| For the Three Months | ||||||
| Ended | ||||||
| 2026 | 2025 | |||||
| Supplemental Disclosure of Cash Flow Information: | ||||||
| Cash paid during the period for: | ||||||
| Interest | $ | 86,737 | $ | — | ||
| Taxes | $ | — | $ | — | ||
| Supplemental Disclosure of Non-Cash Investing and Financing Activities | ||||||
| Modification date carrying value of extinguished Avenue Loan | $ | — | $ | 10,262,280 | ||
| Modification date fair value of modified Avenue Loan | $ | — | $ | 10,172,657 | ||
| Transfer of digital assets into digital intangible assets receivable | $ | 8,863,235 | $ | — | ||
| Deposits of USDH into Hyperion Rysk Vault | $ | 1,765,075 | $ | — | ||
| Redemption of digital assets from Hyperion Rysk Vault | $ | 151,377 | $ | — | ||
| Warrant modification and additional warrants - incremental value | $ | — | $ | 1,194,102 | ||
| Prepaid insurance financed by note payable | $ | 598,055 | $ | — | ||
| Common stock issued for accrued dividends payable | $ | 939,337 | $ | — | ||
| Accrued dividend payable to preferred stockholders | $ | 815,297 | $ | — | ||
| $ | 253,558 | $ | — | |||
| Deposits of digital assets into liquid staking activities | $ | 224,011 | $ | — | ||
| Liability for digital assets received from lender, prior to loan origination | $ | 150,163 | $ | — | ||
| Common stock issued upon conversion of preferred stock | $ | 60 | $ | — | ||
| Receipt of digital assets from liquid staking activities | $ | 4 | $ | — | ||
| Issuance of common stock upon vesting of restricted stock units | $ | 3 | $ | — | ||
Hyperion DeFi Non-GAAP Measures of Financial Performance and Supplemental Disclosures
| Reconciliation of GAAP Revenue to Non-GAAP Adjusted Gross Profit(1) (unaudited) | |||
| For the Three Months Ended | |||
| (Figures in $) | 2025 | 2025 | 2026 |
| Gross Profit | 302,506 | 192,987 | 244,271 |
| Add: Accumulated but unrealized staking yield on LSTs(10) | 58,771 | 172,463 | 154,806 |
| Add: Net gains on derivative instruments | 78,109 | 79,461 | 39,401 |
| Add: Accumulated but unrealized yield enhancement activity(15) | - | - | 171,970 |
| Add: Operating Income from airdrops | - | 285,450 | - |
| Add: Receipt of HPL tokens pursuant to partnership agreements | - | - | 150,163 |
| Add: Interest Income from DeFi Monetization activity | - | 90,636 | 198,957 |
| Adjusted Gross Profit(1) | 439,386 | 820,997 | 959,568 |
Note: See “Footnotes” section for detailed explanations and definitions.
| Q1’26 Reconciliation of GAAP HYPE Digital Assets to | |||||
| As of | |||||
| Value $ | Token Count | Token Price $ | |||
| HYPE digital assets | 25,286,164 | 690,505 | 36.62 | ||
| Add: | |||||
| HYPE digital assets receivable* | 11,071,200 | 302,327 | 36.62 | ||
| HYPE digital intangible assets receivable** | 9,230,486 | 250,000 | 20.66 | ||
| HiHYPE at Carrying Value | 7,785,852 | 378,277 | 20.58 | ||
| kHYPE at Carrying Value | 5,693,449 | 275,434 | 20.67 | ||
| kmHYPE at Carrying Value | 597,068 | 28,888 | 20.67 | ||
| Unrealized accretion (dilution) expected upon LST to HYPE reconversion(11) | 11,373,007 | 14,421 | N.M.*** | ||
| 71,037,344 | |||||
| Gross HYPE Tokens(2) | 1,939,851 | 36.62 | |||
| Note: See “Footnotes” section for detailed explanations and definitions. | |||||
| Memo: Unrealized accretion (dilution) expected upon LST to HYPE reconversion as of | 3,499,665 | ||||
| Memo: In-Period Change in unrealized accretion (dilution) expected upon LST to HYPE reconversion | 7,873,342 | ||||
*Presented gross of
**Presented gross of
***Throughout this release, N.M. is the abbreviation for “Not Meaningful”.
| Q4’25 Reconciliation of GAAP HYPE Digital Assets to | ||||||
| As of | ||||||
| Value $ | Token Count | Token Price | ||||
| HYPE - Digital Assets | 16,233,941 | 638,352 | 25.43 | |||
| Add: | ||||||
| HYPE digital asset receivable* | 7,647,740 | 300,725 | 25.43 | |||
| HiHYPE at carrying value | 8,437,277 | 398,277 | 21.18 | |||
| kHYPE at carrying value | 11,369,458 | 505,434 | 22.49 | |||
| kmHYPE at carrying value | 649,820 | 28,888 | 22.49 | |||
| Add: Unrealized accretion (dilution) expected upon future LST to HYPE Token reconversion(11) | 3,499,665 | 9,410 | N.M. | |||
| 47,837,901 | ||||||
| Gross HYPE Tokens(2) | 1,881,086 | 25.43 | ||||
| Note: See “Footnotes” section for detailed explanations and definitions. | ||||||
| Unrealized accretion (dilution) expected upon LST to HYPE reconversion as of Q3’25 | 4,912,082 | |||||
| In-Period Change in unrealized accretion (dilution) expected upon LST to HYPE vs. Q3’25 | (1,412,417 | ) | ||||
*Presented gross of
| Q3’25 Reconciliation of GAAP HYPE Digital Assets to | |||||
| As of | |||||
| Value $ | Token Count | Token Price | |||
| HYPE digital assets | 37,954,590 | 839,889 | 45.19 | ||
| Add: HiHYPE at Carrying Value | 34,884,932 | 877,871 | 39.74 | ||
| Add: Unrealized accretion (dilution) expected upon future LST to HYPE Token reconversion(11) | 4,912,082 | 2,788 | N.M. | ||
| 77,751,604 | |||||
| Gross HYPE Tokens(2) | 1,720,549 | 45.19 | |||
| Note: See “Footnotes” section for detailed explanations and definitions. | |||||
| Unrealized accretion (dilution) expected upon LST to HYPE reconversion as of | 4,912,082 | ||||
*The Company did not hold any LSTs on or prior to
| Reconciliation of GAAP Selling, General and Administrative expense to Non-GAAP Operating Expense Excluding Stock-Based Compensation(5) (unaudited) | |||||
| For the Three Months Ended | |||||
| (Figures in $) | 2025 | 2025 | 2026 | ||
| Selling, general and administrative expense | 2,594,130 | 4,530,542 | 4,493,604 | ||
| Subtract: stock-based compensation expense | 1,347,031 | (1,712,361 | ) | (1,804,485 | ) |
| Add: research and development expense | 373,855 | 188,954 | 286,764 | ||
| Operating Expense Excluding Stock-Based Compensation(5) | 4,315,016 | 3,007,135 | 2,975,883 | ||
Note: See “Footnotes” section for detailed explanations and definitions.
| Supplemental Disclosure of Disaggregated Stock-Based Compensation (unaudited) | ||||
| For the Three Months Ended | ||||
| (Figures in $) | 2025 | 2025 | 2026 | |
| Mark-to-Market Adjustment of Vested but Undelivered Awards | (2,140,000 | ) | - | - |
| Amortization of Unearned Executive Milestone Awards | 209,648 | 997,563 | 997,563 | |
| All Remaining Stock-Based Compensation | 583,321 | 714,798 | 806,922 | |
| Total Stock-Based Compensation | (1,347,031 | ) | 1,712,361 | 1,804,485 |
| Reconciliation of GAAP Net Operating (Expenses) Income to Non-GAAP Treasury Gains (Losses)(6) (unaudited) | ||||||
| For the Three Months Ended | ||||||
| (Figures in $) | 2025 | 2025 | 2026 | |||
| Net Operating Income (Expenses) | 4,125,685 | (39,958,264 | ) | 8,487,848 | ||
| Add Back: | ||||||
| Research and development expense | 373,855 | 188,954 | 286,764 | |||
| Selling, general and administrative expense | 2,594,130 | 4,530,542 | 4,493,604 | |||
| Provision for credit losses | - | 405,331 | 504,511 | |||
| In-Period Change in unrealized accretion (dilution) expected upon LST to HYPE reconversion | 4,912,082 | (1,412,417 | ) | 7,873,342 | ||
| Subtract: | ||||||
| Accumulated but unrealized staking yield on LSTs(10) | (58,771 | ) | (172,463 | ) | (154,806 | ) |
| Operating Income from airdrops | - | (285,450 | ) | - | ||
| Net gains on derivative instruments | (78,109 | ) | (79,461 | ) | (39,401 | ) |
| Treasury Gains (Losses)(6) | 11,868,872 | (36,783,228 | ) | 21,451,862 | ||
Note: See “Footnotes” section for detailed explanations and definitions.
| Reconciliation of GAAP Total Other Income (Expense), Net to Non-GAAP Adjusted Other Income (Expense)(7) (unaudited) | ||||||
| For the Three Months Ended | ||||||
| (Figures in $) | 2025 | 2025 | 2026 | |||
| Total Other Income (Expense), Net | 2,197,391 | (288 | ) | 108,431 | ||
| Add back: | ||||||
| Interest expense | 223,080 | 224,799 | 225,869 | |||
| Reduction in life sciences liabilities(12) | (2,407,154 | ) | - | (225,173 | ) | |
| Other non-recurring items(13) | (55,557 | ) | (85,158 | ) | 142,415 | |
| Subtract: Interest Income from DeFi Monetization activities | - | (90,636 | ) | (198,957 | ) | |
| Adjusted Other Income (Expense)(7) | (42,240 | ) | 48,717 | 52,585 | ||
Note: See “Footnotes” section for detailed explanations and definitions.
| Reconciliation of GAAP Net Income to Non-GAAP Adjusted EBITDA(8) (unaudited) | ||||||
| For the Three Months Ended | ||||||
| (Figures in $) | 2025 | 2025 | 2026 | |||
| Net Income (Loss) | 6,625,582 | (39,765,565 | ) | 8,840,550 | ||
| Add back: | ||||||
| Stock-based compensation | (1,347,031 | ) | 1,712,361 | 1,804,485 | ||
| Interest expense | 223,080 | 224,799 | 225,869 | |||
| Provision for credit losses | - | 405,331 | 504,511 | |||
| Income Taxes | - | - | ||||
| Depreciation and amortization expense | - | - | ||||
| Reduction in life sciences liabilities(12) | (2,407,154 | ) | - | (225,173 | ) | |
| Other non-recurring items(13) | (55,557 | ) | (85,158 | ) | 142,415 | |
| Add: | ||||||
| In-Period Change in unrealized accretion (dilution) expected upon LST to HYPE reconversion | 4,912,082 | (1,412,417 | ) | 7,873,342 | ||
| Accumulated but unrealized yield enhancement activity(15) | - | - | 171,970 | |||
| Receipt of HPL tokens pursuant to partnership agreements | - | - | 150,163 | |||
| Adjusted EBITDA(8) | 7,951,003 | (38,920,649 | ) | 19,488,132 | ||
Note: See “Footnotes” section for detailed explanations and definitions.
*Does not include Amortization of Operating Lease.
| Reconciliation of GAAP HYPE digital assets, as adjusted to | ||||||
| (Figures in $) | 2025 | 2025 | 2026 | |||
| 77,751,604 | 47,837,901 | 71,037,227 | ||||
| Add: KNTQ & sKNTQ at Carrying Value | - | 111,406 | 193,780 | |||
| Add: HPL & sHPL at Carrying Value | - | - | 149,820 | |||
| Add: Hyperion Rysk Vault Shares at Cost Basis* | - | - | 1,615,075 | |||
| Add: Current Assets | 9,085,767 | 7,245,809 | 8,803,947 | |||
| Subtract: Current Liabilities** | (4,037,092 | ) | (2,701,013 | ) | (4,509,992 | ) |
| Subtract: Notes Payable*** | (8,254,696 | ) | (8,339,366 | ) | (7,416,353 | ) |
| Net Asset Value(9) | 74,545,583 | 44,154,737 | 69,873,504 | |||
Note: See “Footnotes” section for detailed explanations and definitions.
*Digital intangible assets representing claims on USDH held in the Hyperion Rysk Institutional Volatility Income Vault, bearing the technical name “WHYPE-USDH-USDH-P-H-HL”.
**Includes Notes payable - current portion as of
***Non-current portion; does not subtract debt discount of
Footnotes
- “Adjusted Gross Profit” is a non-GAAP measure. Adjusted Gross Profit is defined as all in-period gross profit generated by the Company’s operations excluding buying digital assets and associated mark-to-market price movements. Such activities include staking yield, validator operations, yield enhancement activity, DeFi monetization partnerships, ecosystem rewards, and (prior to 2026) life sciences operations. It is reconciled to the GAAP measure “Gross Profit” by (i) adding accumulated but unrealized staking yield on LSTs, (ii) adding Net gains on derivative instruments, (iii) adding accumulated but unrealized yield enhancement activity as further described in Footnote 15, (iv) adding Operating Income from airdrops, (v) adding the Company’s receipt of HPL tokens pursuant to its partnership agreements with HyperLend, and (vi) adding the portion of GAAP “Interest Income” generated from digital assets receivables. We believe “Adjusted Gross Profit” is a helpful financial measure to our management and investors as it aims to capture all in-period gross profit generated by our active operational strategies without the impact of (i) the temporary GAAP earnings volatility of HYPE to LST conversion and LST to HYPE reconversion, (ii) the temporary GAAP earnings volatility of depositing and redeeming USDH versus Hyperion Rysk Vault Shares and delays in recognition of upfront received premium on expired sold HYPE put and call options, (iii) the over-time GAAP recognition of the Company’s receipt of HPL tokens, and (iv) dispersed GAAP presentment of our operational strategies across various Statements of Operations sections, or (iv) the impacts of realized or unrealized gains or losses on our digital assets. We believe Adjusted Gross Profit is a critical metric to quantify and compare our core operational activities between periods. In the Company’s earnings release and earnings supplement for three months ended
September 30, 2025 andDecember 31, 2025 , we previously reconciled Non-GAAP “Adjusted Gross Profit” to GAAP “Revenue”. Given changes in GAAP presentment related to staking and validating activities, we believe for the three months endedMarch 31, 2026 , the closest comparable GAAP metric to Adjusted Gross Profit is Gross Profit. - The following are unaudited supplemental operating disclosures: Gross HYPE Tokens, the number of HYPE tokens staked at the Kinetiq x Hyperion Validator, Validator Commissions in HYPE, Staking Yield in HYPE, and HYPE Earned in Staking & Validating.
- Calculated as the sum of the in-period Non-GAAP Adjusted Gross Profit components of (a) Validator Commissions plus (b) Staking Yield (such figures being expressed in-period in US Dollars), divided by the sum of (c) Validator Commissions in HYPE plus (d) Staking Yield in HYPE.
- “Gross HYPE Holdings” is a non-GAAP measure.
Gross HYPE Holdings is defined as the gross market value of the Company’s HYPE assuming (a) all temporary HYPE token use agreements are exited, (b) all collateralized OTC HYPE derivatives are exited (and such LST collateral returned to the Company), and (c) all LSTs were converted back to HYPE tokens as of the end of each respective reporting quarter. It is reconciled to the GAAP measure “HYPE digital assets” by adding (i) HYPE digital assets receivable (without subtracting allowance for credit loss or unamortized nonrefundable upfront fees), (ii) HYPE digital intangible assets receivable (without subtracting allowance for credit loss), (iii) HYPE LSTs at carrying value (including without limitation HiHYPE, kHYPE, and kmHYPE) and (iv) the unrealized accretion (dilution) expected upon LST to HYPE reconversion as of the end of each respective reporting quarter. We believeGross HYPE Holdings is a helpful non-GAAP financial measure to our management and investors because it eliminates the temporary HYPE value impacts caused by our DeFi Monetization and Yield Enhancement token movements as well as the conversion and reconversion between HYPE tokens and LSTs, which (a) causes staking yield on our LSTs not to be recognized in-period in accordance with GAAP and (b) does not recognize upward mark-to-market movements in underlying HYPE tokens given LSTs are carried at the lower of cost basis or impaired value. As such, it provides useful information about our balance sheet, allows for greater transparency with respect to important metrics used by our management for financial, risk management and operational decision-making, and provides an additional tool for investors to understand and compare our operating results across reporting periods. - "Operating Expenses Excluding Stock-Based Compensation" is a non-GAAP measure. Operating Expenses Excluding Stock-Based Compensation is defined as the Company's operational expenses in-period excluding treasury value movements and stock-based compensation. It is reconciled to the GAAP measure “Selling, general and administrative expense” by (i) subtracting stock-based compensation expense and (ii) adding Research and development expense. Operating Expenses Excluding Stock-Based Compensation provides a metric of total operating expenditures in-period without the impact of treasury value movement or stock-based compensation, thereby creating a helpful metric for operational expense comparisons between different periods for our management and investors.
- "Treasury Gains (Losses)" is a non-GAAP measure. Treasury Gains (Losses) is defined as the gross mark-to-market change in the company's digital asset treasury portfolio each period, without accounting for temporary GAAP impacts due to HYPE to LST conversion (or LST to HYPE reconversion) or operating income driven by airdrops or yield enhancement activity. It is reconciled to the GAAP measure “Net Operating Income (Expenses)" by (a) adding (i) Research and development expense, (ii) Selling, general, and administrative expense, (iii) Provision for credit losses, and (iv) the in-period change in unrealized accretion (dilution) expected upon LST to HYPE reconversion, and (b) subtracting (i) accumulated but unrealized staking yield on LSTs, (ii) Operating Income from airdrops, and (iii) Net gains on derivative instruments. Following these adjustments, Treasury Gains (Losses) is a singular metric that can present mark-to-market treasury changes in isolation, which we believe is a helpful metric for management and investors given our large digital asset treasury position and the volatile nature of digital assets.
- "Adjusted Other Income (Expense)" is a non-GAAP measure. Adjusted Other Income (Expense) reflects management’s view of recurring activities outside of core operating income and operating expenses. It is reconciled to the GAAP measure "Total Other Income (Expense), Net" by (a) adding back (i) interest expense, (ii) non-recurring gains from reductions in life sciences liabilities, and (iii) other non-recurring items which we do not consider material in nature, and (b) subtracting the portion of GAAP “Interest Income” generated from digital assets receivables. The items added back to Adjusted Other Income (Expense) are excluded because they are non-cash in nature, or because the amount and timing of these items are unpredictable, are not driven by core results of operations, and render comparisons with prior periods and competitors less meaningful. The item subtracted from Adjusted Other Income (Expense) is already captured in the Non-GAAP metric “Adjusted Gross Profit”, as further described in Footnote 1. We believe Adjusted Other Income (Expense) provides a helpful view to management and investors regarding recurring and ongoing income and expense items outside of operating income and operating expenses, presented in a way to compare these elements over time.
- “Adjusted EBITDA” is a non-GAAP measure. Adjusted EBITDA is meant to reflect management’s view of recurring business activities and a more comparable view of the mark-to-market impacts on our digital asset treasury holdings in-period. It is reconciled to the GAAP measure “Net Income (Loss)” by removing (i) stock-based compensation, (ii) interest expense, (iii) provision for credit losses, (iv) income taxes, (v) depreciation and amortization expense (excluding amortization of operating lease), (vi) non-recurring gains from reductions in life sciences liabilities, and (vii) other non-recurring items which we do not consider material in nature; and, it adds in (i) the in-period change in unrealized accretion (dilution) expected upon LST to HYPE reconversion, (ii) accumulated but unrealized yield enhancement activity as further described in Footnote 15, and (iii) the Company’s receipt of HPL tokens pursuant to its partnership agreements with HyperLend. The items excluded from our Adjusted EBITDA are excluded because they are non-cash in nature, or because the amount and timing of these items are unpredictable, are not driven by core results of operations, and render comparisons with prior periods and competitors less meaningful. The items added to Adjusted EBITDA are included to give a more complete picture of our in-period operations and mark-to-market impacts on our digital assets, disregarding (i) the temporary GAAP earnings volatility of HYPE to LST conversion and LST to HYPE reconversion, (ii) the temporary GAAP earnings volatility of depositing and redeeming USDH versus Hyperion Rysk Vault Shares and delays in recognition of upfront received premium on expired sold HYPE put and call options, and (iii) the over-time GAAP recognition of the Company’s receipt of HPL tokens. Adjusted EBITDA is used by management, in addition to GAAP financial measures, to understand and compare our operating results across accounting periods, for risk management and operational decision-making purposes. This non-GAAP measure provides investors with additional information in evaluating the Company's operating performance.
- “Net Asset Value” is a non-GAAP measure. Net Asset Value is defined as the market value of our marketable digital assets less net outstanding debt. It is reconciled to the GAAP measure “HYPE digital assets” as adjusted to “Gross HYPE Holdings” (described more fully in Footnote 4) by (i) adding KNTQ digital assets and sKNTQ digital intangible assets at carrying value, (ii) adding HPL digital assets and sHPL digital intangible assets at carrying value, (iii) adding Hyperion Rysk Vault Shares at cost basis, (iv) adding Current Assets, (v) subtracting Current Liabilities (including current portion of Notes Payable, without subtracting corresponding debt discounts or any unamortized issuance expenses), and (vi) subtracting Notes Payable (Non-current portion, without subtracting corresponding debt discounts or any unamortized issuance expenses). We believe Net Asset Value is a helpful non-GAAP financial measure to our management and investors because it provides a more complete picture of our net liquid and marketable assets. It does not include Other digital intangible assets which may not be immediately marketable. It does not include other non-current assets or non-current liabilities beyond the aforementioned items. The Company believes Net Asset Value provides useful information about our balance sheet and financial performance, enhances the overall understanding of our past performance and future prospects, allows for greater transparency with respect to important metrics used by our management for financial, risk management and operational decision-making, and provides an additional tool for investors to use to understand and compare our operating results across accounting periods.
- Represents in-period accrued staking yield on HYPE LSTs. Staking yield on LSTs is not recognized in-period in accordance with GAAP; instead, LST staking yield may be recognized with an associated realized gain upon future reconversion from LSTs back into HYPE.
- Represents the estimated future financial implications if all company-owned LSTs were reconverted to HYPE at the end of each respective period. Encapsulates both the temporary GAAP valuation methodology differences between LSTs and HYPE plus the realization of previously accrued but unrecognized staking yield on LSTs.
- In the three months ended
September 30, 2025 , Gain on extinguishment of liability and a reduction in accrued liability within other income was approximately$2.2 million and$0.2 million respectively, combined totaling$2.4 million . In the three months endedMarch 31, 2026 , gain on extinguishment of liabilities within Other income (expense), net totaled$0.2 million . - In the reconciliation of “Total Other Income (Expense), Net” to “Adjusted Other Income (Expense)”, as well as in the reconciliation of “Net Income (Loss)” to “Adjusted EBITDA”, in the three months ended
September 30, 2025 , other non-recurring items include gains on sales of equipment, release of reserves held against potential returns of company-sold items, and a one-time realized payment in connection with a terminated LOI. In the three months endedDecember 31, 2025 andMarch 31, 2026 , other non-recurring items include gains and losses due to valuation differences in the time between contractual and actual delivery dates on certain company-paid expenses denominated in HYPE and in Company equity. - Estimated and unaudited figures as of
May 11, 2026 . - Includes all net cash, cash equivalents, and USDH premiums received but unrealized on expired sold HYPE puts and calls, including within the Hyperion Rysk Vault, as well as third-party fees on yield enhancement activities (such third-party fees being included in DeFi Monetization within Non-GAAP Adjusted Gross Profit).
- Includes Hyperion Rysk Vault Shares, which are redeemable into USDH.
A photo accompanying this announcement is available at https://www.globenewswire.com/NewsRoom/AttachmentNg/ddd4c6f1-b02c-49f1-90c3-46e511620d60


Hyperion Generates Independent, Scaling Businesses on Hyperliquid