Fourth Quarter 2025 Operational and Financial Highlights:
- Loan facilitation volume1 was
RMB24.2 billion (US$3.5 billion ), representing a decrease of 12.6% from the same period of 2024.
- Average borrowing amount per borrowing was
RMB9,846 (US$1,408 ), representing an increase of 26.1% from the same period of 2024.
- Repeat borrowing contribution2 was 79.4% compared with 72.7% in the same period of 2024.
- 90 day+ delinquency ratio3 was 2.03% as of
December 31, 2025 .
- Net revenue was
RMB1,090.2 million (US$155.9 million ), representing a decrease of 22.4% from the same period of 2024.
- Income from operation was
RMB94.6 million (US$13.5 million ), compared withRMB392.6 million in the same period of 2024.
- Non-GAAP4 income from operation was
RMB120.4 million (US$17.2 million ), compared withRMB402.4 million in the same period of 2024.
- Net income was
RMB100.6 million (US$14.4 million ), compared withRMB275.5 million in the same period of 2024.
1 “Loan facilitation volume” refers to the loan facilitation volume facilitated in Chinese Mainland during the period presented.
2 “Repeat borrower contribution” for a given period refers to the percentage of loan facilitation volume in Chinese Mainland attributable to repeat borrowers during that period.
“Repeat borrowers” during a certain period refers to borrowers who have borrowed in such period and have borrowed at least twice since such borrowers’ registration on our platform until the end of such period.
3 “90 day+ delinquency ratio” refers to the outstanding principal balance of loans that were 91 to 180 calendar days past due as a percentage of the total outstanding principal balance of loans facilitated through the Company’s platform as of a specific date. Loans facilitated outside Chinese Mainland are not included in the calculation.
4 Please see the section entitled “Use of Non-GAAP Financial Measure” below and the table captioned “Unaudited Reconciliations of GAAP and Non-GAAP Results” set forth at the end of this press release.
Full Year 2025 Operational and Financial Highlights:
- Loan facilitation volume1 was
RMB129.0 billion (US$18.4 billion ), representing an increase of 28.0% fromRMB100.8 billion in 2024.
- Average borrowing amount per borrowing was
RMB8,601 (US$1,230 ), compared withRMB8,536 in 2024.
- Repeat borrowing contribution2 was 76.0% compared with 74.2% in 2024.
- Net revenue was
RMB6,222.2 million (US$889.8 million ), compared withRMB5,801.0 million in 2024.
- Income from operation was
RMB1,797.3 million (US$257.0 million ), compared withRMB1,248.0 million in 2024.
- Non-GAAP3 income from operation was
RMB1,955.3 million (US$279.6 million ), compared withRMB1,307.1 million in 2024.
- Net income was
RMB1,535.7 million (US$219.6 million ), compared withRMB1,056.5 million in 2024.
1 “Loan facilitation volume” refers to the loan facilitation volume facilitated in Chinese Mainland during the period presented.
2 “Repeat borrower contribution” for a given period refers to the percentage of loan facilitation volume in Chinese Mainland attributable to repeat borrowers during that period.
“Repeat borrowers” during a certain period refers to borrowers who have borrowed in such period and have borrowed at least twice since such borrowers’ registration on our platform until the end of such period.
3 Please see the section entitled “Use of Non-GAAP Financial Measure” below and the table captioned “Unaudited Reconciliations of GAAP and Non-GAAP Results” set forth at the end of this press release.
Mr.
Looking back on 2025, we remained firmly committed to our ‘Compliance-First’ principle, refined domestic operations with AI-driven risk management to focus on higher-quality borrower segments and deepened our overseas business development, driving rapid growth in its business scale. Full year loan facilitation volume amounted to
Moving forward, in light of the evolving regulatory landscape, we remain committed to enhancing operational resilience through prudent risk management and disciplined cost control. We believe this strategic combination of domestic efficiency and geographic diversification will build a sustainable competitive advantage over the long term.”
Fourth Quarter 2025 Financial Results
Net revenue was
Revenue from loan facilitation services was
Revenue from releasing of guarantee liabilities was
Other revenue was
Facilitation and servicing expense was
Reversal of credit losses of uncollectible assets, loans receivable and others was
Sales and marketing expense was
General and administrative expense was
Research and development expense was
Income from operation was
Non-GAAP income from operation was
Net income was
Basic and diluted net income per share were both
Cash and cash equivalents were
Full Year 2025 Financial Results
Net revenue was
Revenue from loan facilitation services was
Revenue from releasing of guarantee liabilities was
Other revenue was
Facilitation and servicing expense was
Allowance for credit losses of uncollectible assets, loans receivable and others was
Sales and marketing expense was
General and administrative expense was
Research and development expense was
Income from operation was
Non-GAAP income from operation was
Net income was
Basic and diluted net income per share were both
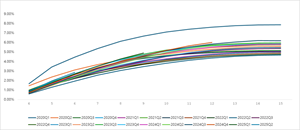
The following chart and table display the historical cumulative M3+ Delinquency Rate by Vintage for loan products facilitated through the Company’s platform in Chinese Mainland.

Business Outlook
The Company expects its loan facilitation volume for the first quarter of 2026 to be in the range of
Regulatory Update
On
Management believes that the Company’s operating results could be affected as a result of the regulatory update. The magnitude of such impact is subject to significant uncertainty given the unpredictability of the regulatory landscape and the uncertainties inherent in the macroeconomic environment. While near-term uncertainty may persist, the Company believes these regulatory updates will support a more sustainable long-term trajectory.
Share Repurchase Plan Update
In
As of
Dividend Policy
On
On
Conference Call
The Company will conduct a conference call to discuss its financial results on
To join the conference call, all participants must use the following link to complete the online registration process in advance. Upon registering, each participant will receive access details for this event including the dial-in numbers, a PIN number, and an e-mail with detailed instructions to join the conference call.
Participant Online Registration:
https://register-conf.media-server.com/register/BI7efbea42ba194f0fb2d0443d8e2b4ffe
A live and archived webcast of the conference call will be available on the Company’s investors relations website at http://ir.jiayintech.cn/.
About
Use of Non-GAAP Financial Measure
We use non-GAAP income from operation, which is a non-GAAP financial measure, in evaluating our operating results and for financial and operational decision-making purposes. We believe that the non-GAAP financial measure helps identify underlying trends in our business by excluding the impact of share-based compensation expenses. We believe that non-GAAP financial measure provides useful information about our operating results, enhances the overall understanding of our past performance and future prospects and allows for greater visibility with respect to key metrics used by our management in its financial and operational decision-making.
Non-GAAP income from operation represents income from operation excluding share-based compensation expenses.
Non-GAAP income from operation is not defined under
For more information on this non-GAAP financial measure, please see the table captioned “Unaudited Reconciliations of GAAP and Non-GAAP results” set forth at the end of this press release.
Exchange Rate Information
This announcement contains translations of certain RMB amounts into
Safe Harbor / Forward-Looking Statements
This announcement contains forward-looking statements. These statements are made under the “safe harbor” provisions of the United States Private Securities Litigation Reform Act of 1995. These forward-looking statements can be identified by terminology such as “will,” “expects,” “anticipates,” “future,” “intends,” “plans,” “believes,” “estimates” and similar statements. The Company may also make written or oral forward-looking statements in its periodic reports to the
For investor and media inquiries, please contact:
Ms.
Email: ir@jiayinfintech.cn
UNAUDITED CONDENSED CONSOLIDATED BALANCE SHEETS (Amounts in thousands, except for share and per share data) | ||||||
| As of | As of | |||||
| 2024 | 2025 | |||||
| RMB | RMB | US$ | ||||
| ASSETS | ||||||
| Cash and cash equivalents | 540,523 | 61,837 | 8,843 | |||
| Restricted cash | 137,332 | 413,601 | 59,144 | |||
| Accounts receivable and contract assets, net | 2,991,166 | 3,732,677 | 533,766 | |||
| Financial assets receivable, net | 293,483 | 601,600 | 86,028 | |||
| Prepaid expenses and other current assets, net | 377,978 | 2,121,404 | 303,356 | |||
| Deferred tax assets, net | 72,405 | 96,534 | 13,804 | |||
| Property and equipment, net | 44,397 | 1,326,943 | 189,750 | |||
| Right-of-use assets | 52,759 | 31,195 | 4,461 | |||
| Long-term investments, net | 162,267 | 302,077 | 43,196 | |||
| Other non-current assets | 737,583 | 68,097 | 9,738 | |||
| TOTAL ASSETS | 5,409,893 | 8,755,965 | 1,252,086 | |||
| LIABILITIES AND EQUITY | ||||||
| Deferred guarantee income | 229,503 | 458,903 | 65,622 | |||
| Contingent guarantee liabilities | 213,644 | 617,588 | 88,314 | |||
| Payroll and welfare payables | 144,065 | 210,367 | 30,082 | |||
| Tax payables | 687,034 | 1,054,527 | 150,795 | |||
| Accrued expenses and other liabilities | 956,356 | 1,282,524 | 183,399 | |||
| Bank borrowings | — | 671,043 | 95,958 | |||
| Lease liabilities | 51,677 | 29,587 | 4,231 | |||
| TOTAL LIABILITIES | 2,282,279 | 4,324,539 | 618,401 | |||
| TOTAL SHAREHOLDERS' EQUITY | 3,127,614 | 4,431,426 | 633,685 | |||
| TOTAL LIABILITIES AND EQUITY | 5,409,893 | 8,755,965 | 1,252,086 | |||
UNAUDITED CONDENSED CONSOLIDATED STATEMENTS OF COMPREHENSIVE INCOME (Amounts in thousands, except for share and per share data) | ||||||||||||||||||
| For the Three Months Ended | For the Year Ended | |||||||||||||||||
| 2024 | 2025 | 2024 | 2025 | |||||||||||||||
| RMB | RMB | US$ | RMB | RMB | US$ | |||||||||||||
| Net revenue | 1,404,493 | 1,090,198 | 155,896 | 5,801,032 | 6,222,190 | 889,761 | ||||||||||||
| Operating costs and expenses: | ||||||||||||||||||
| Facilitation and servicing | (339,323 | ) | (328,180 | ) | (46,929 | ) | (2,033,511 | ) | (1,235,767 | ) | (176,712 | ) | ||||||
| (Allowance for) Reversal of credit losses of uncollectible assets, loans receivable and others | (1,211 | ) | 20,061 | 2,869 | (12,204 | ) | (31,520 | ) | (4,507 | ) | ||||||||
| Sales and marketing | (517,208 | ) | (498,717 | ) | (71,316 | ) | (1,913,868 | ) | (2,427,979 | ) | (347,196 | ) | ||||||
| General and administrative | (53,683 | ) | (66,791 | ) | (9,551 | ) | (220,993 | ) | (302,470 | ) | (43,253 | ) | ||||||
| Research and development | (100,427 | ) | (121,925 | ) | (17,435 | ) | (372,441 | ) | (427,125 | ) | (61,078 | ) | ||||||
| Total operating costs and expenses | (1,011,852 | ) | (995,552 | ) | (142,362 | ) | (4,553,017 | ) | (4,424,861 | ) | (632,746 | ) | ||||||
| Income from operation | 392,641 | 94,646 | 13,534 | 1,248,015 | 1,797,329 | 257,015 | ||||||||||||
| Loss from disposal of subsidiaries | (14,431 | ) | — | — | (14,431 | ) | — | — | ||||||||||
| Impairment of long-term investments | (51,923 | ) | — | — | (51,923 | ) | — | — | ||||||||||
| Interest income, net | 9,113 | 1,073 | 153 | 18,281 | 8,945 | 1,279 | ||||||||||||
| Other income, net | 20,459 | 5,444 | 778 | 95,426 | 67,111 | 9,597 | ||||||||||||
| Income before income taxes | 355,859 | 101,163 | 14,465 | 1,295,368 | 1,873,385 | 267,891 | ||||||||||||
| Income tax expense | (80,341 | ) | (532 | ) | (76 | ) | (238,900 | ) | (337,652 | ) | (48,284 | ) | ||||||
| Net income | 275,518 | 100,631 | 14,389 | 1,056,468 | 1,535,733 | 219,607 | ||||||||||||
| Less: Net income attributable to non-controlling interests | (6 | ) | — | — | (10 | ) | (9 | ) | (1 | ) | ||||||||
| Net income attributable to | 275,524 | 100,631 | 14,389 | 1,056,478 | 1,535,742 | 219,608 | ||||||||||||
| Weighted average shares used in calculating net income per share: | ||||||||||||||||||
| - Basic and diluted | 212,589,379 | 206,173,619 | 206,173,619 | 212,433,169 | 208,900,211 | 208,900,211 | ||||||||||||
| Net income per share: | ||||||||||||||||||
| - Basic and diluted | 1.30 | 0.49 | 0.07 | 4.97 | 7.35 | 1.05 | ||||||||||||
| Net income per ADS: | ||||||||||||||||||
| - Basic and diluted | 5.20 | 1.96 | 0.28 | 19.88 | 29.40 | 4.20 | ||||||||||||
| Net income | 275,518 | 100,631 | 14,389 | 1,056,468 | 1,535,733 | 219,607 | ||||||||||||
| Other comprehensive income (loss), net of tax of nil | ||||||||||||||||||
| Fair value changes and foreign currency translation adjustments | 6,720 | 1,991 | 285 | (3,171 | ) | 3,862 | 552 | |||||||||||
| Comprehensive income | 282,238 | 102,622 | 14,674 | 1,053,297 | 1,539,595 | 220,159 | ||||||||||||
| Comprehensive income attributable to non-controlling interests | 34 | 25 | 4 | 21 | 101 | 14 | ||||||||||||
| Total comprehensive income attributable to | 282,204 | 102,597 | 14,670 | 1,053,276 | 1,539,494 | 220,145 | ||||||||||||
UNAUDITED RECONCILIATIONS OF GAAP AND NON-GAAP RESULTS (Amounts in thousands, except for share and per share data) | ||||||||||||||
| For the Three Months Ended | For the Year Ended | |||||||||||||
| 2024 | 2025 | 2024 | 2025 | |||||||||||
| RMB | RMB | US$ | RMB | RMB | US$ | |||||||||
| Reconciliation of Non-GAAP income from operation to Income from operation | ||||||||||||||
| Income from operation | 392,641 | 94,646 | 13,534 | 1,248,015 | 1,797,329 | 257,015 | ||||||||
| Add: share-based compensation expenses | 9,778 | 25,736 | 3,680 | 59,122 | 157,938 | 22,585 | ||||||||
| Non-GAAP income from operation | 402,419 | 120,382 | 17,214 | 1,307,137 | 1,955,267 | 279,600 | ||||||||
A photo accompanying this announcement is available at https://www.globenewswire.com/NewsRoom/AttachmentNg/b6b18b82-e229-4e30-af4f-1ab696a8824d


The historical cumulative M3+ Delinquency Rate by Vintage for loan products facilitated through the Company’s platform in Chinese Mainland.