Delivered on all key guidance metrics, maintains three-year outlook of 2.0 million Au eq. oz. per year
Record free cash flow of
Targeting 40% of free cash flow in return of capital to shareholders in 2026
This news release contains forward-looking information about expected future events and financial and operating performance of the Company. We refer to the risks and assumptions set out in our Cautionary Statement on Forward-Looking Information located on pages 41 and 42 of this release. All dollar amounts are expressed in
2025 full-year results and 2026 guidance:
| 2025 guidance (+/- 5%) | Q4 2025 results | 2025 full-year results | 2026 guidance (+/- 5%) | |
| Gold equivalentproduction1 (ounces) | 2.0 million | 483,582 | 2.0 million | 2.0 million |
| Production cost of sales2 Attributable production cost of sales1 | - | - | ||
| ($ per Au eq. oz.) | ||||
| Attributable all-in sustaining cost1 ($ per Au eq. oz.) | ||||
| Capital expenditures3 Attributablecapital expenditures1 | - | - | ||
| (million) |
- Kinross has forecasted stable production guidance of approximately 2.0 million attributable Au eq. oz. (+/- 5%) in 2027 and 2028.
Record Q4 and full-year highlights:
- Margins4 of
$2,847 per Au eq. oz. sold in Q4 2025, and$2,283 for 2025. - Operating cash flow5 of
$1,146.9 million in Q4 2025, and$3,760.5 million in 2025. - Attributable free cash flow1 of
$769.4 million in Q4 2025 and$2,473.5 million in 2025. - Reported net earnings6 of
$906.5 million in Q4 2025, or$0.75 per share, and$2,390.1 million , or$1.96 per share, in 2025. - Adjusted net earnings7, 8 of
$809.3 million , or$0.67 per share in Q4 2025, and$2,243.9 million , or$1.84 per share, in 2025. - In 2025, Kinross returned
$752.4 million to shareholders through its share buyback program and dividend. This included repurchasing$600.3 million in shares, and a 17% increase to its dividend during the year. In 2026, Kinross is targeting 40% of free cash flow to return of capital through both share buybacks and dividends. - Kinross’ Board of Directors has approved an additional 14% increase to its quarterly dividend to
$0.04 per common share, which would amount to$0.16 per common share on an annualized basis. This represents a total increase of 33% since Q3 2025. - The Company continued to prioritize debt reduction and repaid
$700 million in 2025. Kinross had net cash9 of$1,004.1 million , with$1,742.3 million of cash and cash equivalents and total liquidity10 of$3.5 billion as atDecember 31, 2025 .
Operational highlights:
- Tasiast was the highest-margin operation in the portfolio.
- Paracatu produced over 600,000 gold ounces (“Au oz.”), which is the 8th consecutive year over 500,000 Au oz.
- La Coipa had a strong fourth quarter with higher mill throughput and met full-year production guidance.
U.S. Operations had another solid year, with production and costs on plan.
Development project and mineral reserves and resources highlights:
- Proceeding to construction at Phase X, Kettle River-Curlew (“Curlew”) and Redbird 2. Read more here.
- At Great Bear, surface construction for the Advanced Exploration (“AEX”) program is 80% complete. For the
Main Project , detailed engineering is approximately 35% complete, and the final phase of the federal Impact Statement submission is planned for the end of Q1 2026. - At Lobo-Marte, Kinross completed baseline studies and plans to submit its Environmental Impact Assessment (“EIA”) by Q2 2026. Kinross also plans to provide a project update later this year.
- Reserves and Resources: Kinross added 1.2 million Au oz. (“Moz.”) to proven and probable mineral reserves, partially offsetting production depletion. Kinross increased measured and indicated resource estimates to 27.5 Moz. and increased inferred resource estimates to 16.6 Moz.
CEO Commentary:
“2025 marked another excellent year for Kinross. We met our guidance once again, delivered robust margins, and generated record free cash flow of
“We recently announced that we are proceeding with three
“We are carrying strong momentum into 2026 and are forecasting another strong year of production of approximately 2.0 million gold equivalent ounces. Our focus will be on margins and cash flow as we continue to hold the line on controllable costs while maintaining capital discipline as we execute on our grade enhancement strategy. We are planning to continue with our capital allocation strategy by reinvesting in our business, further strengthening our balance sheet, and returning capital to our shareholders. This includes investing an additional
Financial results
Summary of financial and operating results
| Three months ended | Years ended | |||||||||||
| (in millions of | 2025 | 2024 | 2025 | 2024 | ||||||||
| Operating Highlights(a) | ||||||||||||
| Total gold equivalent ounces(b) | ||||||||||||
| Produced | 489,671 | 514,355 | 2,069,910 | 2,170,791 | ||||||||
| Sold | 487,972 | 531,729 | 2,059,017 | 2,153,212 | ||||||||
| Attributable gold equivalent ounces(b) | ||||||||||||
| Produced | 483,582 | 501,209 | 2,012,106 | 2,128,052 | ||||||||
| Sold | 481,560 | 517,980 | 2,000,535 | 2,111,688 | ||||||||
| Gold ounces - sold | 479,347 | 522,389 | 2,026,570 | 2,100,621 | ||||||||
| Silver ounces - sold (000's) | 659 | 791 | 2,830 | 4,467 | ||||||||
| Earnings(a) | ||||||||||||
| Metal sales | $ | 2,023.0 | $ | 1,415.8 | $ | 7,051.1 | $ | 5,148.8 | ||||
| Production cost of sales | $ | 632.7 | $ | 583.8 | $ | 2,346.4 | $ | 2,197.1 | ||||
| Depreciation, depletion and amortization | $ | 268.3 | $ | 284.8 | $ | 1,105.0 | $ | 1,147.5 | ||||
| Impairment reversal | $ | (116.1 | ) | $ | - | $ | (116.1 | ) | $ | (74.1 | ) | |
| Operating earnings | $ | 1,122.3 | $ | 501.1 | $ | 3,277.6 | $ | 1,540.3 | ||||
| Net earnings attributable to common shareholders | $ | 906.5 | $ | 275.6 | $ | 2,390.1 | $ | 948.8 | ||||
| Net earnings per share attributable to common shareholders (basic) | $ | 0.75 | $ | 0.22 | $ | 1.96 | $ | 0.77 | ||||
| Net earnings per share attributable to common shareholders (diluted) | $ | 0.75 | $ | 0.22 | $ | 1.95 | $ | 0.77 | ||||
| Adjusted net earnings(c) | $ | 809.3 | $ | 240.0 | $ | 2,243.9 | $ | 838.3 | ||||
| Adjusted net earnings per share(c) | $ | 0.67 | $ | 0.20 | $ | 1.84 | $ | 0.68 | ||||
| Cash Flow(a) | ||||||||||||
| Net cash flow provided from operating activities | $ | 1,146.9 | $ | 734.5 | $ | 3,760.5 | $ | 2,446.4 | ||||
| Attributable adjusted operating cash flow(c) | $ | 1,136.0 | $ | 677.0 | $ | 3,605.2 | $ | 2,293.9 | ||||
| Capital expenditures(d) | $ | 368.2 | $ | 280.7 | $ | 1,194.2 | $ | 1,075.5 | ||||
| Attributable capital expenditures(c) | $ | 361.7 | $ | 278.8 | $ | 1,175.2 | $ | 1,050.9 | ||||
| Attributable free cash flow(c) | $ | 769.4 | $ | 434.4 | $ | 2,473.5 | $ | 1,340.2 | ||||
| Per Ounce Metrics(a) | ||||||||||||
| Average realized gold price per ounce(e) | $ | 4,144 | $ | 2,663 | $ | 3,423 | $ | 2,393 | ||||
| Attributable average realized gold price per ounce(c) | $ | 4,144 | $ | 2,665 | $ | 3,426 | $ | 2,391 | ||||
| Production cost of sales per equivalent ounce sold(b)(f) | $ | 1,297 | $ | 1,098 | $ | 1,140 | $ | 1,020 | ||||
| Attributable production cost of sales per equivalent ounce sold(b)(c) | $ | 1,289 | $ | 1,096 | $ | 1,135 | $ | 1,021 | ||||
| Attributable production cost of sales per ounce sold on a by-product basis(c) | $ | 1,235 | $ | 1,069 | $ | 1,096 | $ | 988 | ||||
| Attributable all-in sustaining cost per equivalent ounce sold(b)(c) | $ | 1,825 | $ | 1,510 | $ | 1,571 | $ | 1,388 | ||||
| Attributable all-in sustaining cost per ounce sold on a by-product basis(c) | $ | 1,781 | $ | 1,490 | $ | 1,539 | $ | 1,365 | ||||
| Attributable all-in cost per equivalent ounce sold(b)(c) | $ | 2,343 | $ | 1,868 | $ | 1,989 | $ | 1,739 | ||||
| Attributable all-in cost per ounce sold on a by-product basis(c) | $ | 2,308 | $ | 1,854 | $ | 1,964 | $ | 1,725 | ||||
| (a) | All measures and ratios include 100% of the results from |
| (b) | “Gold equivalent ounces” include silver ounces produced and sold converted to a gold equivalent based on a ratio of the average spot market prices for the commodities for each period. The ratio for the fourth quarter and full year 2025 was 76.34:1 and 86.29:1, respectively (fourth quarter and full year 2024 – 84.67:1 and 84.43:1, respectively). |
| (c) | The definition and reconciliation of these non-GAAP financial measures and ratios is included on pages 27 to 33 of this news release. Non-GAAP financial measures and ratios have no standardized meaning under IFRS and therefore, may not be comparable to similar measures presented by other issuers. |
| (d) | “Capital expenditures” is “Additions to property, plant and equipment” on the consolidated statements of cash flows. |
| (e) | “Average realized gold price per ounce” is defined as gold revenue divided by total gold ounces sold. |
| (f) | “Production cost of sales per equivalent ounce sold” is defined as production cost of sales divided by total gold equivalent ounces sold. |
The following operating and financial results are based on fourth-quarter and full-year 2025 gold equivalent production:
Production: Kinross produced 483,582 Au eq. oz. in Q4 2025, compared with 501,209 Au eq. oz. in Q4 2024.
Over the full year, Kinross produced 2,012,106 Au eq. oz., compared with full-year 2024 production of 2,128,052 Au eq. oz.
Average realized gold price11: The average realized gold price in Q4 2025 was
Revenue: During the fourth quarter, revenue increased to
Production cost of sales: Production cost of sales per Au eq. oz.2 sold was
Attributable production cost of sales per Au eq. oz.1 sold was
Attributable production cost of sales per Au oz. sold on a by-product basis1 was
Attributable production cost of sales per Au oz. sold on a by-product basis1 was
Margins4: Kinross delivered record margins in both comparable periods. Margins per Au eq. oz. sold increased by 82% to
Attributable all-in sustaining cost1: Attributable all-in sustaining cost per Au eq. oz. sold was
In Q4 2025, attributable all-in sustaining cost per Au oz. sold on a by-product basis1 was
Operating cash flow5: Kinross delivered record operating cash flow in both comparable periods. Operating cash flow was
Kinross delivered record attributable adjusted operating cash flow in both comparable periods. Attributable adjusted operating cash flow1 for Q4 2025 was
Attributable free cash flow1: Kinross delivered record attributable free cash flow in both comparable periods. Attributable free cash flow of
Earnings6: Kinross delivered record earnings in both comparable periods. Reported net earnings were
Kinross delivered record adjusted net earnings in both comparable periods. Adjusted net earnings7, 8 were
Capital expenditures3: Capital expenditures were
Attributable capital expenditures1 were
Balance sheet
During the quarter, Kinross repaid its outstanding 4.50% Senior Notes, which had an aggregate principal amount of
Moody’s Investors Service upgraded the senior unsecured rating of Kinross to Baa2 (stable) from Baa3 (positive).
As of
The Company had additional available credit12 of
Capital allocation
In 2025, Kinross returned
Kinross will continue to maintain its disciplined approach to capital allocation, including strengthening its balance sheet, investing in its business and project pipeline, and returning capital to shareholders. The
Kinross’ Board of Directors has also approved a further 14% increase to the quarterly dividend to
Operating results
Mine-by-mine summaries for 2025 fourth-quarter and full-year operating results may be found on pages 21 and 25 of this news release. Highlights include the following:
Tasiast delivered on its annual production and cost guidance. Primarily due to planned lower grades, full-year production decreased compared with 2024. Quarter-over-quarter production increased primarily due to higher grades. Cost of sales per ounce sold increased compared with 2024 and quarter-over-quarter primarily due to higher royalties driven by higher gold prices.
During the quarter, the Company successfully finalized a five-year collective labour agreement at Tasiast.
Paracatu performed well in 2025 as full-year production increased and cost of sales per ounce sold decreased compared with 2024 primarily due to the higher production. The higher production was a result of planned higher grades, higher recoveries and the timing of ounces processed through the mill, partially offset by a decrease in throughput.
Production increased quarter-over-quarter due to higher grades, higher recoveries and the timing of ounces processed through the mill, partially offset by lower throughput, consistent with mine plan sequencing. Cost of sales per ounce sold increased quarter-over-quarter due to lower throughput and higher royalties driven by higher gold prices.
La Coipa delivered on its full-year production guidance and had its strongest quarter of the year with increased throughput through the mill. Primarily as a result of planned mine sequencing, full-year production decreased compared with 2024. Quarter-over-quarter production increased primarily due to stronger mill throughput. Full-year cost of sales per ounce sold was higher mainly due to higher royalties, labour and contractor costs. Cost of sales per ounce sold decreased quarter-over-quarter mainly as a result of the increase in production. Kinross continues to progress permitting work for mine life extensions at the operation.
During the quarter, the Company successfully finalized a two-year collective labour agreement at La Coipa.
Annual production at Fort Knox increased compared with 2024 due to a full year of production from higher-grade, higher-recovery ore from
and cost of sales per ounce sold increased due to the decrease in production.
At
At
Development projects
Kinross was pleased to announce construction decisions in
In 2022, Kinross initiated a portfolio and grade enhancement strategy that is expected to provide organic offsets to inflation pressures. The implementation began with the completion of the Tasiast 21k and 24k mill expansions, and the restart of the La Coipa mine, increasing the proportion of higher-grade mill feed in the portfolio. Following these portfolio enhancements,
Higher-grade underground mining at Phase X and Curlew are expected to benefit long-term costs within Kinross’
The announcement is available here.
Great Bear
At?Great Bear, Kinross continues to progress its AEX program alongside permitting, detailed engineering and procurement of major equipment for the
For AEX, surface construction is currently 80% complete. The Company is currently working with the
For the
Federally, the second of three phased submissions for the Project’s Impact Statement was submitted on schedule in December. The third and final submission remains on track for the end of Q1 2026. In addition to the Impact Statement, Kinross has advanced other federal
Provincially, the Company is also advancing
Lobo-Marte
Kinross has completed baseline studies to support the Environmental Impact Assessment for the Lobo-Marte project and plans to submit it by Q2 2026. Kinross also plans to provide a project update later this year. Lobo-Marte continues to be a potential large, low-cost mine with the potential to contribute to the portfolio in the early 2030s.
Company Guidance
The following section of the news release represents forward-looking information and users are cautioned that actual results may vary. We refer to the risks and assumptions contained in the Cautionary Statement on Forward-Looking Information on pages 41 and 42 of this news release.
This Company Guidance section below references attributable production cost of sales per equivalent ounce, attributable all-in sustaining cost per equivalent ounce sold, and sustaining, non-sustaining and attributable capital expenditures, which are non-GAAP ratios and financial measures, as applicable, with no standardized meaning under IFRS and therefore, may not be comparable to similar measures presented by other issuers. The definitions of these non-GAAP ratios and financial measures and comparable reconciliations are included on pages 27 to 33 of this news release.
Production guidance
In 2026, Kinross expects to produce 2.0 million attributable Au eq. oz.15 (+/- 5%) from its operations. Production is expected to remain stable at 2.0 million attributable Au eq. oz.15 (+/- 5%) for each of 2027 and 2028. In 2025, Kinross produced 2,012,106 attributable Au eq. oz.
| Annual attributable1 gold equivalent production guidance (+/- 5%) | |
| 2026 | 2.0 million oz. |
| 2027 | 2.0 million oz. |
| 2028 | 2.0 million oz. |
Cost guidance
Attributable production cost of sales1 is expected to be
The Company expects its attributable all-in sustaining cost1 to be
2026 production and cost guidance
| Q4 2025 results | 2025 full-year results | 2026 guidance (+/- 5%) | ||
| Gold equivalent basis | ||||
| Production (Au eq. oz.) | 483,582 | 2.0 million | 2.0 million11 | |
| Attributable production cost of sales per Au eq. oz. sold1 | ||||
| Production cost of sales per Au eq. oz. sold2 | - | |||
| Attributable all-in sustaining cost per Au eq. oz. sold1 | ||||
2026 attributable1 production and cost guidance by country
| Country | 2026 attributable production guidance (Au eq. oz.)1, 15 (+/-5%) | Percentage of total forecast production16 | 2026 attributable production cost of sales guidance (per Au eq. oz. sold)1 (+/-5%) | 2025 production cost of sales (per Au eq. oz. sold)2 | 2025 attributable production cost of sales (per Au eq. oz. sold)1 | |||
| 505,000 | 25% | |||||||
| 600,000 | 30% | |||||||
| 210,000 | 11% | |||||||
| 685,000 | 34% | |||||||
| TOTAL | 2.0 million | 100% | $1,360 | $1,140 | $1,135 | |||
Material assumptions used to forecast 2026 guidance, most notably relating to production cost of sales, are as follows:
- a gold price of
$4,500 per ounce; - a silver price of
$65 per ounce; - an oil price of
$70 per barrel; - foreign exchange rates of:
- 5.25 Brazilian reais to the
U.S. dollar; - 940 Chilean pesos to the
U.S. dollar; - 40 Mauritanian ouguiyas to the
U.S. dollar; and 1.38 Canadian dollars to theU.S. dollar;
- 5.25 Brazilian reais to the
Taking into account existing currency and oil hedges:
- a 10% change in foreign currency exchange rates17 would be expected to result in an approximate
$30 impact on attributable production cost of sales per equivalent ounce sold1; - specific to the Brazilian real, a 10% change in this exchange rate would be expected to result in an approximate
$50 impact on Brazilian attributable production cost of sales per equivalent ounce sold1; - specific to the Chilean peso, a 10% change in this exchange rate would be expected to result in an approximate
$50 impact on Chilean attributable production cost of sales per equivalent ounce sold1; - a
$10 per barrel change in the price of oil would be expected to result in an approximate$3 impact on fuel consumption costs on attributable production cost of sales per equivalent ounce sold1; and - a
$100 change in the price of gold would be expected to result in an approximate$5 impact on attributable production cost of sales per equivalent ounce sold1 as a result of a change in royalties.
Attributable capital expenditures18 guidance
Attributable capital expenditures for 2026 are forecast to be approximately
Kinross’ attributable capital expenditures outlook for 2027 and 2028 is expected to be in line with 2026, subject to ongoing inflationary impacts and project opportunities currently under study, which have the potential to contribute in the 2030s.
Country | Forecast 2026 sustaining capital18 (+/-5%) (attributable) (million) | Forecast 2026 non-sustaining capital18 (+/-5%) (attributable) (million) | Total 2026 forecast capital18 (+/-5%) (attributable) (million) | 2025 sustaining capital18 (million) | 2025 non-sustaining capital18 (million) | 2025 total capital18 (consolidated) (million) | 2025 total capital18 (attributable) (million) | ||||
| $- | |||||||||||
and other | $- | $- | |||||||||
| TOTAL | |||||||||||
2026 sustaining capital18 includes the following forecast spending estimates:
| |
| |
| |
| |
|
2026 non-sustaining capital18 includes the following forecast spending estimates:
| |
| |
| |
| |
|
Other 2026 guidance
| Category | 2026 Guidance | Summary | |
| Exploration and Business Development ($M) | 2026 guidance includes approximately For details about the 2026 exploration program, see page 18. | ||
| General and Administrative ($M) | In line with 2025 results. | ||
| Other Operating Costs ($M) | Primarily relates to studies and permitting activities that do not meet the criteria for capitalization, as well as care and maintenance and reclamation activities at non-operating sites. | ||
| Effective Tax Rate (ETR)19 | 28% - 33% | ETR based on adjusted net earnings. | |
| Taxes paid (cash) ($M) | Taxes paid is expected to increase by approximately Includes approximately | ||
| DD&A ($/oz.)20 | In line with 2025 results. | ||
| Interest paid ($M) | Total interest incurred is expected to be | ||
Sustainability
Kinross continued to advance its Sustainability priorities in 2025, delivering meaningful progress across energy efficiency, community partnerships and governance. The Company maintained its strong position with external Sustainability rankings, including its leading position in the S&P Corporate Sustainability Assessment.
During the year, the Company completed its 2025 energy efficiency program, delivering an estimated 1.5% reduction in greenhouse gas emissions through the implementation of more than 30 projects. This included haul route optimization and cycle time improvements.
Across operating regions, Kinross delivered tangible social benefits to local communities. Kinross Chile was recognized as the
Kinross maintained its focus on strong governance standards for its Board of Directors, including welcoming a new Board Chair and two new Board members in 2025. Kinross was, once again, the top scoring mining Company in The Globe and Mail’s annual corporate governance ranking, placing in the top 15% of companies overall.
Exploration update
In 2025, approximately 275,000 metres of drilling was completed for all exploration projects (brownfields, minex and greenfields).
Brownfields and minex exploration
The Company’s brownfields and minex exploration efforts – which accounted for approximately 85% of the Company’s exploration – continued to focus within the footprint of existing mines and projects during 2025.
Great Bear
In 2025 exploration at Great Bear shifted to focus on regional exploration work on the ~120 square kilometre land package to look for additional open pit and underground opportunities, and approximately 62,000 metres were drilled.
Exploration has generated encouraging results stepping out up to 1.8 kilometres along strike of the main LP zone, both to the northwest and southeast.
- BR-952: 2.2m @ 12.1 g/t Au
- BR-959: 1.7m @ 10.2 g/t Au
- BR-941: 1.0m @ 64.1 g/t Au
- BR-941: 1.7m @ 5.94 g/t Au
- REG-25-110: 0.6m @ 14.20 g/t Au
There were also encouraging results on the broader land package outside of the main LP trend:
- REG-25-131: 1.0m @ 1.99 g/t Au
- REG-25-137: 0.5m @ 11.60 g/t Au
- DL25-150A: 8.9m @ 4.83 g/t Au
These areas will be followed up in the 2026 drilling program, which includes approximately 55,000 metres of planned drilling.
Additionally, prospecting and mapping on the Red
Round Mountain
In 2025, work at
Highlights from Phase X underground drilling campaign:
- RX-0030: 140m @ 4.4 g/t Au Eq.
- RX-0031: 58m @ 5.8 g/t Au Eq.
- RX-0032: 23m @ 37.5 g/t Au Eq.
- RX-0034: 29m @ 24.1 g/t Au Eq.
- RX-0064: 105m @ 4.1 g/t Au Eq.
- DX-0117: 125m @ 5.4 g/t Au Eq.
- DX-0125: 223m @ 2.7 g/t Au Eq.
The Company also received results from step out drilling ~220 metres down dip and along plunge of the Phase X resource, showing mineralization with similar grades and widths to the initial resource with RX-0105 intersecting 68 metres at 3.1 g/t, supporting the hypothesis that this system extends significantly down dip and highlighting potential for further resource and mine plan additions.
In 2026, Kinross plans to focus exploration at Phase X on proximal and down dip extensions of the resource, alongside further infill drilling of the lower zone and surface exploration targeting future open pit extensions on the broader land package.
Curlew
The 2025 drilling program at Curlew included approximately 14,000 metres of underground drilling. Exploration development was also driven to establish more efficient drilling platforms in both the North Stealth and Roadrunner zones.
Drilling in the North Stealth zone was focused on expanding inferred high-grade mineralization, as well as infill drilling of areas that will be targeted in the early years of the mine plan.
Program highlights from assays received in 2025 include:
- N. Stealth-1221 – 10.0m @ 16.4 g/t Au
- N. Stealth-1554 – 10.4m @ 11.7 g/t Au
- K5-1261 – 25.7m @ 7.8 g/t Au
- K5-1522 – 6.9m @ 8.9 g/t Au
- K2N-1482 – 11.7m @ 10.4 g/t Au
In 2026, Kinross plans to focus on expanding areas of wide, higher-grade mineralization proximal to North Stealth and in the Roadrunner area down dip with potential to augment the life of mine plan, alongside infill drilling across the property in preparation for the initial years of mining.
At Fort Knox, approximately 29,000 metres of drilling in 2025 focused on growth at two main target areas: the area proximal to the satellite Gil pit, and growth opportunities proximal to the Fort Knox pit, which may offer potential to augment medium-term production plans at Fort Knox
Gil highlights include:
- GPC25-902 – 16.8m @ 2.9 g/t Au
- GR25-915 – 6.1m @ 4.4 g/t Au
- GC25-925 – 14.0m @ 3.4 g/t Au
- GC25-933 – 6.9m @ 8.8 g/t Au
Fort Knox highlights include:
- FFR25-1923 – 4.6m @ 7.7 g/t Au
- FFC25-1957 – 7.4m @ 2.71 g/t Au
- FFC25-1958 – 17.3m @ 2.0 g/t Au
- FFC25-1958 – 4.9m @ 33.0 g/t Au
In 2026, drilling at Fort Knox will continue to focus on growth opportunities proximal to the Gil and Fort Knox pits.
At
As a result of strong near mine exploration and progression of project studies,
Highlights for the exploration campaign beyond the reserve conversion included positive results at both the Rat and Top target areas.
Highlights from Rat and Top:
- RRD25-001: 12.0m @ 12.7 g/t
- RRD25-002: 16.0m @ 10.4 g/t
- RRD25-005: 7.5m @ 2.7 g/t
- TC25-002: 4.6m @ 6.4 g/t
- TC25-001: 39.6m @ 1.2 g/t
In 2026, Kinross plans to target near mine growth opportunities at several of the existing
Tasiast
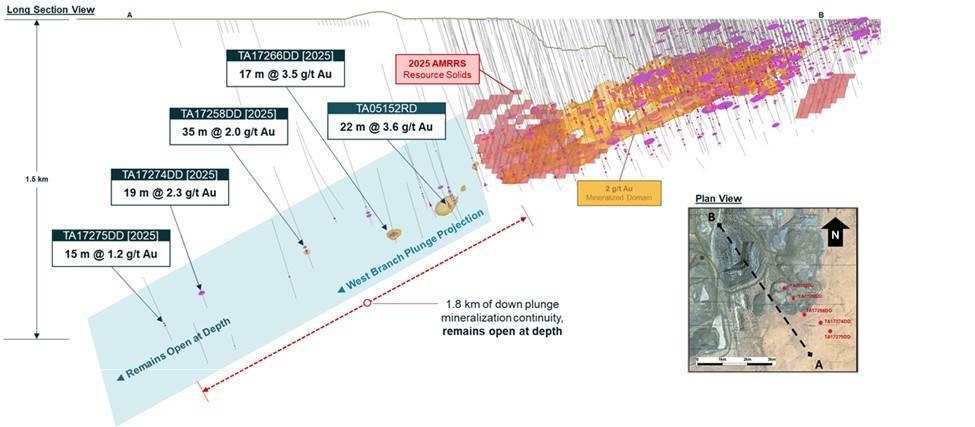
At Tasiast, approximately 44,000 metres of drilling were completed in 2025. Drill testing of the
Figure 1: Strong underground potential at Tasiast West Branch
A figure accompanying this announcement is available at
https://www.globenewswire.com/NewsRoom/AttachmentNg/9e234095-d7e9-4205-bf62-c28bd4ba6792
Highlighted intercepts from
- TA17263DD: 23m @ 2.8 g/t Au
- TA17266DD: 7m @ 2.3 g/t Au
- TA17266DD: 27m @ 2.3 g/t Au
- TA17271ADD: 20m @ 2.1 g/t Au
- TA17274DD: 19m @ 2.3 g/t Au
- TA17275DD: 15m @ 1.2 g/t Au
- TA17258DD: 35m @ 2.0 g/t Au
In addition to the reserve additions at Fennec, Kinross also advanced exploration across other target areas, including C68, Piment and Prolongation. While further drilling is required to fully define these targets, results to date are encouraging and indicate continued exploration upside.
Highlighted intercepts include:
- TA17268ADD: 6m @ 2.5 g/t Au
- TA17268ADD: 7m @ 1.7 g/t Au
- TA17273ADD: 6m @ 2.0 g/t Au
- TA17277DD: 6m @ 1.4 g/t Au
- TA17280DD: 5m @ 1.5 g/t Au
- TA17281DD: 8m @ 1.3 g/t Au
- TA17281DD: 3m @ 1.3 g/t Au
Drilling in 2026 will focus on following up on 2025 results at the satellite open pit ore bodies and extending underground targets at depth.
At La Coipa, the 2025 drilling program completed approximately 12,000 metres of drilling across multiple deposits further defining existing trends within the La Coipa area of operations, targeting extensions of previously mined orebodies.
Drill results in the
- PUR-037A: 10m @ 1.9 g/t Au & 31 g/t Ag
- PUR-037A: 16m @ 1.3 g/t Au & 146 g/t Ag
- PUR-037A: 10m @ 2.0 g/t Au & 11 g/t Ag
- PUR-036: 10m @ 0.03 g/t Au & 181 g/t Ag
- PUR-035: 14m @ 1.3 g/t Au & 6.8 g/t Ag
- PUR-034: 14m @ 2.9 g/t Au & 4.4 g/t Ag
- PUR-032: 44m @ 1.2 g/t Au & 15.3 g/t Ag
- PUR-031: 32m @ 1.4g/t Au & 138 g/t Ag
Drill results in closer proximity to Phase 7 (Pompeya) pit which we are also currently mining were also encouraging, including:
- CAT-123: 20m @ 1.1 g/t & 10 g/t Ag
- CAT-122: 16m @ 1.0 g/t Au & 37 g/t Ag
Drilling in 2026 will focus on growth opportunities, following up the 2025 near mine successes around the existing La Coipa operations and planned future laybacks.
Brownfields exploration in 2025 focused on the large licenses south of and adjacent to the Paracatu mine. Approximately 9,000 metres of drilling was completed. Drilling showing similar style of mineralization to Paracatu will be followed up on in 2026. New gold in soil anomalies and induced polarization geophysics anomalies identified in 2025 will also be drill tested in 2026.
The 2025 minex campaign focused on several near mine opportunities, including the south pile, southwest expansion, and the northeast target areas.
Together with mine design optimization, resource drilling supported the addition of 700,000 Au oz. to reserves in 2025, nearly offsetting production depletion.
Greenfields exploration update
The greenfields exploration strategy is to identify high potential geological units that have the right age, structural complexity and potential to host high-grade gold mineralization. The Company looks for opportunities where it can stake its own claims or collaborate with high-quality junior exploration companies through either joint venture agreements or via equity investment. The primary focus is exploring for orogenic, epithermal,
The greenfields exploration programs in 2025 were focused on targets located in
Exploration in
High-grade gold was discovered on the SLG property through prospecting and mapping. Sampling along a 1.0 kilometre length returned gold grades of 73.1 g/t, 16.8 g/t, 16.5 g/t, 16.3g/t, 16.0 g/t, 14.2 g/t, 11.7 g/t and 10.9 g/t. Drill testing of this prospective trend will take place in the winter of 2026.
Kinross conducted the first drill program on the McCafferty property during the fourth quarter of 2025. The drilling successfully intersected the target vein with the deepest intercept occurring at ~200m below surface. Preliminary highlights of the drilling are as follows:
- MCA25-002: 2.9m @ 16.9 g/t Au
- MCA25-003: 4.0m @ 5.4 g/t Au
- MCA25-005: 2.0m @ 17.5 g/t Au
- MCA25-006: 4.0m @ 33.7 g/t Au
Outside of
In
Kinross will continue to advance this area and drill test other known showings starting with a winter 2026 drilling program followed by mapping and prospecting throughout the spring and summer that will be followed up with a late summer to fall drilling campaign.
Kinross holds a number of projects in
Since 2024, the company has been in a joint venture was with Riley Gold Corporation on its
Work in 2026 will follow-up on the exciting results at
Kinross actively explored its projects in the Central Lapland Greenstone Belt a greenstone belt of similar scale to the Abitibi that has had limited historical gold exploration and development. Kinross’ land positions are proximal to Agnico Eagle’s Kittilä gold mine and Rupert Resource’s Ikkari gold deposit, which reported more than 4 million ounces at 2.2 g/t Au in indicated resources.
Work in 2025 included approximately 15,000 metres of drilling on the projects, of which 11,000 metres was base-of-till drilling and is used to test the surface of bedrock under cover for gold anomalies. Base-of-till drilling was used successfully in the discoveries of Agnico Eagle’s Kittilä gold mine and Rupert Resource’s Ikkari gold deposit.
Work will continue on the joint venture ground in 2026 and advance the other projects through base-of-till drilling, mapping and prospecting and diamond drilling of the highest priority anomalies.
2026 Focus
2026 exploration expenditure guidance (brownfields, minex and greenfields) is
Priority exploration projects:
- At Great Bear, focus on the discovery of new open pit and underground targets outside of the LP, Hinge and Limb areas on Kinross’ 120 square kilometre land package.
- At Curlew, delineate and extend zones of high-grade mineralization at North Stealth, and Roadrunner.
- At
Round Mountain , explore for proximal and down dip extensions of the initial resource while continuing infill drilling of the lower zone at Phase X. - At Fort Knox, focus on extension opportunities in proximity to both the Gil and Fort Knox open pits.
- At Tasiast, continue to demonstrate continuity at depth and extend underground resources at
West Branch while progressing further exploration of multiple satellite targets on the large TMLSA land package. - In
Chile , drill test a number of greenfields and brownfields projects, targeting both porphyry and high sulphidation epithermal styles of mineralization as well as extensions of known oxide deposits. - At Paracatu, continue testing targets along the mine trend and advance greenfields exploration regionally.
- In
Canada , advance exploration atSnow Lake inManitoba , on the RedLake North property inOntario , and through the Puma Resources joint venture inNew Brunswick .
Full drill results are available here: www.kinross.com/Exploration-Drill-Results-Appendix-A-Q4-YE-2025
2025 Mineral Reserves and Mineral Resources update
(See the Company’s detailed Annual Mineral Reserve and Mineral Resource Statement estimated as at
Kinross increased its gold price assumptions from
The Company also increased its silver price assumptions to
Kinross continues to prioritize quality, high-margin, low-cost ounces in its portfolio, and maintained its fully loaded costing methodology with the objective of converting to reserves.
| Kinross Gold Mineral Reserve and Mineral Resource estimates22 | |||||
| 2024 (Au koz.) | Depletion (Au koz.) | Geology & Engineering (Au koz.) | 2025 (Au koz.) | ||
Proven and Probable Reserves | 21,857 | (2,131) | 1,217 | 20,942 | |
Measured and Indicated Resources | 25,867 | (33) | 1,666 | 27,499 | |
Inferred Resources | 13,193 | (42) | 3,482 | 16,633 | |
Proven and Probable Mineral Reserves
Kinross’ total estimated proven and probable gold reserves at
Paracatu added 700,000 Au oz. to reserves before depletion through mine design optimizations and exploration nearly offsetting production depletion.
Tasiast added 200,000 Au oz. to reserves before depletion driven by additions within the existing reserve pit design at
Round Mountain’s 2025 reserve update reflects the transition to the Phase X underground. Higher margin underground reserves (3.2 g/t) replaced lower margin open pit reserves (0.8 g/t), adding approximately 100,000 Au oz. to reserves before depletion, and driving improved value, margins and returns, with a significantly higher IRR and NPV. The higher-grade component of Phase W resource converted to underground reserve. The remaining lower grade open pit resource with high strip ratio was removed, improving the quality of the overall resource. Phase X underground extends mine life by eight years to 2038. Underground mining also has significant potential to extend resources with lower incremental capital relative to open pit expansions with potential extensions of mineralization down-dip.
Measured and Indicated Mineral Resources
Kinross’ total measured and indicated mineral resource estimate increased by 6% to 27.5 million Au oz. at year-end 2025, compared with 25.9 million Au oz at year-end 2024. The net addition of 1.6 million ounces was driven by gains across the portfolio, including at Fort Knox, La Coipa, Paracatu, Maricunga and Lobo-Marte, partially offset by reduction at
Inferred Mineral Resources
Kinross’ total inferred mineral resource estimate increased by 26% to 16.6 million Au oz at year-end 2025, compared with 13.2 million Au oz. at year-end 2024. The addition of 3.4 million ounces was driven by strong growth across the portfolio, including at Tasiast, Fort Knox,
Conference call details
In connection with this news release, Kinross will hold a conference call and audio webcast on
Outside of
Replay (available up to 14 days after the call):
Outside of
You may also access the conference call on a listen-only basis via webcast at our website www.kinross.com. The audio webcast will be archived on www.kinross.com.
This release should be read in conjunction with Kinross’ 2025 year-end Financial Statements and Management’s Discussion and Analysis report at www.kinross.com. Kinross’ 2025 year-end Financial Statements and Management’s Discussion and Analysis have been filed with Canadian securities regulators (available at www.sedarplus.ca) and furnished with the U.S. Securities and Exchange Commission (available at www.sec.gov). Kinross shareholders may obtain a copy of the financial statements free of charge upon request to the Company.
About
Kinross is a Canadian-based global senior gold mining company with operations and projects in
Media Contact
Director, Corporate Communications
phone: 416-365-3034
Samantha.Sheffield@Kinross.com
Investor Relations Contact
Senior Vice-President, Investor Relations
phone: 416-365-2854
InvestorRelations@Kinross.com
Review of operations
| Three months ended | Gold equivalent ounces | |||||||||||||||||
| Produced | Sold | Production cost of sales ($millions) | Production cost of sales/equivalent ounce sold | |||||||||||||||
| 2025 | 2024 | 2025 | 2024 | 2025 | 2024 | 2025 | 2024 | |||||||||||
| Tasiast | 125,625 | 139,411 | 118,912 | 144,041 | 119.2 | 104.4 | 1,002 | 725 | ||||||||||
| Paracatu | 155,048 | 123,899 | 154,565 | 124,690 | 165.0 | 131.6 | 1,068 | 1,055 | ||||||||||
| La Coipa | 67,319 | 58,533 | 71,419 | 57,852 | 80.7 | 68.2 | 1,130 | 1,179 | ||||||||||
| Fort Knox | 71,523 | 104,901 | 74,294 | 108,512 | 125.8 | 141.0 | 1,693 | 1,299 | ||||||||||
| 31,754 | 42,969 | 31,641 | 45,342 | 86.6 | 80.0 | 2,737 | 1,764 | |||||||||||
| 38,402 | 44,642 | 37,141 | 51,291 | 55.4 | 58.7 | 1,492 | 1,144 | |||||||||||
| United States Total | 141,679 | 192,512 | 143,076 | 205,145 | 267.8 | 279.7 | 1,872 | 1,363 | ||||||||||
| Less: | (6,089 | ) | (13,146 | ) | (6,412 | ) | (13,749 | ) | (12.2 | ) | (15.9 | ) | ||||||
| United States Attributable Total | 135,590 | 179,366 | 136,664 | 191,396 | 255.6 | 263.8 | 1,870 | 1,378 | ||||||||||
| Operations Total(a) | 489,671 | 514,355 | 487,972 | 531,729 | 632.7 | 583.8 | 1,297 | 1,098 | ||||||||||
| Attributable Total(a) | 483,582 | 501,209 | 481,560 | 517,980 | 620.5 | 567.9 | 1,289 | 1,096 | ||||||||||
| Years ended | Gold equivalent ounces | |||||||||||||||||
| Produced | Sold | Production cost of sales ($millions) | Production cost of sales/equivalent ounce sold | |||||||||||||||
| 2025 | 2024 | 2025 | 2024 | 2025 | 2024 | 2025 | 2024 | |||||||||||
| Tasiast | 503,429 | 622,394 | 486,401 | 609,614 | 430.2 | 415.4 | 884 | 681 | ||||||||||
| Paracatu | 601,318 | 528,574 | 600,110 | 528,209 | 587.1 | 548.6 | 978 | 1,039 | ||||||||||
| La Coipa | 231,770 | 246,131 | 235,233 | 241,077 | 284.2 | 231.3 | 1,208 | 959 | ||||||||||
| Fort Knox | 410,822 | 377,258 | 417,104 | 375,402 | 558.6 | 452.5 | 1,339 | 1,205 | ||||||||||
| 143,402 | 215,387 | 142,739 | 214,996 | 273.8 | 328.3 | 1,918 | 1,527 | |||||||||||
| 179,169 | 181,047 | 177,430 | 182,760 | 212.5 | 220.3 | 1,198 | 1,205 | |||||||||||
| United States Total | 733,393 | 773,692 | 737,273 | 773,158 | 1,044.9 | 1,001.1 | 1,417 | 1,295 | ||||||||||
| Less: | (57,804 | ) | (42,739 | ) | (58,482 | ) | (41,524 | ) | (76.7 | ) | (40.8 | ) | ||||||
| United States Attributable Total | 675,589 | 730,953 | 678,791 | 731,634 | 968.2 | 960.3 | 1,426 | 1,313 | ||||||||||
| Operations Total(a) | 2,069,910 | 2,170,791 | 2,059,017 | 2,153,212 | 2,346.4 | 2,197.1 | 1,140 | 1,020 | ||||||||||
| Attributable Total(a) | 2,012,106 | 2,128,052 | 2,000,535 | 2,111,688 | 2,269.7 | 2,156.3 | 1,135 | 1,021 | ||||||||||
| (a) Totals include immaterial sales and related costs from Maricunga for the three and twelve months ended | ||||||||||||||||||
Consolidated balance sheets
| (expressed in millions of | |||||||||
| As at | |||||||||
| 2025 | 2024 | ||||||||
| Assets | |||||||||
| Current assets | |||||||||
| Cash and cash equivalents | $ | 1,742.3 | $ | 611.5 | |||||
| Restricted cash | 13.5 | 10.2 | |||||||
| Accounts receivable and prepaid assets | 145.8 | 257.3 | |||||||
| Inventories | 1,370.3 | 1,243.2 | |||||||
| Other current assets | 16.6 | 4.5 | |||||||
| 3,288.5 | 2,126.7 | ||||||||
| Non-current assets | |||||||||
| Property, plant and equipment | 8,289.4 | 7,968.6 | |||||||
| Long-term investments | 99.3 | 51.9 | |||||||
| Other long-term assets | 708.9 | 713.1 | |||||||
| Deferred tax assets | 25.0 | 5.3 | |||||||
| Total assets | $ | 12,411.1 | $ | 10,865.6 | |||||
| Liabilities | |||||||||
| Current liabilities | |||||||||
| Accounts payable and accrued liabilities | $ | 716.4 | $ | 543.0 | |||||
| Current income tax payable | 595.7 | 236.7 | |||||||
| Current portion of long-term debt | - | 199.9 | |||||||
| Current portion of provisions | 74.2 | 62.5 | |||||||
| Other current liabilities | 13.3 | 18.0 | |||||||
| 1,399.6 | 1,060.1 | ||||||||
| Non-current liabilities | |||||||||
| Long-term debt | 738.2 | 1,235.5 | |||||||
| Provisions | 976.6 | 941.5 | |||||||
| Other long-term liabilities | 64.8 | 78.9 | |||||||
| Deferred tax liabilities | 537.8 | 549.0 | |||||||
| Total liabilities | $ | 3,717.0 | $ | 3,865.0 | |||||
| Equity | |||||||||
| Common shareholders' equity | |||||||||
| Common share capital | $ | 4,382.0 | $ | 4,487.3 | |||||
| Contributed surplus | 10,137.6 | 10,643.0 | |||||||
| Accumulated deficit | (5,943.3 | ) | (8,181.3 | ) | |||||
| Accumulated other comprehensive loss | (0.3 | ) | (87.4 | ) | |||||
| Total common shareholders' equity | 8,576.0 | 6,861.6 | |||||||
| Non-controlling interests | 118.1 | 139.0 | |||||||
| Total equity | $ | 8,694.1 | $ | 7,000.6 | |||||
| Total liabilities and equity | $ | 12,411.1 | $ | 10,865.6 | |||||
| Common shares | |||||||||
| Authorized | Unlimited | Unlimited | |||||||
| Issued and outstanding | 1,199,843,037 | 1,229,125,606 | |||||||
Consolidated statements of operations
| (expressed in millions of | ||||||||||
| Years ended | ||||||||||
| 2025 | 2024 | |||||||||
| Revenue | ||||||||||
| Metal sales | $ | 7,051.1 | $ | 5,148.8 | ||||||
| Cost of sales | ||||||||||
| Production cost of sales | 2,346.4 | 2,197.1 | ||||||||
| Depreciation, depletion and amortization | 1,105.0 | 1,147.5 | ||||||||
| Impairment reversal | (116.1 | ) | (74.1 | ) | ||||||
| Total cost of sales | 3,335.3 | 3,270.5 | ||||||||
| Gross profit | 3,715.8 | 1,878.3 | ||||||||
| Other operating expense | 93.9 | 14.0 | ||||||||
| Exploration and business development | 204.4 | 197.8 | ||||||||
| General and administrative | 139.9 | 126.2 | ||||||||
| Operating earnings | 3,277.6 | 1,540.3 | ||||||||
| Other (expense) income - net | (24.6 | ) | 14.3 | |||||||
| Finance income | 73.0 | 18.2 | ||||||||
| Finance expense | (131.3 | ) | (91.4 | ) | ||||||
| Earnings before tax | 3,194.7 | 1,481.4 | ||||||||
| Income tax expense - net | (724.7 | ) | (487.4 | ) | ||||||
| Net earnings | $ | 2,470.0 | $ | 994.0 | ||||||
| Net earnings attributable to: | ||||||||||
| Non-controlling interests | $ | 79.9 | $ | 45.2 | ||||||
| Common shareholders | $ | 2,390.1 | $ | 948.8 | ||||||
| Earnings per share attributable to common shareholders | ||||||||||
| Basic | $ | 1.96 | $ | 0.77 | ||||||
| Diluted | $ | 1.95 | $ | 0.77 | ||||||
Consolidated statements of cash flows
| (expressed in millions of | ||||||||||
| Years ended | ||||||||||
| 2025 | 2024 | |||||||||
| Net inflow (outflow) of cash related to the following activities: | ||||||||||
| Operating: | ||||||||||
| Net earnings | $ | 2,470.0 | $ | 994.0 | ||||||
| Adjustments to reconcile net earnings to net cash provided from operating activities: | ||||||||||
| Depreciation, depletion and amortization | 1,105.0 | 1,147.5 | ||||||||
| Impairment reversal | (116.1 | ) | (74.1 | ) | ||||||
| Share-based compensation expense | 13.1 | 9.0 | ||||||||
| Finance expense - net | 90.1 | 73.2 | ||||||||
| Income tax expense - net | 724.7 | 487.4 | ||||||||
| Gain on sale of Asante Gold Corporation holdings | (63.0 | ) | - | |||||||
| Foreign exchange losses (gains) | 5.7 | (13.8 | ) | |||||||
| Other | 2.0 | (44.1 | ) | |||||||
| Reclamation payments, net of reclamation (recovery) expense | (92.3 | ) | (22.3 | ) | ||||||
| Changes in working capital: | ||||||||||
| Accounts receivable and other assets | 9.5 | 27.5 | ||||||||
| Inventories | (83.9 | ) | 14.3 | |||||||
| Accounts payable and accrued liabilities | 114.1 | 26.0 | ||||||||
| Cash flow provided from operating activities | 4,178.9 | 2,624.6 | ||||||||
| Income taxes paid | (418.4 | ) | (178.2 | ) | ||||||
| Net cash flow provided from operating activities | 3,760.5 | 2,446.4 | ||||||||
| Investing: | ||||||||||
| Additions to property, plant and equipment | (1,194.2 | ) | (1,075.5 | ) | ||||||
| Interest paid capitalized to property, plant and equipment | (19.8 | ) | (92.6 | ) | ||||||
| Proceeds from long-term investments and other assets | 189.8 | 4.8 | ||||||||
| Additions to long-term investments and other assets | (72.1 | ) | (43.2 | ) | ||||||
| Increase in restricted cash - net | (3.3 | ) | (0.4 | ) | ||||||
| Interest received and other - net | 42.8 | 17.0 | ||||||||
| Net cash flow of continuing operations used in investing activities | (1,056.8 | ) | (1,189.9 | ) | ||||||
| Net cash flow of discontinued operations provided from investing activities | 53.4 | 10.0 | ||||||||
| Financing: | ||||||||||
| Repayment of debt | (700.0 | ) | (800.0 | ) | ||||||
| Interest paid | (65.2 | ) | (35.6 | ) | ||||||
| Payment of lease liabilities | (7.2 | ) | (12.1 | ) | ||||||
| Funding from non-controlling interest | - | 31.3 | ||||||||
| Distributions paid to non-controlling interest | (102.0 | ) | (40.5 | ) | ||||||
| Dividends paid to common shareholders | (152.1 | ) | (147.5 | ) | ||||||
| Repurchase and cancellation of shares | (600.3 | ) | - | |||||||
| Other - net | (1.2 | ) | (1.5 | ) | ||||||
| Net cash flow used in financing activities | (1,628.0 | ) | (1,005.9 | ) | ||||||
| Effect of exchange rate changes on cash and cash equivalents | 1.7 | (1.5 | ) | |||||||
| Increase in cash and cash equivalents | 1,130.8 | 259.1 | ||||||||
| Cash and cash equivalents, beginning of period | 611.5 | 352.4 | ||||||||
| Cash and cash equivalents, end of period | $ | 1,742.3 | $ | 611.5 | ||||||
| Operating Summary | |||||||||||||||||||
| Mine | Period | Tonnes Ore Mined | Ore Processed (Milled) | Ore Processed (Heap Leach) | Grade (Heap Leach) | Recovery (a)(b) | Gold Eq Production(c) | Gold Eq Sales(c) | Production cost of sales | Production cost of sales/oz(d) | Cap Ex - sustaining(e) | Total Cap Ex (e) | |||||||
| ('000 tonnes) | ('000 tonnes) | ('000 tonnes) | (g/t) | (g/t) | (%) | (ounces) | (ounces) | ($ millions) | ($/ounce) | ($ millions) | ($ millions) | ||||||||
| Tasiast | Q4 2025 | 3,120 | 2,252 | - | 1.87 | - | 94 | % | 125,625 | 118,912 | $ | 119.2 | $ | 1,002 | $ | 28.6 | $ | 80.5 | |
| Q3 2025 | 1,685 | 2,181 | - | 1.78 | - | 94 | % | 120,934 | 116,251 | $ | 103.4 | $ | 889 | $ | 47.6 | $ | 102.0 | ||
| Q2 2025 | 1,921 | 1,730 | - | 2.11 | - | 95 | % | 119,241 | 121,745 | $ | 102.6 | $ | 843 | $ | 23.1 | $ | 89.7 | ||
| Q1 2025 | 1,812 | 1,932 | - | 2.15 | - | 95 | % | 137,629 | 129,493 | $ | 105.0 | $ | 811 | $ | 13.7 | $ | 80.1 | ||
| Q4 2024 | 1,824 | 2,205 | - | 2.13 | - | 94 | % | 139,411 | 144,041 | $ | 104.4 | $ | 725 | $ | 33.7 | $ | 105.4 | ||
| Paracatu | Q4 2025 | 10,929 | 12,395 | - | 0.45 | - | 83 | % | 155,048 | 154,565 | $ | 165.0 | $ | 1,068 | $ | 67.6 | $ | 67.6 | |
| Q3 2025 | 12,958 | 13,214 | - | 0.44 | - | 82 | % | 150,367 | 149,903 | $ | 139.9 | $ | 933 | $ | 58.2 | $ | 58.2 | ||
| Q2 2025 | 13,497 | 14,527 | - | 0.39 | - | 82 | % | 149,264 | 148,787 | $ | 142.6 | $ | 958 | $ | 38.4 | $ | 38.4 | ||
| Q1 2025 | 13,318 | 12,507 | - | 0.43 | - | 83 | % | 146,639 | 146,855 | $ | 139.6 | $ | 951 | $ | 24.4 | $ | 24.4 | ||
| Q4 2024 | 12,944 | 13,116 | - | 0.40 | - | 80 | % | 123,899 | 124,690 | $ | 131.6 | $ | 1,055 | $ | 35.1 | $ | 35.1 | ||
| La Coipa(f) | Q4 2025 | 1,219 | 1,203 | - | 2.42 | - | 74 | % | 67,319 | 71,419 | $ | 80.7 | $ | 1,130 | $ | 31.7 | $ | 31.7 | |
| Q3 2025 | 1,006 | 932 | - | 2.36 | - | 76 | % | 57,997 | 57,544 | $ | 69.0 | $ | 1,199 | $ | 18.5 | $ | 18.5 | ||
| Q2 2025 | 580 | 911 | - | 1.77 | - | 78 | % | 54,139 | 50,400 | $ | 70.4 | $ | 1,397 | $ | 25.0 | $ | 25.0 | ||
| Q1 2025 | 1,265 | 971 | - | 2.19 | - | 80 | % | 52,315 | 55,870 | $ | 64.1 | $ | 1,147 | $ | 15.6 | $ | 15.6 | ||
| Q4 2024 | 1,385 | 1,017 | - | 1.98 | - | 79 | % | 58,533 | 57,852 | $ | 68.2 | $ | 1,179 | $ | 26.6 | $ | 26.6 | ||
| Fort Knox (100%)(g) | Q4 2025 | 11,056 | 1,645 | 8,805 | 1.02 | 0.23 | 88 | % | 71,523 | 74,294 | $ | 125.8 | $ | 1,693 | $ | 38.0 | $ | 38.0 | |
| Q3 2025 | 8,140 | 1,511 | 6,538 | 1.86 | 0.23 | 90 | % | 112,181 | 117,500 | $ | 159.7 | $ | 1,359 | $ | 45.0 | $ | 45.0 | ||
| Q2 2025 | 7,639 | 1,636 | 5,529 | 1.72 | 0.23 | 88 | % | 115,064 | 113,200 | $ | 141.3 | $ | 1,248 | $ | 43.0 | $ | 43.0 | ||
| Q1 2025 | 6,530 | 1,071 | 4,790 | 2.77 | 0.19 | 91 | % | 112,054 | 112,110 | $ | 131.8 | $ | 1,176 | $ | 28.2 | $ | 28.2 | ||
| Q4 2024 | 7,692 | 1,524 | 6,664 | 1.51 | 0.21 | 82 | % | 104,901 | 108,512 | $ | 141.0 | $ | 1,299 | $ | 53.3 | $ | 54.0 | ||
| Fort Knox (attributable)(g) | Q4 2025 | 11,001 | 1,597 | 8,805 | 0.93 | 0.23 | 87 | % | 65,434 | 67,882 | $ | 113.6 | $ | 1,673 | $ | 31.5 | $ | 31.5 | |
| Q3 2025 | 8,056 | 1,425 | 6,538 | 1.55 | 0.23 | 89 | % | 95,742 | 100,878 | $ | 138.4 | $ | 1,372 | $ | 40.4 | $ | 40.4 | ||
| Q2 2025 | 7,535 | 1,567 | 5,529 | 1.47 | 0.23 | 87 | % | 97,561 | 95,277 | $ | 118.8 | $ | 1,247 | $ | 38.7 | $ | 38.7 | ||
| Q1 2025 | 6,445 | 982 | 4,790 | 2.35 | 0.19 | 90 | % | 94,281 | 94,585 | $ | 111.1 | $ | 1,175 | $ | 24.6 | $ | 24.6 | ||
| Q4 2024 | 7,619 | 1,483 | 6,664 | 1.28 | 0.21 | 81 | % | 91,755 | 94,763 | $ | 125.1 | $ | 1,320 | $ | 51.1 | $ | 52.1 | ||
| Q4 2025 | 737 | 966 | 1,110 | 0.49 | 0.29 | 67 | % | 31,754 | 31,641 | $ | 86.6 | $ | 2,737 | $ | 8.6 | $ | 41.5 | ||
| Q3 2025 | 1,659 | 914 | 1,113 | 0.66 | 0.32 | 72 | % | 37,297 | 37,274 | $ | 78.1 | $ | 2,095 | $ | 4.5 | $ | 33.0 | ||
| Q2 2025 | 2,881 | 856 | 1,682 | 0.72 | 0.30 | 80 | % | 38,665 | 37,864 | $ | 52.1 | $ | 1,376 | $ | 5.7 | $ | 32.8 | ||
| Q1 2025 | 1,927 | 856 | 2,163 | 0.66 | 0.27 | 77 | % | 35,686 | 35,960 | $ | 57.0 | $ | 1,585 | $ | 2.8 | $ | 29.6 | ||
| Q4 2024 | 3,111 | 768 | 1,736 | 1.05 | 0.22 | 82 | % | 42,969 | 45,342 | $ | 80.0 | $ | 1,764 | $ | 4.4 | $ | 33.9 | ||
| Q4 2025 | 3,165 | - | 3,165 | - | 0.30 | nm | 38,402 | 37,141 | $ | 55.4 | $ | 1,492 | $ | 13.1 | $ | 51.6 | |||
| Q3 2025 | 2,182 | - | 2,182 | - | 0.31 | nm | 41,525 | 42,261 | $ | 48.5 | $ | 1,148 | $ | 5.3 | $ | 27.9 | |||
| Q2 2025 | 1,578 | - | 1,578 | - | 1.07 | nm | 53,704 | 54,227 | $ | 59.4 | $ | 1,095 | $ | 12.7 | $ | 40.4 | |||
| Q1 2025 | 5,803 | - | 5,803 | - | 0.35 | nm | 45,538 | 43,801 | $ | 49.2 | $ | 1,123 | $ | 6.9 | $ | 17.8 | |||
| Q4 2024 | 7,622 | - | 7,622 | - | 0.46 | nm | 44,642 | 51,291 | $ | 58.7 | $ | 1,144 | $ | 4.6 | $ | 6.4 | |||
| (a) | Due to the nature of heap leach operations, recovery rates at | |
| (b) | "nm" means not meaningful. | |
| (c) | Gold equivalent ounces include silver ounces produced and sold converted to a gold equivalent based on the ratio of the average spot market prices for the commodities for each period. The ratios for the quarters presented are as follows: Q4 2025: 76.34:1; Q3 2025: 87.73:1; Q2 2025: 97.41:1; Q1 2025: 89.69:1; Q4 2024: 84.67:1. | |
| (d) | “Production cost of sales per equivalent ounce sold” is defined as production cost of sales divided by total gold equivalent ounces sold. | |
| (e) | "Total Cap Ex" is “Additions to property, plant and equipment” on the consolidated statements of cash flows. "Cap Ex - sustaining" is a non-GAAP financial measure. The definition and reconciliation of this non-GAAP financial measure is included on page [•] of this news release. | |
| (f) | La Coipa silver grade and recovery were as follows: Q4 2025: 33.21 g/t, 41%; Q3 2025: 41.34 g/t, 49%; Q2 2025: 28.89 g/t, 50%; Q1 2025: 31.97 g/t, 60%; Q4 2024: 42.57 g/t, 43%. | |
| (g) | The Fort Knox segment is composed of Fort Knox and | |
Reconciliation of non-GAAP financial measures and ratios
The Company has included certain non-GAAP financial measures and ratios in this document. These financial measures and ratios are not defined under IFRS and should not be considered in isolation. The Company believes that these financial measures and ratios, together with financial measures and ratios determined in accordance with IFRS, provide investors with an improved ability to evaluate the underlying performance of the Company. The inclusion of these financial measures and ratios is meant to provide additional information and should not be used as a substitute for performance measures prepared in accordance with IFRS. These financial measures and ratios are not necessarily standard and therefore may not be comparable to other issuers.
Adjusted Net Earnings and Adjusted Net Earnings per Share
Adjusted net earnings and adjusted net earnings per share are non-GAAP financial measures and ratios which determine the performance of the Company, excluding certain impacts which the Company believes are not reflective of the Company’s underlying performance for the reporting period, such as the impact of foreign exchange gains and losses, reassessment of prior year taxes and/or taxes otherwise not related to the current period, impairment charges (reversals), gains and losses and other one-time costs related to acquisitions, dispositions and other transactions, and non-hedge derivative gains and losses. Although some of the items are recurring, the Company believes that they are not reflective of the underlying operating performance of its current business and are not necessarily indicative of future operating results. Management believes that these measures and ratios, which are used internally to assess performance and in planning and forecasting future operating results, provide investors with the ability to better evaluate underlying performance, particularly since the excluded items are typically not included in public guidance. However, adjusted net earnings and adjusted net earnings per share measures and ratios are not necessarily indicative of net earnings and earnings per share measures and ratios as determined under IFRS.
The following table provides a reconciliation of net earnings to adjusted net earnings for the periods presented:
| (expressed in millions of | Three months ended | Years ended | ||||||||||||
| 2025 | 2024 | 2025 | 2024 | |||||||||||
| Net earnings attributable to common shareholders - as reported | $ | 906.5 | $ | 275.6 | $ | 2,390.1 | $ | 948.8 | ||||||
| Adjusting items: | ||||||||||||||
| Foreign exchange (gains) losses | (7.1 | ) | (22.2 | ) | 21.5 | (27.3 | ) | |||||||
| Foreign exchange losses (gains) on translation of tax basis and foreign exchange on deferred income taxes within income tax expense | 0.2 | 54.4 | (36.4 | ) | 86.4 | |||||||||
| Taxes in respect of prior periods | (21.5 | ) | (37.8 | ) | (22.8 | ) | (60.7 | ) | ||||||
| Impairment reversal | (116.1 | ) | - | (116.1 | ) | (74.1 | ) | |||||||
| Loss on sale of assets | 11.5 | 3.5 | 16.5 | 6.0 | ||||||||||
| Gain on sale of Asante holdings(a) | - | - | (53.0 | ) | - | |||||||||
| Tasiast mill fire related costs | - | - | 13.0 | - | ||||||||||
| Insurance recoveries | - | - | - | (22.9 | ) | |||||||||
| Collective labour agreements | 55.6 | - | 55.6 | - | ||||||||||
| Settlement provisions | - | (5.6 | ) | - | 2.6 | |||||||||
| Reclamation expense (recovery) | (56.1 | ) | 6.9 | (56.1 | ) | 6.9 | ||||||||
| Other adjustments related to prior periods | - | (27.8 | ) | - | (27.8 | ) | ||||||||
| Other(b) | 7.7 | (10.4 | ) | 7.0 | (4.9 | ) | ||||||||
| Tax effects of the above adjustments | 28.6 | 3.4 | 24.6 | 5.3 | ||||||||||
| (97.2 | ) | (35.6 | ) | (146.2 | ) | (110.5 | ) | |||||||
| Adjusted net earnings | $ | 809.3 | $ | 240.0 | $ | 2,243.9 | $ | 838.3 | ||||||
| Weighted average number of common shares outstanding - Basic | 1,206.7 | 1,229.1 | 1,219.5 | 1,228.9 | ||||||||||
| Adjusted net earnings per share | $ | 0.67 | $ | 0.20 | $ | 1.84 | $ | 0.68 | ||||||
| Basic earnings per share attributable to common shareholders - as reported | $ | 0.75 | $ | 0.22 | $ | 1.96 | $ | 0.77 | ||||||
| (a) | The gain on sale of Asante holdings includes interest income of |
| (b) | Other includes various impacts, such as one-time costs and credits at sites, restructuring costs, and gains and losses on hedges, which the Company believes are not reflective of the Company’s underlying performance for the reporting period. |
Attributable Free Cash Flow
Attributable free cash flow is a non-GAAP financial measure and is defined as net cash flow provided from operating activities less attributable capital expenditures and non-controlling interest included in net cash flows provided from operating activities. The Company believes that this measure, which is used internally to evaluate the Company’s underlying cash generation performance and the ability to repay creditors and return cash to shareholders, provides investors with the ability to better evaluate the Company’s underlying performance. However, this measure is not necessarily indicative of operating earnings or net cash flow provided from operating activities as determined under IFRS.
The following table provides a reconciliation of attributable free cash flow for the periods presented:
| Three months ended | Years ended | ||||||||||||
| (expressed in millions of | |||||||||||||
| 2025 | 2024 | 2025 | 2024 | ||||||||||
| Net cash flow provided from operating activities - as reported | $ | 1,146.9 | $ | 734.5 | $ | 3,760.5 | $ | 2,446.4 | |||||
| Adjusting items: | |||||||||||||
| Attributable(a)capital expenditures | (361.7 | ) | (278.8 | ) | (1,175.2 | ) | (1,050.9 | ) | |||||
| Non-controlling interest(b)cash flow from operating activities | (15.8 | ) | (21.3 | ) | (111.8 | ) | (55.3 | ) | |||||
| Attributable(a)free cash flow | $ | 769.4 | $ | 434.4 | $ | 2,473.5 | $ | 1,340.2 | |||||
See pages 33 and 34 for details of the footnotes referenced within the table above.
Attributable Adjusted Operating Cash Flow
Attributable adjusted operating cash flow is a non-GAAP financial measure and is defined as net cash flow provided from operating activities excluding changes in working capital, certain impacts which the Company believes are not reflective of the Company’s regular operating cash flow, and net cash flows provided from operating activities, net of working capital changes, relating to non-controlling interests. Working capital is excluded given that numerous factors can result in it being volatile. The Company uses attributable adjusted operating cash flow internally as a measure of the underlying operating cash flow performance and future operating cash flow-generating capability of the Company. However, the attributable adjusted operating cash flow measure is not necessarily indicative of net cash flow provided from operating activities as determined under IFRS.
The following table provides a reconciliation of attributable adjusted operating cash flow for the periods presented:
| (expressed in millions of | Three months ended | Years ended | ||||||||||||
| 2025 | 2024(m) | 2025 | 2024(m) | |||||||||||
| Net cash flow provided from operating activities - as reported | $ | 1,146.9 | $ | 734.5 | $ | 3,760.5 | $ | 2,446.4 | ||||||
| Adjusting items: | ||||||||||||||
| Insurance proceeds received in respect of prior years | - | - | - | (22.9 | ) | |||||||||
| Working capital changes: | ||||||||||||||
| Accounts receivable and other assets | (18.2 | ) | (30.9 | ) | (9.5 | ) | (27.5 | ) | ||||||
| Inventories | 34.5 | (17.4 | ) | 83.9 | (14.3 | ) | ||||||||
| Accounts payable and accrued liabilities | (13.8 | ) | 10.9 | (114.1 | ) | (26.0 | ) | |||||||
| 1,149.4 | 697.1 | 3,720.8 | 2,355.7 | |||||||||||
| Non-controlling interest(b)cash flow from operating activities, net of working capital changes | (13.4 | ) | (20.1 | ) | (115.6 | ) | (61.8 | ) | ||||||
| Attributable(a)adjusted operating cash flow | $ | 1,136.0 | $ | 677.0 | $ | 3,605.2 | $ | 2,293.9 | ||||||
See pages 33 and 34 for details of the footnotes referenced within the table above.
Attributable Average Realized Gold Price per Ounce
Attributable average realized gold price per ounce is a non-GAAP ratio which calculates the average price realized from gold sales attributable to the Company. The Company believes that this measure provides a more accurate measure with which to compare the Company's gold sales performance to market gold prices. The following table provides a reconciliation of attributable average realized gold price per ounce for the periods presented:
| (expressed in millions of | Three months ended | Years ended | ||||||||||||
| 2025 | 2024 | 2025 | 2024 | |||||||||||
| Metal sales - as reported | $ | 2,023.0 | $ | 1,415.8 | $ | 7,051.1 | $ | 5,148.8 | ||||||
| Less: silver revenue(c) | (36.8 | ) | (24.6 | ) | (114.2 | ) | (121.9 | ) | ||||||
| Less: non-controlling interest(b)gold revenue | (25.5 | ) | (35.5 | ) | (191.4 | ) | (103.0 | ) | ||||||
| Attributable(a)gold revenue | $ | 1,960.7 | $ | 1,355.7 | $ | 6,745.5 | $ | 4,923.9 | ||||||
| Gold ounces sold | 479,347 | 522,389 | 2,026,570 | 2,100,621 | ||||||||||
| Less: non-controlling interest(b)gold ounces sold | (6,254 | ) | (13,649 | ) | (57,829 | ) | (41,325 | ) | ||||||
| Attributable(a)gold ounces sold | 473,093 | 508,740 | 1,968,741 | 2,059,296 | ||||||||||
| Attributable(a)average realized gold price per ounce | $ | 4,144 | $ | 2,665 | $ | 3,426 | $ | 2,391 | ||||||
| Average realized gold price per ounce(d) | $ | 4,144 | $ | 2,663 | $ | 3,423 | $ | 2,393 | ||||||
See pages 33 and 34 for details of the footnotes referenced within the table above.
Attributable Production Cost of Sales per Equivalent Ounce Sold
Production cost of sales per equivalent ounce sold is defined as production cost of sales, as reported on the consolidated statement of operations, divided by the total number of gold equivalent ounces sold. This measure converts the Company’s non-gold production into gold equivalent ounces and credits it to total production.
Attributable production cost of sales per equivalent ounce sold is a non-GAAP ratio and is defined as attributable production cost of sales divided by the attributable number of gold equivalent ounces sold. This measure converts the Company’s attributable non-gold production into gold equivalent ounces and credits it to total attributable production. Management uses this measure to monitor and evaluate the performance of its operating properties that are attributable to its shareholders.
The following table provides a reconciliation of production cost of sales and attributable production cost of sales per equivalent ounce sold for the periods presented:
| (expressed in millions of | Three months ended | Years ended | ||||||||||||
| 2025 | 2024 | 2025 | 2024 | |||||||||||
| Production cost of sales - as reported | $ | 632.7 | $ | 583.8 | $ | 2,346.4 | $ | 2,197.1 | ||||||
| Less: non-controlling interest(b)production cost of sales | (12.2 | ) | (15.9 | ) | (76.7 | ) | (40.8 | ) | ||||||
| Attributable(a)production cost of sales | $ | 620.5 | $ | 567.9 | $ | 2,269.7 | $ | 2,156.3 | ||||||
| Gold equivalent ounces sold | 487,972 | 531,729 | 2,059,017 | 2,153,212 | ||||||||||
| Less: non-controlling interest(b)gold equivalent ounces sold | (6,412 | ) | (13,749 | ) | (58,482 | ) | (41,524 | ) | ||||||
| Attributable(a)gold equivalent ounces sold | 481,560 | 517,980 | 2,000,535 | 2,111,688 | ||||||||||
| Attributable(a)production cost of sales per equivalent ounce sold | $ | 1,289 | $ | 1,096 | $ | 1,135 | $ | 1,021 | ||||||
| Production cost of sales per equivalent ounce sold(e) | $ | 1,297 | $ | 1,098 | $ | 1,140 | $ | 1,020 | ||||||
See pages 33 and 34 for details of the footnotes referenced within the table above.
Attributable Production Cost of Sales per Ounce Sold on a By-Product Basis
Attributable production cost of sales per ounce sold on a by-product basis is a non-GAAP ratio which calculates the impact of the Company’s non-gold production as a credit against its per ounce production costs, rather than converting its non-gold production into gold equivalent ounces and crediting it to total production, as is the case in co-product accounting. Management believes that this ratio provides investors with the ability to better evaluate Kinross’ production cost of sales per ounce on a comparable basis with other major gold producers who routinely calculate their cost of sales per ounce using by-product accounting rather than co-product accounting.
The following table provides a reconciliation of attributable production cost of sales per ounce sold on a by-product basis for the periods presented:
| (expressed in millions of | Three months ended | Years ended | ||||||||||||
| 2025 | 2024 | 2025 | 2024 | |||||||||||
| Production cost of sales - as reported | $ | 632.7 | $ | 583.8 | $ | 2,346.4 | $ | 2,197.1 | ||||||
| Less: non-controlling interest(b)production cost of sales | (12.2 | ) | (15.9 | ) | (76.7 | ) | (40.8 | ) | ||||||
| Less: attributable(a)impact of silver by-product(n) | (36.1 | ) | (24.2 | ) | (111.9 | ) | (121.4 | ) | ||||||
| Attributable(a)production cost of sales on a by-product basis | $ | 584.4 | $ | 543.7 | $ | 2,157.8 | $ | 2,034.9 | ||||||
| Gold ounces sold | 479,347 | 522,389 | 2,026,570 | 2,100,621 | ||||||||||
| Less: non-controlling interest(b)gold ounces sold | (6,254 | ) | (13,649 | ) | (57,829 | ) | (41,325 | ) | ||||||
| Attributable(a)gold ounces sold | 473,093 | 508,740 | 1,968,741 | 2,059,296 | ||||||||||
| Attributable(a)production cost of sales per ounce sold on a by-product basis | $ | 1,235 | $ | 1,069 | $ | 1,096 | $ | 988 | ||||||
| Production cost of sales per equivalent ounce sold(e) | $ | 1,297 | $ | 1,098 | $ | 1,140 | $ | 1,020 | ||||||
See pages 33 and 34 for details of the footnotes referenced within the table above.
Attributable All-In Sustaining Cost and All-In Cost per Ounce Sold on a By-Product Basis
Attributable all-in sustaining cost and all-in cost per ounce sold on a by-product basis are non-GAAP financial measures and ratios, as applicable, calculated based on guidance published by the
All-in sustaining cost includes both operating and capital costs required to sustain gold production on an ongoing basis. The impact of silver sold is deducted from the total production cost of sales as it is considered residual production, i.e. a by-product. Sustaining operating costs represent expenditures incurred at current operations that are considered necessary to maintain current production. Sustaining capital represents capital expenditures at existing operations comprising mine development costs, including capitalized development, and ongoing replacement of mine equipment and other capital facilities, and does not include capital expenditures for major growth projects or enhancement capital for significant infrastructure improvements at existing operations.
All-in cost is comprised of all-in sustaining cost as well as operating expenditures incurred at locations with no current operation, or costs related to other non-sustaining activities, and capital expenditures for major growth projects or enhancement capital for significant infrastructure improvements at existing operations.
Attributable all-in sustaining cost and all-in cost per ounce sold on a by-product basis are calculated by adjusting production cost of sales, as reported on the consolidated statements of operations, as follows:
| (expressed in millions of | Three months ended | Years ended | ||||||||||||
| 2025 | 2024 | 2025 | 2024 | |||||||||||
| Production cost of sales - as reported | $ | 632.7 | $ | 583.8 | $ | 2,346.4 | $ | 2,197.1 | ||||||
| Less: non-controlling interest(b)production cost of sales | (12.2 | ) | (15.9 | ) | (76.7 | ) | (40.8 | ) | ||||||
| Less: attributable(a)impact of silver by-product(n) | (36.1 | ) | (24.2 | ) | (111.9 | ) | (121.4 | ) | ||||||
| Attributable(a)production cost of sales on a by-product basis | $ | 584.4 | $ | 543.7 | $ | 2,157.8 | $ | 2,034.9 | ||||||
| Adjusting items on an attributable(a)basis: | ||||||||||||||
| General and administrative(f) | 37.9 | 31.9 | 134.4 | 122.2 | ||||||||||
| Other operating (income) expense - sustaining(g) | (1.7 | ) | (0.9 | ) | (0.2 | ) | 4.0 | |||||||
| Reclamation and remediation - sustaining(h) | 20.7 | 15.3 | 87.1 | 71.4 | ||||||||||
| Exploration and business development - sustaining(i) | 18.3 | 10.1 | 56.8 | 42.5 | ||||||||||
| Additions to property, plant and equipment - sustaining(j) | 181.2 | 155.9 | 587.8 | 523.5 | ||||||||||
| Lease payments - sustaining(k) | 1.9 | 1.9 | 6.3 | 11.8 | ||||||||||
| All-in Sustaining Cost on a by-product basis - attributable(a) | $ | 842.7 | $ | 757.9 | $ | 3,030.0 | $ | 2,810.3 | ||||||
| Adjusting items on an attributable(a)basis: | ||||||||||||||
| Other operating expense - non-sustaining(g) | 35.5 | 20.3 | 95.0 | 53.1 | ||||||||||
| Reclamation and remediation - non-sustaining(h) | 2.3 | 1.7 | 9.2 | 6.8 | ||||||||||
| Exploration and business development - non-sustaining(i) | 30.8 | 40.4 | 144.6 | 153.4 | ||||||||||
| Additions to property, plant and equipment - non-sustaining(j) | 180.5 | 122.9 | 587.4 | 527.4 | ||||||||||
| Lease payments - non-sustaining(k) | 0.3 | 0.1 | 0.9 | 0.3 | ||||||||||
| All-in Cost on a by-product basis - attributable(a) | $ | 1,092.1 | $ | 943.3 | $ | 3,867.1 | $ | 3,551.3 | ||||||
| Gold ounces sold | 479,347 | 522,389 | 2,026,570 | 2,100,621 | ||||||||||
| Less: non-controlling interest(b)gold ounces sold | (6,254 | ) | (13,649 | ) | (57,829 | ) | (41,325 | ) | ||||||
| Attributable(a)gold ounces sold | 473,093 | 508,740 | 1,968,741 | 2,059,296 | ||||||||||
| Attributable(a)all-in sustaining cost per ounce sold on a by-product basis | $ | 1,781 | $ | 1,490 | $ | 1,539 | $ | 1,365 | ||||||
| Attributable(a)all-in cost per ounce sold on a by-product basis | $ | 2,308 | $ | 1,854 | $ | 1,964 | $ | 1,725 | ||||||
| Production cost of sales per equivalent ounce sold(e) | $ | 1,297 | $ | 1,098 | $ | 1,140 | $ | 1,020 | ||||||
See pages 33 and 34 for details of the footnotes referenced within the table above.
Attributable All-In Sustaining Cost and All-In Cost per Equivalent Ounce Sold
The Company also assesses its attributable all-in sustaining cost and all-in cost on a gold equivalent ounce basis. Under these non-GAAP financial measures and ratios, the Company’s production of silver is converted into gold equivalent ounces and credited to total production.
Attributable all-in sustaining cost and all-in cost per equivalent ounce sold are calculated by adjusting production cost of sales, as reported on the consolidated statements of operations, as follows:
| (expressed in millions of | Three months ended | Years ended | ||||||||||||
| 2025 | 2024 | 2025 | 2024 | |||||||||||
| Production cost of sales - as reported | $ | 632.7 | $ | 583.8 | $ | 2,346.4 | $ | 2,197.1 | ||||||
| Less: non-controlling interest(b)production cost of sales | (12.2 | ) | (15.9 | ) | (76.7 | ) | (40.8 | ) | ||||||
| Attributable(a)production cost of sales | $ | 620.5 | $ | 567.9 | $ | 2,269.7 | $ | 2,156.3 | ||||||
| Adjusting items on an attributable(a)basis: | ||||||||||||||
| General and administrative(f) | 37.9 | 31.9 | 134.4 | 122.2 | ||||||||||
| Other operating (income) expense - sustaining(g) | (1.7 | ) | (0.9 | ) | (0.2 | ) | 4.0 | |||||||
| Reclamation and remediation - sustaining(h) | 20.7 | 15.3 | 87.1 | 71.4 | ||||||||||
| Exploration and business development - sustaining(i) | 18.3 | 10.1 | 56.8 | 42.5 | ||||||||||
| Additions to property, plant and equipment - sustaining(j) | 181.2 | 155.9 | 587.8 | 523.5 | ||||||||||
| Lease payments - sustaining(k) | 1.9 | 1.9 | 6.3 | 11.8 | ||||||||||
| All-in Sustaining Cost - attributable(a) | $ | 878.8 | $ | 782.1 | $ | 3,141.9 | $ | 2,931.7 | ||||||
| Adjusting items on an attributable(a)basis: | ||||||||||||||
| Other operating expense - non-sustaining(g) | 35.5 | 20.3 | 95.0 | 53.1 | ||||||||||
| Reclamation and remediation - non-sustaining(h) | 2.3 | 1.7 | 9.2 | 6.8 | ||||||||||
| Exploration and business development - non-sustaining(i) | 30.8 | 40.4 | 144.6 | 153.4 | ||||||||||
| Additions to property, plant and equipment - non-sustaining(j) | 180.5 | 122.9 | 587.4 | 527.4 | ||||||||||
| Lease payments - non-sustaining(k) | 0.3 | 0.1 | 0.9 | 0.3 | ||||||||||
| All-in Cost - attributable(a) | $ | 1,128.2 | $ | 967.5 | $ | 3,979.0 | $ | 3,672.7 | ||||||
| Gold equivalent ounces sold | 487,972 | 531,729 | 2,059,017 | 2,153,212 | ||||||||||
| Less: non-controlling interest(b)gold equivalent ounces sold | (6,412 | ) | (13,749 | ) | (58,482 | ) | (41,524 | ) | ||||||
| Attributable(a)gold equivalent ounces sold | 481,560 | 517,980 | 2,000,535 | 2,111,688 | ||||||||||
| Attributable(a)all-in sustaining cost per equivalent ounce sold | $ | 1,825 | $ | 1,510 | $ | 1,571 | $ | 1,388 | ||||||
| Attributable(a)all-in cost per equivalent ounce sold | $ | 2,343 | $ | 1,868 | $ | 1,989 | $ | 1,739 | ||||||
| Production cost of sales per equivalent ounce sold(e) | $ | 1,297 | $ | 1,098 | $ | 1,140 | $ | 1,020 | ||||||
See pages 33 and 34 for details of the footnotes referenced within the table above.
Capital Expenditures and Attributable Capital Expenditures
Capital expenditures are classified as either sustaining capital expenditures or non-sustaining capital expenditures, depending on the nature of the expenditure. Sustaining capital expenditures typically represent capital expenditures at existing operations including capitalized exploration costs and capitalized development unless related to major projects, ongoing replacement of mine equipment and other capital facilities and other capital expenditures and is calculated as total additions to property, plant and equipment (as reported on the consolidated statements of cash flows), less non-sustaining capital expenditures. Non-sustaining capital expenditures represent capital expenditures for major projects, including major capital development projects at existing operations that are expected to materially benefit the operation, as well as enhancement capital for significant infrastructure improvements at existing operations. Management believes the distinction between sustaining capital expenditures and non-sustaining expenditures is a useful indicator of the purpose of capital expenditures and this distinction is an input into the calculation of attributable all-in sustaining costs per ounce and attributable all-in costs per ounce. The categorization of sustaining capital expenditures and non-sustaining capital expenditures is consistent with the definitions under the WGC all-in cost standard. Sustaining capital expenditures and non-sustaining capital expenditures are not defined under IFRS, however, the sum of these two measures total to additions to property, plant and equipment as disclosed under IFRS on the consolidated statements of cash flows.
Additions to property, plant and equipment per the consolidated statements of cash flows includes 100% of capital expenditures for
The following table provides a reconciliation of the classification of capital expenditures for the periods presented:
| (expressed in millions of | ||||||||||||||||||||||
| Three months ended | Tasiast ( | Paracatu ( | La Coipa ( | Fort Knox(l) ( | Other | Total | ||||||||||||||||
| Sustaining capital expenditures | $ | 28.6 | $ | 67.6 | $ | 31.7 | $ | 38.0 | $ | 8.6 | $ | 13.1 | $ | 59.7 | $ | 0.2 | $ | 187.8 | ||||
| Non-sustaining capital expenditures | 51.9 | - | - | - | 32.9 | 38.5 | 71.4 | 57.1 | 180.4 | |||||||||||||
| Additions to property, plant and equipment - per cash flow | $ | 80.5 | $ | 67.6 | $ | 31.7 | $ | 38.0 | $ | 41.5 | $ | 51.6 | $ | 131.1 | $ | 57.3 | $ | 368.2 | ||||
| Less: Non-controlling interest(b) | $ | - | $ | - | $ | - | $ | (6.5 | ) | $ | - | $ | - | $ | (6.5 | ) | $ | - | $ | (6.5 | ) | |
| Attributable(a) capital expenditures | $ | 80.5 | $ | 67.6 | $ | 31.7 | $ | 31.5 | $ | 41.5 | $ | 51.6 | $ | 124.6 | $ | 57.3 | $ | 361.7 | ||||
| Three months ended | ||||||||||||||||||||||
| Sustaining capital expenditures | $ | 33.7 | $ | 35.1 | $ | 26.6 | $ | 53.3 | $ | 4.4 | $ | 4.6 | $ | 62.3 | $ | 0.3 | $ | 158.0 | ||||
| Non-sustaining capital expenditures | 71.7 | - | - | 0.7 | 29.5 | 1.8 | 32.0 | 19.0 | 122.7 | |||||||||||||
| Additions to property, plant and equipment - per cash flow | $ | 105.4 | $ | 35.1 | $ | 26.6 | $ | 54.0 | $ | 33.9 | $ | 6.4 | $ | 94.3 | $ | 19.3 | $ | 280.7 | ||||
| Less: Non-controlling interest(b) | $ | - | $ | - | $ | - | $ | (1.9 | ) | $ | - | $ | - | $ | (1.9 | ) | $ | - | $ | (1.9 | ) | |
| Attributable(a) capital expenditures | $ | 105.4 | $ | 35.1 | $ | 26.6 | $ | 52.1 | $ | 33.9 | $ | 6.4 | $ | 92.4 | $ | 19.3 | $ | 278.8 | ||||
| (expressed in millions of | ||||||||||||||||||||||
| Years ended | Tasiast ( | Paracatu ( | La Coipa ( | Fort Knox(l) ( | Other | Total | ||||||||||||||||
| Sustaining capital expenditures | $ | 113.0 | $ | 188.6 | $ | 90.8 | $ | 154.2 | $ | 21.6 | $ | 38.0 | $ | 213.8 | $ | 0.6 | $ | 606.8 | ||||
| Non-sustaining capital expenditures | 239.3 | - | - | - | 115.3 | 99.7 | 215.0 | 133.1 | 587.4 | |||||||||||||
| Additions to property, plant and equipment - per cash flow | $ | 352.3 | $ | 188.6 | $ | 90.8 | $ | 154.2 | $ | 136.9 | $ | 137.7 | $ | 428.8 | $ | 133.7 | $ | 1,194.2 | ||||
| Less: Non-controlling interest(b) | $ | - | $ | - | $ | - | $ | (19.0 | ) | $ | - | $ | - | $ | (19.0 | ) | $ | - | $ | (19.0 | ) | |
| Attributable(a) capital expenditures | $ | 352.3 | $ | 188.6 | $ | 90.8 | $ | 135.2 | $ | 136.9 | $ | 137.7 | $ | 409.8 | $ | 133.7 | $ | 1,175.2 | ||||
| Years ended | ||||||||||||||||||||||
| Sustaining capital expenditures | $ | 64.3 | $ | 140.5 | $ | 65.8 | $ | 195.2 | $ | 15.4 | $ | 46.4 | $ | 257.0 | $ | (0.7 | ) | $ | 526.9 | |||
| Non-sustaining capital expenditures | 279.6 | - | 3.6 | 97.0 | 110.9 | 3.1 | 211.0 | 54.4 | 548.6 | |||||||||||||
| Additions to property, plant and equipment - per cash flow | $ | 343.9 | $ | 140.5 | $ | 69.4 | $ | 292.2 | $ | 126.3 | $ | 49.5 | $ | 468.0 | $ | 53.7 | $ | 1,075.5 | ||||
| Less: Non-controlling interest(b) | $ | - | $ | - | $ | - | $ | (24.6 | ) | $ | - | $ | - | $ | (24.6 | ) | $ | - | $ | (24.6 | ) | |
| Attributable(a) capital expenditures | $ | 343.9 | $ | 140.5 | $ | 69.4 | $ | 267.6 | $ | 126.3 | $ | 49.5 | $ | 443.4 | $ | 53.7 | $ | 1,050.9 | ||||
See pages 33 and 34 for details of the footnotes referenced within the tables above.
Endnotes
| (a) | “Attributable” measures and ratios include Kinross’ share of |
| (b) | “Non-controlling interest” represents the non-controlling interest portion in |
| (c) | “Silver revenue” represents the portion of metal sales realized from the production of secondary or by-product metal (i.e. silver), which is produced as a by-product of the process used to produce gold. |
| (d) | “Average realized gold price per ounce” is defined as gold revenue divided by total gold ounces sold. |
| (e) | “Production cost of sales per equivalent ounce sold” is defined as production cost of sales divided by total gold equivalent ounces sold. |
| (f) | “General and administrative” expenses are as reported on the consolidated statements of operations, excluding certain impacts which the Company believes are not reflective of the Company’s underlying performance for the reporting period. General and administrative expenses are considered sustaining costs as they are required to be absorbed on a continuing basis for the effective operation and governance of the Company. |
| (g) | “Other operating (income) expense – sustaining” is calculated as “Other operating expense” as reported on the consolidated statements of operations, less the non-controlling interest portion in |
| (h) | “Reclamation and remediation – sustaining” is calculated as current period accretion related to reclamation and remediation obligations plus current period amortization of the corresponding reclamation and remediation assets, less the non-controlling interest portion in |
| (i) | “Exploration and business development – sustaining” is calculated as “Exploration and business development” expenses as reported on the consolidated statements of operations, less the non-controlling interest portion in |
| (j) | “Additions to property, plant and equipment – sustaining” and “non-sustaining” are as presented on pages 32 and 33 of this news release and include Kinross’ share of Manh Choh’s (70%) sustaining and non-sustaining capital expenditures. |
| (k) | “Lease payments – sustaining” represents the majority of lease payments as reported on the consolidated statements of cash flows and is made up of the principal and financing components of such cash payments, less the non-controlling interest portion in |
| (l) | The Fort Knox segment is composed of Fort Knox and |
| (m) | Attributable adjusted operating cash flow for the three months and year ended |
| (n) | “Impact of silver by-product” represents the costs allocated to the production of secondary or by-product metal (i.e. silver), which is produced as a by-product of the process used to produce gold. |
2025 Annual Mineral Reserve and Resource Statement
| Proven and Probable Mineral Reserves | ||||||||||||
| MINERAL RESERVE AND MINERAL RESOURCE STATEMENT | GOLD | |||||||||||
| PROVEN AND PROBABLE MINERAL RESERVES (1,2,3,4,5,6) | ||||||||||||
| Kinross | Proven | Probable | Proven and Probable | |||||||||
| Location | Interest | Tonnes | Grade | Ounces | Tonnes | Grade | Ounces | Tonnes | Grade | Ounces | ||
| (%) | (kt) | (g/t) | (koz) | (kt) | (g/t) | (koz) | (kt) | (g/t) | (koz) | |||
| 100% | 0 | 0.0 | 0 | 66,306 | 0.6 | 1,225 | 66,306 | 0.6 | 1,225 | |||
| Fort Knox | 100% | 1,846 | 0.8 | 46 | 81,094 | 0.4 | 930 | 82,940 | 0.4 | 976 | ||
| 70% | 368 | 4.0 | 47 | 1,665 | 7.4 | 396 | 2,033 | 6.8 | 444 | |||
| 7 | 100% | 5,365 | 0.3 | 59 | 39,690 | 1.4 | 1,829 | 45,055 | 1.3 | 1,888 | ||
| SUBTOTAL | 7,579 | 0.6 | 153 | 188,754 | 0.7 | 4,380 | 196,334 | 0.7 | 4,533 | |||
| La Coipa | 8 | 100% | 591 | 2.5 | 47 | 6,750 | 1.8 | 388 | 7,342 | 1.8 | 436 | |
| 100% | 0 | 0.0 | 0 | 160,702 | 1.3 | 6,733 | 160,702 | 1.3 | 6,733 | |||
| Paracatu | 100% | 287,864 | 0.4 | 3,897 | 111,778 | 0.3 | 943 | 399,642 | 0.4 | 4,839 | ||
| SUBTOTAL | 288,455 | 0.4 | 3,944 | 279,231 | 0.9 | 8,065 | 567,686 | 0.7 | 12,008 | |||
| Tasiast | 100% | 55,584 | 1.0 | 1,806 | 47,181 | 1.7 | 2,595 | 102,765 | 1.3 | 4,401 | ||
| SUBTOTAL | 55,584 | 1.0 | 1,806 | 47,181 | 1.7 | 2,595 | 102,765 | 1.3 | 4,401 | |||
| TOTAL GOLD | 351,618 | 0.5 | 5,903 | 515,166 | 0.9 | 15,040 | 866,785 | 0.8 | 20,942 | |||
| MINERAL RESERVE AND MINERAL RESOURCE STATEMENT | SILVER | |||||||||||
| PROVEN AND PROBABLE MINERAL RESERVES (1,2,3,4,5,6) | ||||||||||||
| Location | Kinross | Proven | Probable | Proven and Probable | ||||||||
| Interest | Tonnes | Grade | Ounces | Tonnes | Grade | Ounces | Tonnes | Grade | Ounces | |||
| (%) | (kt) | (g/t) | (koz) | (kt) | (g/t) | (koz) | (kt) | (g/t) | (koz) | |||
| 70% | 368 | 11.8 | 139 | 1,665 | 11.3 | 604 | 2,033 | 11.4 | 743 | |||
| SUBTOTAL | 368 | 11.8 | 139 | 1,665 | 11.3 | 604 | 2,033 | 11.4 | 743 | |||
| La Coipa | 8 | 100% | 591 | 37.6 | 714 | 6,750 | 46.7 | 10,124 | 7,342 | 45.9 | 10,839 | |
| SUBTOTAL | 591 | 37.6 | 714 | 6,750 | 46.7 | 10,124 | 7,342 | 45.9 | 10,839 | |||
| TOTAL SILVER | 959 | 27.7 | 853 | 8,415 | 39.7 | 10,728 | 9,374 | 38.4 | 11,581 | |||
| See pages 38 and 39 of this news release for details of the footnotes referenced within the table above. | ||||||||||||
| Measured and Indicated Mineral Resources | ||||||||||||
| MINERAL RESERVE AND MINERAL RESOURCE STATEMENT | GOLD | |||||||||||
| MEASURED AND INDICATED MINERAL RESOURCES (2,3,4,5,6,9,10,11) | ||||||||||||
| Kinross | Measured | Indicated | Measured and Indicated | |||||||||
| Location | Interest | Tonnes | Grade | Ounces | Tonnes | Grade | Ounces | Tonnes | Grade | Ounces | ||
| (%) | (kt) | (g/t) | (koz) | (kt) | (g/t) | (koz) | (kt) | (g/t) | (koz) | |||
| 100% | 5,678 | 1.0 | 188 | 139,266 | 0.5 | 2,360 | 144,944 | 0.5 | 2,548 | |||
| Fort Knox | 100% | 0 | 0.0 | 0 | 233,082 | 0.3 | 2,400 | 233,082 | 0.3 | 2,400 | ||
| Great Bear | CAN | 100% | 2,578 | 2.3 | 189 | 28,155 | 2.8 | 2,523 | 30,733 | 2.7 | 2,713 | |
| 12 | 100% | 0 | 0.0 | 0 | 1,993 | 6.4 | 409 | 1,993 | 6.4 | 409 | ||
| 70% | 435 | 2.0 | 27 | 268 | 2.1 | 18 | 703 | 2.0 | 46 | |||
| 7 | 100% | 0 | 0.0 | 0 | 81,275 | 0.6 | 1,446 | 81,275 | 0.6 | 1,446 | ||
| SUBTOTAL | 8,691 | 1.4 | 405 | 484,039 | 0.6 | 9,156 | 492,730 | 0.6 | 9,561 | |||
| La Coipa | 8 | 100% | 6,440 | 1.7 | 356 | 39,561 | 1.4 | 1,772 | 46,001 | 1.4 | 2,128 | |
| 100% | 0 | 0.0 | 0 | 120,762 | 0.7 | 2,752 | 120,762 | 0.7 | 2,752 | |||
| Maricunga | 100% | 71,946 | 0.7 | 1,602 | 278,454 | 0.6 | 5,538 | 350,400 | 0.6 | 7,140 | ||
| Paracatu | 100% | 145,708 | 0.5 | 2,123 | 183,489 | 0.2 | 1,399 | 329,197 | 0.3 | 3,522 | ||
| SUBTOTAL | 224,093 | 0.6 | 4,081 | 622,266 | 0.6 | 11,460 | 846,360 | 0.6 | 15,542 | |||
| Tasiast | 100% | 21,277 | 0.7 | 446 | 57,790 | 1.0 | 1,950 | 79,067 | 0.9 | 2,396 | ||
| SUBTOTAL | 21,277 | 0.7 | 446 | 57,790 | 1.0 | 1,950 | 79,067 | 0.9 | 2,396 | |||
| TOTAL GOLD | 254,062 | 0.6 | 4,932 | 1,164,095 | 0.6 | 22,567 | 1,418,157 | 0.6 | 27,499 | |||
| MINERAL RESERVE AND MINERAL RESOURCE STATEMENT | SILVER | |||||||||||
| MEASURED AND INDICATED MINERAL RESOURCES (2,3,4,5,6,9,10,11) | ||||||||||||
| Location | Kinross | Measured | Indicated | Measured and Indicated | ||||||||
| Interest | Tonnes | Grade | Ounces | Tonnes | Grade | Ounces | Tonnes | Grade | Ounces | |||
| (%) | (kt) | (g/t) | (koz) | (kt) | (g/t) | (koz) | (kt) | (g/t) | (koz) | |||
| 70% | 435 | 11.9 | 166 | 268 | 6.6 | 57 | 703 | 9.8 | 222 | |||
| SUBTOTAL | 435 | 11.9 | 166 | 268 | 6.6 | 57 | 703 | 9.8 | 222 | |||
| La Coipa | 8 | 100% | 6,440 | 28.5 | 5,909 | 39,561 | 36.3 | 46,234 | 46,001 | 35.3 | 52,143 | |
| SUBTOTAL | 6,440 | 28.5 | 5,909 | 39,561 | 36.3 | 46,234 | 46,001 | 35.3 | 52,143 | |||
| TOTAL SILVER | 6,875 | 27.5 | 6,075 | 39,829 | 36.1 | 46,291 | 46,704 | 34.9 | 52,365 | |||
| See pages 38 and 39 of this news release for details of the footnotes referenced within the table above. | ||||||||||||
Inferred Mineral Resources
| MINERAL RESERVE AND MINERAL RESOURCE STATEMENT | GOLD | |||||
| INFERRED MINERAL RESOURCES | (2,3,4,5,6,9,10,11) | |||||
| Kinross | Inferred | |||||
| Location | Interest | Tonnes | Grade | Ounces | ||
| (%) | (kt) | (g/t) | (koz) | |||
| 100% | 78,862 | 0.3 | 790 | |||
| Fort Knox | 100% | 47,909 | 0.4 | 599 | ||
| Great Bear | CAN | 100% | 32,396 | 4.1 | 4,291 | |
| 12 | 100% | 4,151 | 6.3 | 838 | ||
| 7 | 100% | 61,269 | 1.0 | 1,960 | ||
| SUBTOTAL | 224,586 | 1.2 | 8,478 | |||
| La Coipa | 8 | 100% | 4,799 | 1.2 | 188 | |
| 100% | 32,911 | 0.6 | 670 | |||
| Maricunga | 100% | 284,711 | 0.5 | 4,876 | ||
| Paracatu | 100% | 6,383 | 0.2 | 44 | ||
| SUBTOTAL | 328,805 | 0.5 | 5,778 | |||
| Tasiast | 100% | 35,950 | 2.1 | 2,377 | ||
| SUBTOTAL | 35,950 | 2.1 | 2,377 | |||
| TOTAL GOLD | 589,341 | 0.9 | 16,633 | |||
| MINERAL RESERVE AND MINERAL RESOURCE STATEMENT | SILVER | |||||
| INFERRED MINERAL RESOURCES | (2,3,4,5,6,9,10,11) | |||||
| Kinross | Inferred | |||||
| Location | Interest | Tonnes | Grade | Ounces | ||
| (%) | (kt) | (g/t) | (koz) | |||
| 7 | 100% | 36,648 | 6.9 | 8,117 | ||
| SUBTOTAL | 36,648 | 6.9 | 8,117 | |||
| La Coipa | 8 | 100% | 4,799 | 41.2 | 6,358 | |
| SUBTOTAL | 4,799 | 41.2 | 6,358 | |||
| TOTAL SILVER | 41,448 | 10.9 | 14,475 | |||
Mineral Reserve and Mineral Resource Statement Notes
(1) Unless otherwise noted, the Company's mineral reserves are estimated using appropriate cut-off grades based on an assumed gold price of
Canadian Dollar to
Chilean Peso to
Brazilian Real to
Mauritanian Ouguiya to
(2) The Company’s mineral reserve and mineral resource estimates as at
(3) Cautionary note to U.S. investors concerning estimates of mineral reserves and mineral resources. These estimates have been prepared in accordance with the requirements of Canadian securities laws, which differ from the requirements of United States’ securities laws. Unless otherwise indicated, mining terms used herein and in any document incorporated by reference but not otherwise defined have the meanings set forth in NI 43-101. The terms “mineral reserve”, “proven mineral reserve”, “probable mineral reserve”, “mineral resource”, “measured mineral resource”, “indicated mineral resource” and “inferred mineral resource” are Canadian mining terms as defined in accordance with NI 43-101 and the CIM Definition Standards. These definitions differ from the definitions in subpart 1300 of Regulation S-K (“Subpart 1300”). While the definitions in Subpart 1300 are similar to the definitions in NI 43-101 and the CIM Definitions Standard, the definitions in Subpart 1300 differ from the requirements of, and the definitions in, NI 43-101 and the CIM Definition Standards. U.S. investors are cautioned that while the above terms are “substantially similar” to CIM Definitions, there are differences in the definitions in Subpart 1300 and the CIM Definition Standards. Accordingly, there is no assurance any mineral reserves or mineral resources that the Company may report as “proven mineral reserves”, “probable mineral reserves”, “measured mineral resources”, “indicated mineral resources” and “inferred mineral resources” under NI 43-101 would be the same had the Company prepared the mineral reserve or mineral resource estimates under the standards set forth in Subpart 1300. U.S. investors are also cautioned that while the
For the above reasons, the mineral reserve and mineral resource estimates and related information herein may not be comparable to similar information made public by
(4) The Company’s mineral resource and mineral reserve estimates were prepared under the supervision of and verified by Mr.
(5) The Company’s normal data verification procedures have been used in collecting, compiling, interpreting and processing the data used to estimate mineral reserves and mineral resource.
(6) Rounding of values to the 000s may result in apparent discrepancies.
(7)
(8) Includes mineral resources and mineral reserves from the
(9) Mineral resources are exclusive of mineral reserves.
(10) Unless otherwise noted, the Company’s mineral resources are estimated using appropriate cut-off grades based on a gold price of
(11) Mineral resources that are not mineral reserves do not have to demonstrate economic viability. Mineral resources are subject to infill drilling, permitting, mine planning, mining dilution and recovery losses, among other things, to be converted into mineral reserves. Due to the uncertainty associated with inferred mineral resources, it cannot be assumed that all or any part of an inferred mineral resource will ever be upgraded to indicated or measured mineral resources, including as a result of continued exploration.
(12) The mineral resource estimates for Curlew assume a
Mineral Reserve and Mineral Resource Statement Definitions
A ‘Mineral Resource’ is a concentration or occurrence of solid material of economic interest in or on the Earth’s crust in such form, grade or quality and quantity that there are reasonable prospects for eventual economic extraction. The location, quantity, grade or quality, continuity and other geological characteristics of a Mineral Resource are known, estimated or interpreted from specific geological evidence and knowledge, including sampling.
An ‘Inferred Mineral Resource’ is that part of a Mineral Resource for which quantity and grade or quality are estimated on the basis of limited geological evidence and sampling. Geological evidence is sufficient to imply but not verify geological and grade or quality continuity. An Inferred Mineral Resource has a lower level of confidence than that applying to an Indicated Mineral Resource and must not be converted to a Mineral Reserve. It is reasonably expected that the majority of Inferred Mineral Resources could be upgraded to Indicated Mineral Resources with continued exploration.
An ‘Indicated Mineral Resource’ is that part of a Mineral Resource for which quantity, grade or quality, densities, shape and physical characteristics are estimated with sufficient confidence to allow the application of Modifying Factors in sufficient detail to support mine planning and evaluation of the economic viability of the deposit. Geological evidence is derived from adequately detailed and reliable exploration, sampling and testing and is sufficient to assume geological and grade or quality continuity between points of observation. An Indicated Mineral Resource has a lower level of confidence than that applying to a Measured Mineral Resource and may only be converted to a Probable Mineral Reserve.
A ‘Measured Mineral Resource’ is that part of a Mineral Resource for which quantity, grade or quality, densities, shape, and physical characteristics are estimated with confidence sufficient to allow the application of Modifying Factors to support detailed mine planning and final evaluation of the economic viability of the deposit. Geological evidence is derived from detailed and reliable exploration, sampling and testing and is sufficient to confirm geological and grade or quality continuity between points of observation. A Measured Mineral Resource has a higher level of confidence than that applying to either an Indicated Mineral Resource or an Inferred Mineral Resource. It may be converted to a Proven Mineral Reserve or to a Probable Mineral Reserve.
A ‘Mineral Reserve’ is the economically mineable part of a Measured and/or Indicated Mineral Resource. It includes diluting materials and allowances for losses, which may occur when the material is mined or extracted and is defined by studies at Pre-Feasibility or Feasibility level as appropriate that include application of Modifying Factors. Such studies demonstrate that, at the time of reporting, extraction could reasonably be justified. The reference point at which Mineral Reserves are defined, usually the point where the ore is delivered to the processing plant, must be stated. It is important that, in all situations where the reference point is different, such as for a saleable product, a clarifying statement is included to ensure that the reader is fully informed as to what is being reported. The public disclosure of a Mineral Reserve must be demonstrated by a Pre-Feasibility Study or Feasibility Study.
A ‘Probable Mineral Reserve’ is the economically mineable part of an Indicated, and in some circumstances, a Measured Mineral Resource. The confidence in the Modifying Factors applying to a Probable Mineral Reserve is lower than that applying to a Proven Mineral Reserve.
A ‘Proven Mineral Reserve’ is the economically mineable part of a Measured Mineral Resource. A Proven Mineral Reserve implies a high degree of confidence in the Modifying Factors.
Cautionary statement on forward-looking information
All statements, other than statements of historical fact, contained or incorporated by reference in this news release including, but not limited to, any information as to the future financial or operating performance of Kinross, constitute “forward-looking information” or “forward-looking statements” within the meaning of certain securities laws, including the provisions of the Securities Act (
Key Sensitivities
Approximately 70%-80% of the Company's costs are denominated in
A 10% change in foreign currency exchange rates would be expected to result in an approximate
Specific to the Brazilian real, a 10% change in the exchange rate would be expected to result in an approximate
Specific to the Chilean peso, a 10% change in the exchange rate would be expected to result in an approximate
A
A
Other information
Where we say "we", "us", "our", the "Company", or "Kinross" in this news release, we mean
The technical information about the Company’s mineral properties contained in this news release has been prepared under the supervision of Mr.
Source:
________________________
1 Unless otherwise stated, production figures in this news release are on an attributable basis. “Attributable” includes Kinross’ 70% share of
2 “Production cost of sales per equivalent ounce sold” is defined as production cost of sales, as reported on the consolidated statements of operations, divided by total gold equivalent ounces sold.
3 Capital expenditures is reported as "Additions to property, plant and equipment" on the consolidated statements of cash flows.
4 “Margins” per equivalent ounce sold is defined as average realized gold price per ounce less production cost of sales per equivalent ounce sold.
5 Operating cash flow figures in this release represent “Net cash flow provided from operating activities,” as reported on the consolidated statements of cash flows.
6 Earnings, net earnings, and reported net earnings figures in this release represent “Net earnings attributable to common shareholders,” as reported on the consolidated statements of operations.
7 These figures are non-GAAP financial measures and ratios, as applicable. They are defined and actual results are reconciled on pages 27 to 33 of this news release. Non-GAAP financial measures and ratios have no standardized meaning under International Financial Reporting Standards (“IFRS”) and therefore, may not be comparable to similar measures presented by other issuers.
8 Adjusted net earnings figures in this news release represent “Adjusted net earnings attributable to common shareholders.”
9 Net cash is calculated as cash and cash equivalents of
10 “Total liquidity” is defined as the sum of cash and cash equivalents, as reported on the consolidated balance sheets, and available credit under the Company’s credit facilities (as calculated in Section 6 Liquidity and Capital Resources of Kinross’ MD&A for the year ended
11 “Average realized gold price per ounce” is defined as gold revenue divided by total gold ounces sold.
12 “Available credit” is defined as available credit under the Company’s credit facilities and is calculated in Section 6 Liquidity and Capital Resources of Kinross’ MD&A for the year ended
13 The economic analysis of the projects were carried out using a discounted cash flow approach on an after-tax basis, based on a long-term gold price of
14 The NPV was calculated from the after-tax cash flow generated by the project, based on a discount rate of 5% and a valuation date of
15 Attributable gold equivalent ounce production guidance for 2026 includes approximately 3.3 million ounces of silver.
16 The percentages are calculated based on the mid-point of country 2025 forecast production.
17 Refers to all of the currencies in the countries where the Company has mining operations, fluctuating simultaneously by 10% in the same direction, either appreciating or depreciating, taking into consideration the impact of hedging and the weighting of each currency within our consolidated cost structure.
18 Forecast 2026 sustaining, non-sustaining and total forecast capital expenditures are on an attributable basis and include Kinross’ share of
19 The forecast ETR range for 2026 assumes gold price, foreign exchange and tax rates in the jurisdictions in which the Company operates remain stable and within 2026 guidance assumptions. The ETR does not include the impact of items which the Company believes are not reflective of the Company’s underlying performance, such as the impact of net foreign currency translations on tax deductions and taxes related to prior periods. Management believes that the ETR range provides investors with the ability to better evaluate the Company’s underlying performance. However, the ETR range is not necessarily an indicator of tax expense recognized under IFRS. The rate is sensitive to the relative proportion of sales between the Company’s various tax jurisdictions and realized gold prices.
20 DD&A ($/oz) is defined as depreciation, depletion and amortization, as reported on the consolidated statements of operations, divided by total gold equivalent ounces sold.
21 Please see pages 38 and 39 for Mineral Reserve and Mineral Resource Statements and Notes.
22 Rounding of values to the 000s may result in apparent discrepancies.


Figure 1