(See Glossary for Defined Terms)
Management believes that estimated production will generate sufficient cash flow to self-fund production growth with limited to no share dilution, based on an average price of
Key Project Updates – Path to 250,000 – 300,000 Annual GEOs
In
Next steps include 1) Completing detailed engineering and initiating long-lead purchases, 2) Submitting water permit and closure plan, 3) H1 2027 construction, and 4) 2029 commercial production.
During Q2 the Company’s exploration drilling successfully discovered the new Central Zone, located between the
In
Despite the lower than expected production, the
Windfall,
The next deposit for which a Mineral Resource Estimate is set to be published within the
San José Mine – During Q2 the Company received a
In
Significant Ownerships
McEwen owns a 46.3% equity stake in
McEwen also owns a 1.25% NSR royalty on McEwen Copper’s Los Azules copper project.
Under the 2025 Feasibility Study base case of
Based on the 2025 Feasibility study and using a recent copper spot price of
Los Azules continued to advance toward a Final Investment Decision (“FID”) during Q2, with approximately 27% of the planned FID work program deliverables completed as of
During Q2, Société Générale was appointed as exclusive financial advisor for the project’s debt financing process and preparations were initiated for a potential initial public offering.
Paragon Advanced Labs
In
Mineral Resource & Exploration Update
Exploration at Grey Fox
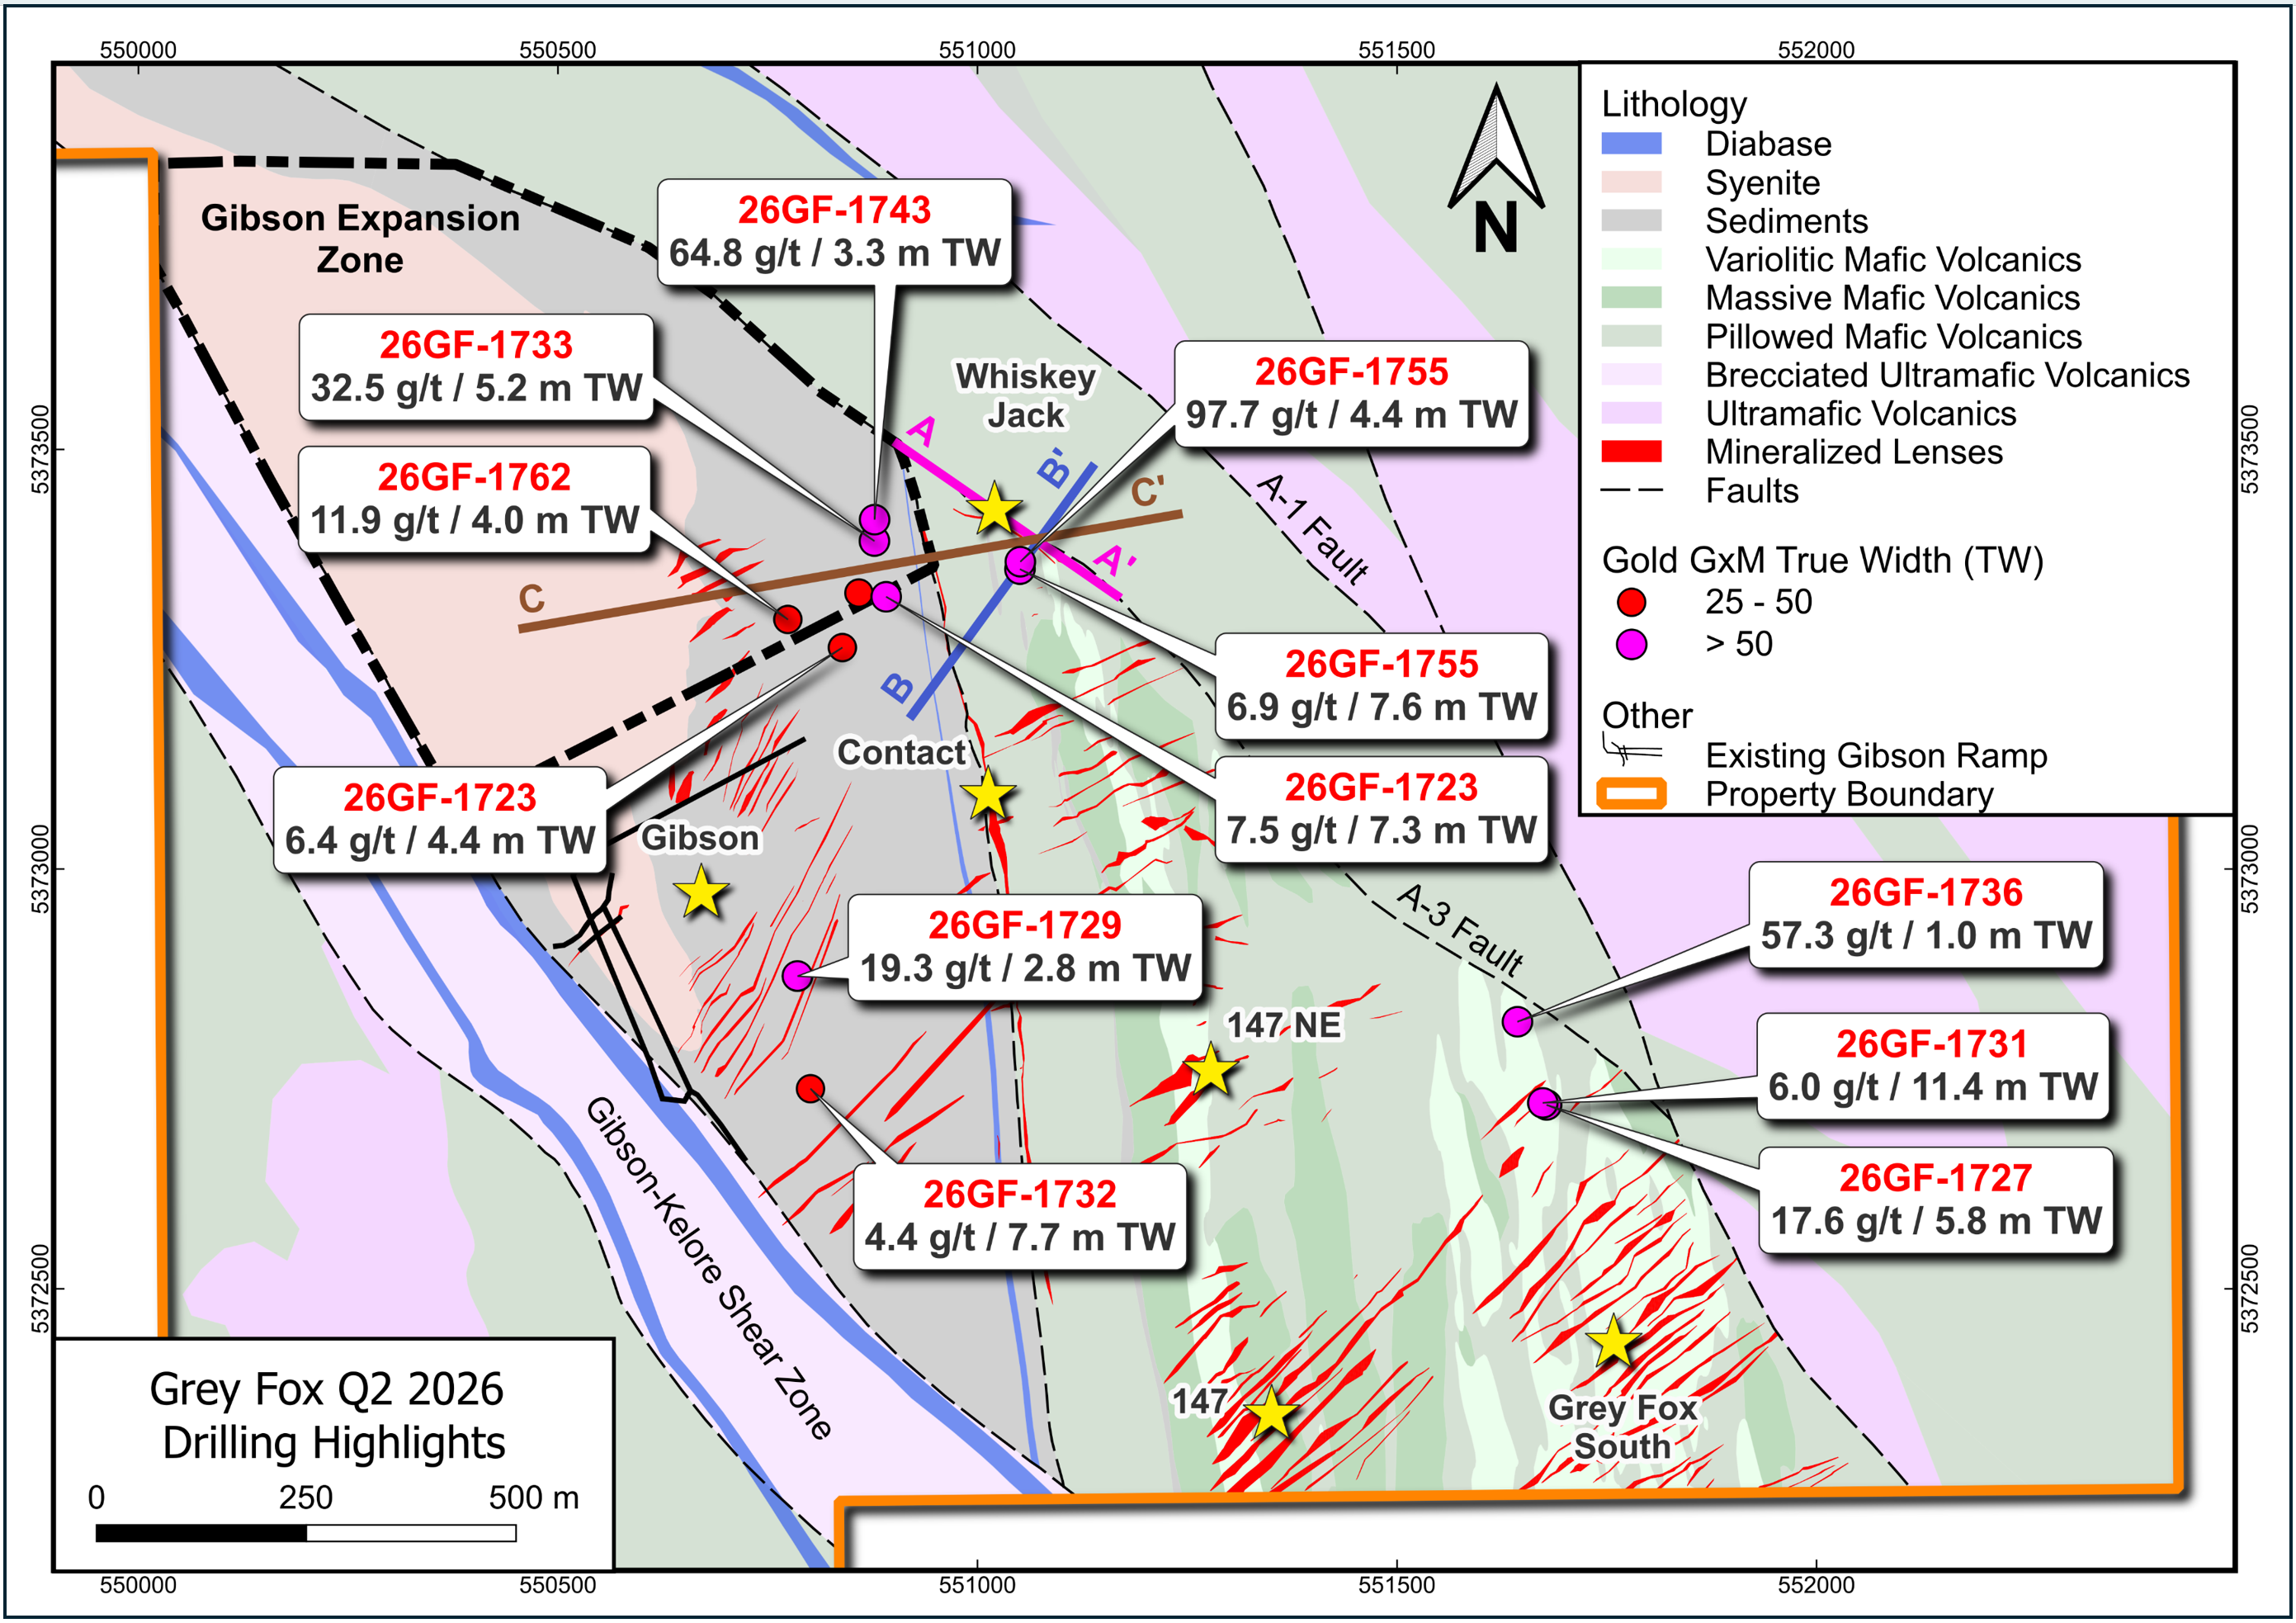
Exploration drilling during Q2 focused on three areas at Grey Fox: 1) Whiskey Jack, 2) Gibson and 3) Grey Fox South (Fig. 1, 2, 3, 4 & 5). Each area returned significant results, with multiple holes returning high gold grades over good thicknesses. These results have the potential to expand the Mineral Resource Estimate contained in the Grey Fox PFS that was released in Q2 and to extend our planned mine life beyond 2041. Discovering higher grades similar to these results is central to making
On June 8, 2026, a new Mineral Reserve Estimate was released for
Figure 1. Plan Map for the Grey Fox Deposit
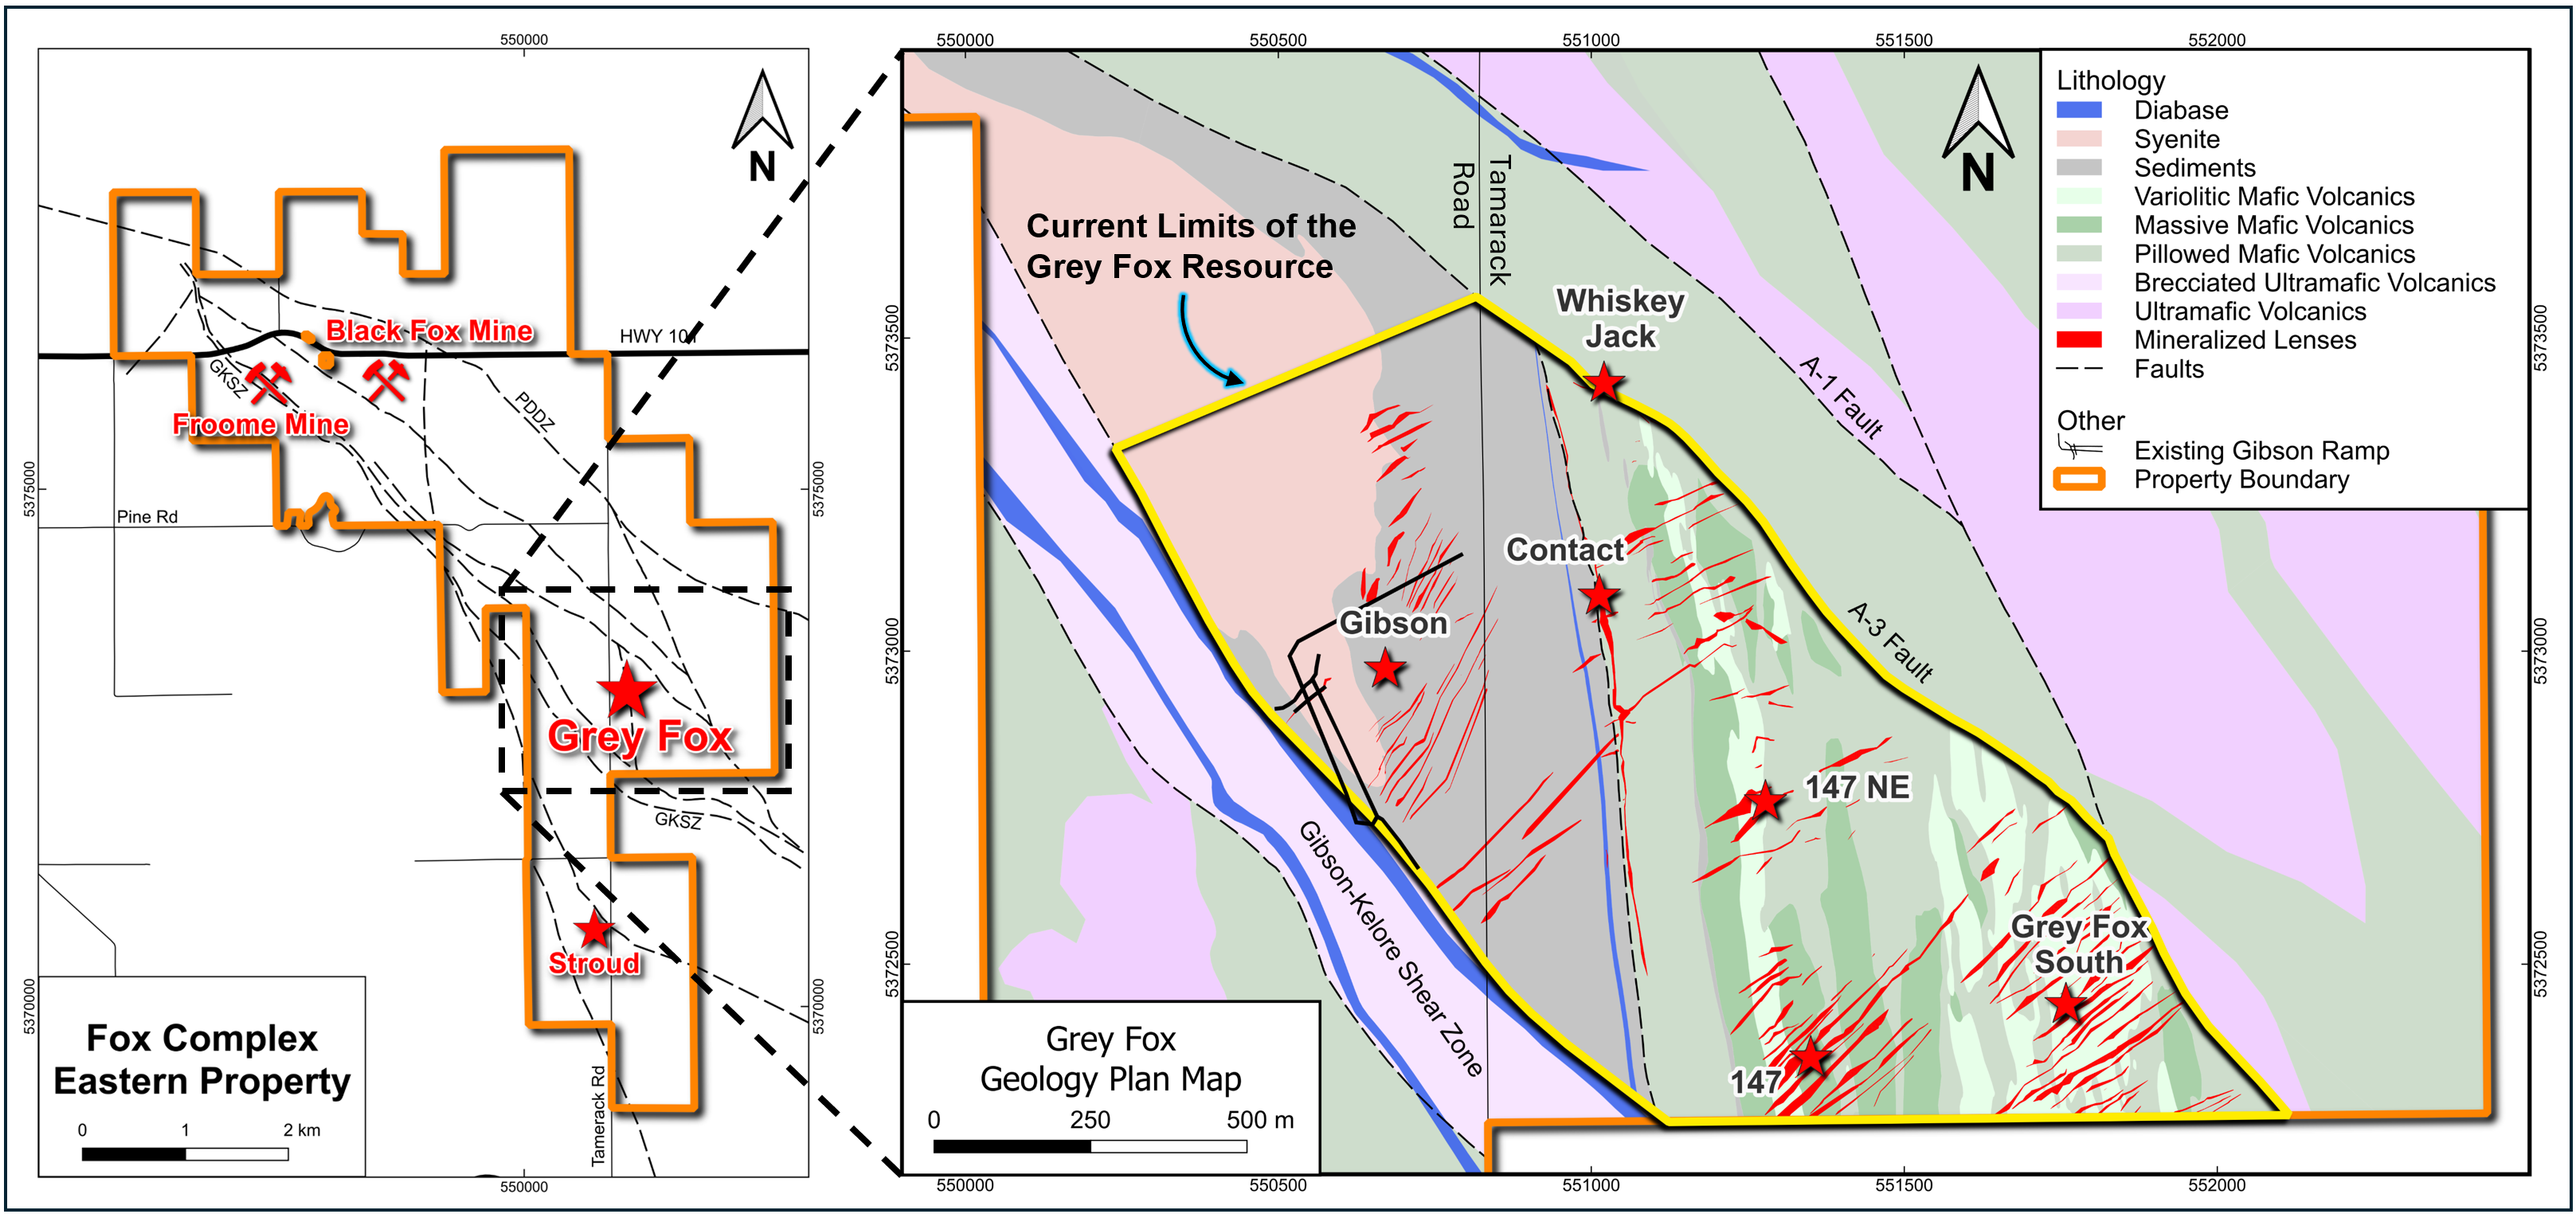
Figure 2. Plan Map for Grey Fox Project Highlighting Q2 Drill Results
Whiskey Jack
Whiskey Jack is the highest-grade zone at Grey Fox. Two new recent holes intersected very high grades and are located along the northwest limit of the current Mineral Resource Estimate (Fig. 2). There also appears to be good potential to further extend this mineralization at depth.
- 32.5 gpt gold over 5.2 meters (TW) in drillhole 26GF-1733
- 64.8 gpt gold over 3.3 meters (TW) in drillhole 26GF-1743
Drilling 60 meters below the Whiskey Jack mineralized zone and offsetting the initial deep hole that returned 11.9 gpt gold over 5.7 meters (TW) (news release dated
- 7.5 gpt gold over 7.3 meters (TW) in drillhole 26GF-1723
Figure 3. Longitudinal Section for the
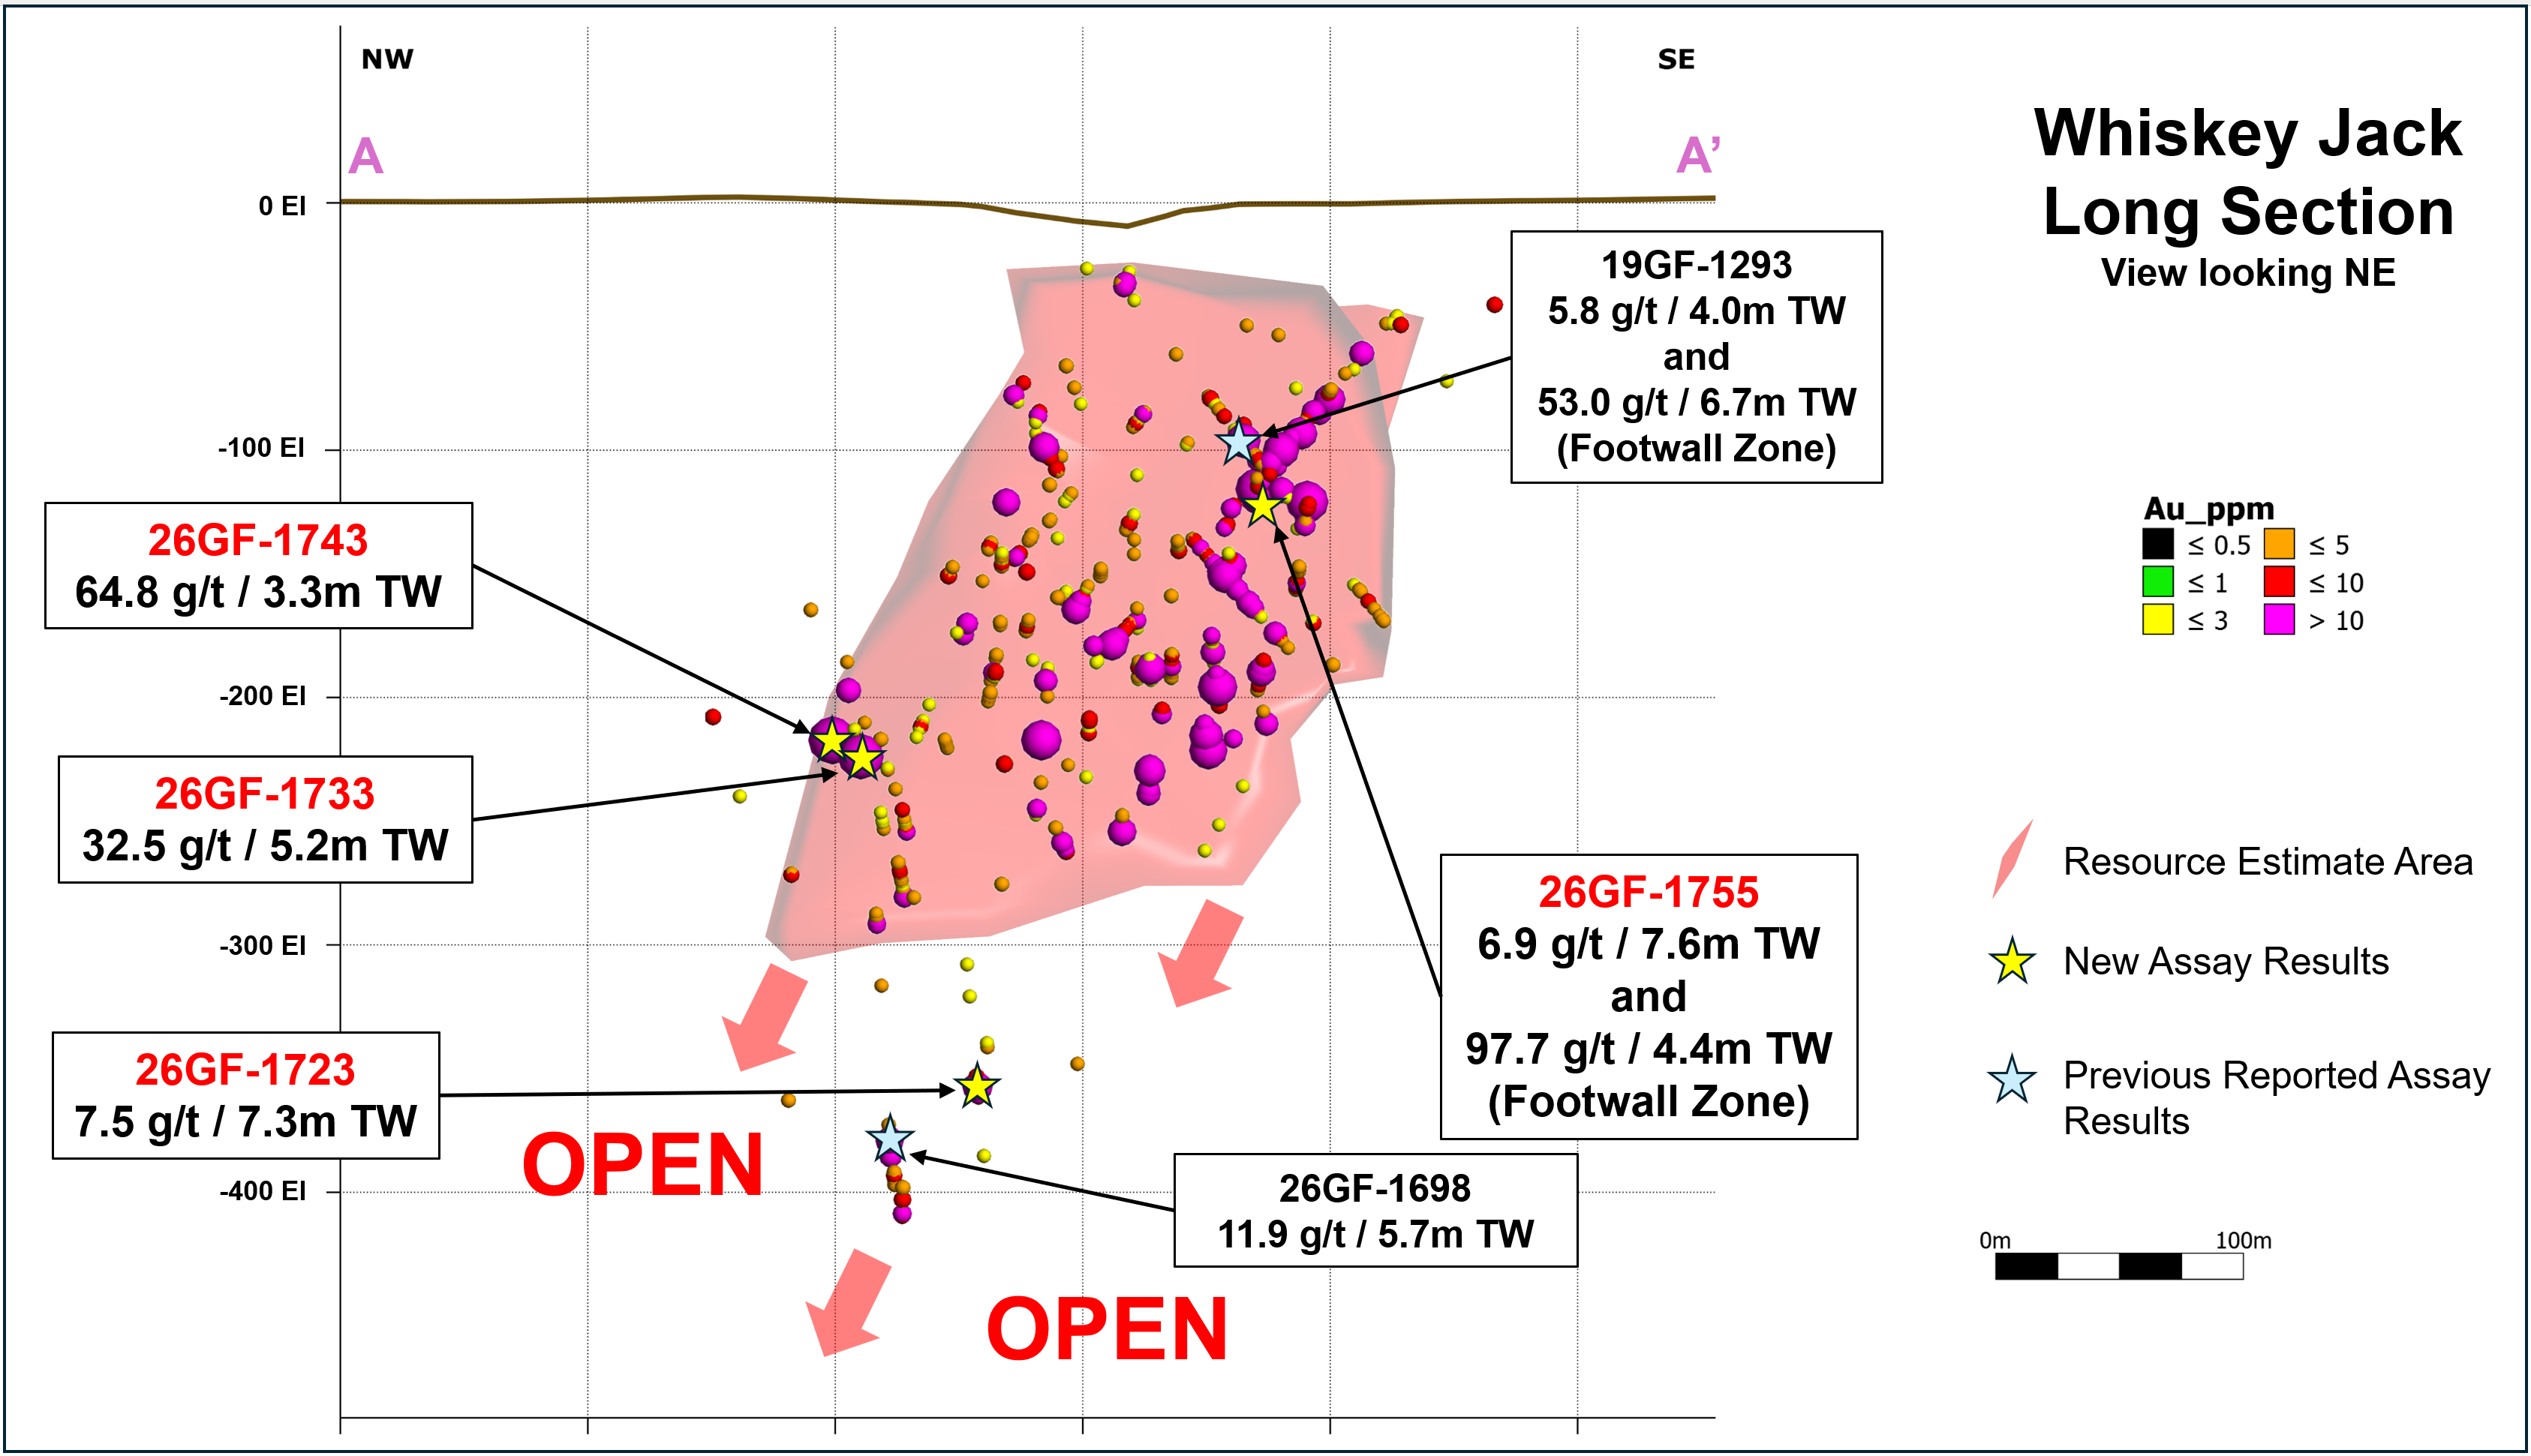
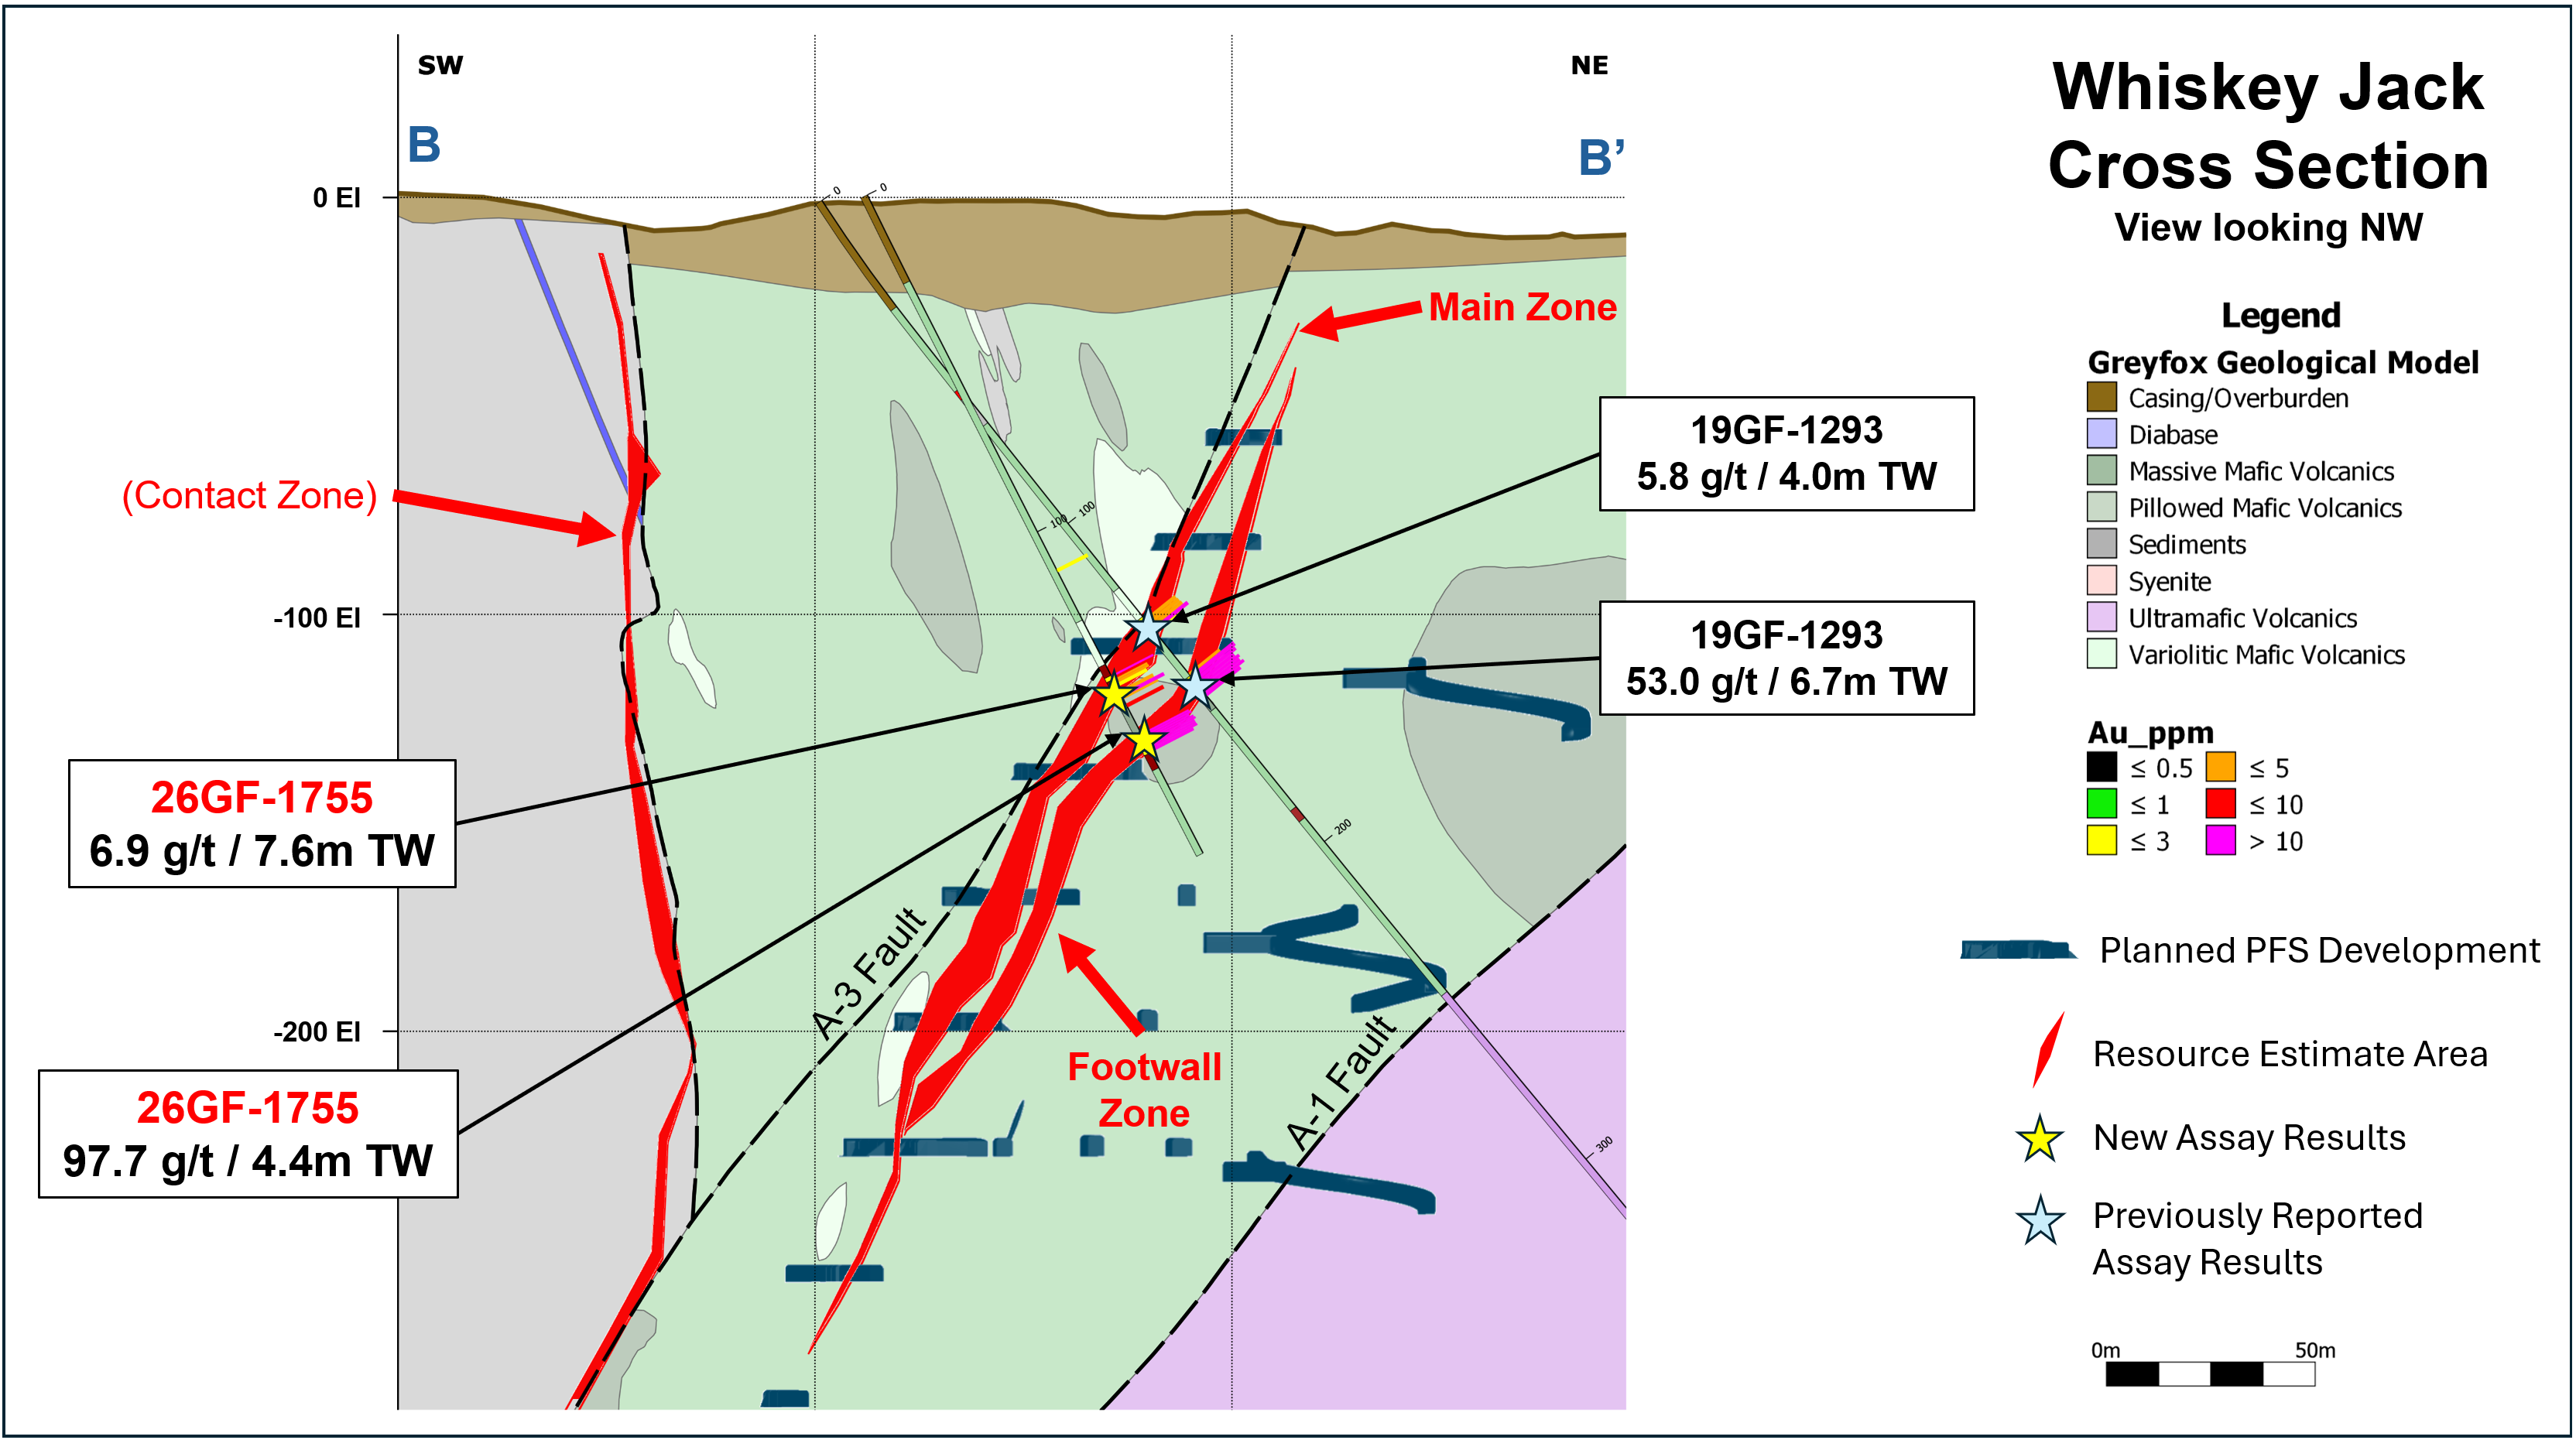
Significant high-grade was also recently encountered in the footwall of Whiskey Jack. The recent drilling targeted an area 20 meters below a previous hole that returned 53.0 gpt gold over 6.7 meters (TW) (Fig. 3 & 4).
- 97.7 gpt gold over 4.4 meters (TW) in drillhole 26GF-1755
Figure 4. Cross Section for the
Gibson
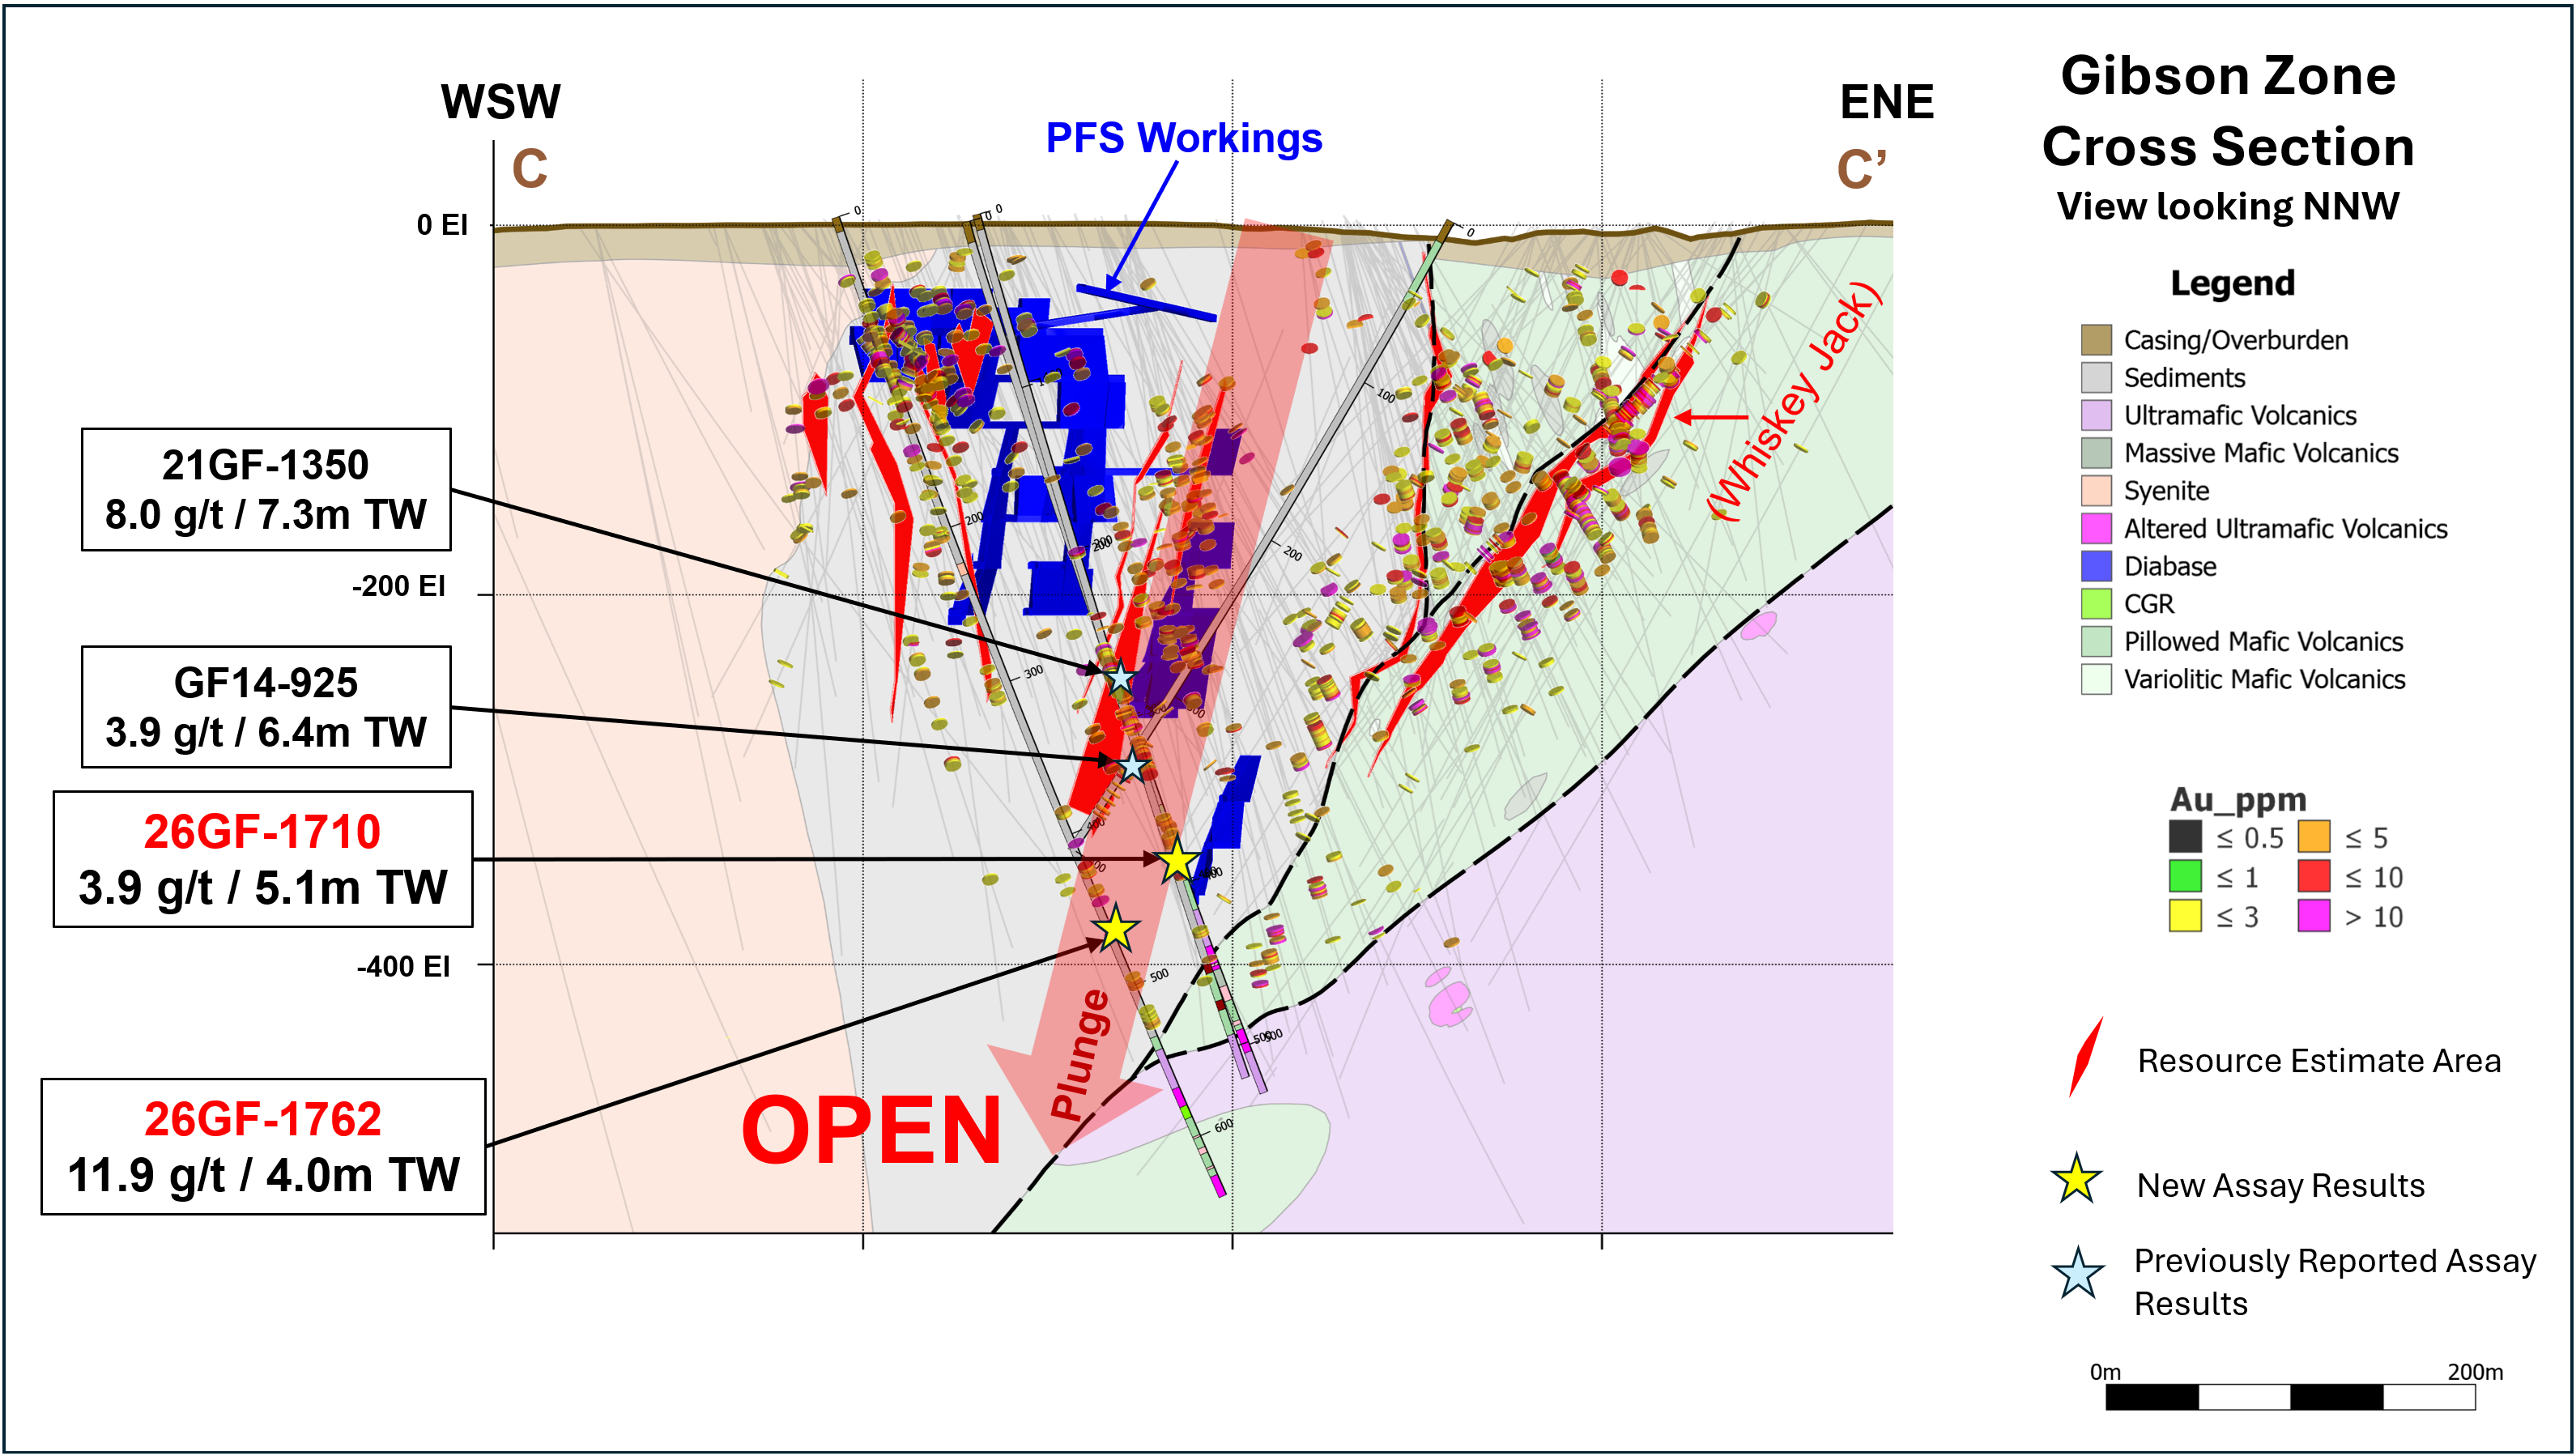
- 19.3 gpt gold over 2.8 meters (TW) in drillhole 26GF-1729
- 4.4 gpt gold over 7.7 meters (TW) in drillhole 26GF-1732
- 6.4 gpt gold over 4.4 meters (TW) in drillhole 26GF-1723
- 11.9 gpt gold over 4.0 meters (TW) in drillhole 26GF-1762
The intercept seen in drillhole 26GF-1762 is also important in terms of exploration potential at Gibson as it is open along strike and down-dip.
Figure 5. Cross Section for the
Grey Fox South
During Q2, the exploration team discovered what it believes is a new mineralized zone similar to Whiskey Jack, located approximately 850 meters southeast of the current Mineral Resource Estimate with drillhole 26GF-1736 (Fig. 2). The mineralization is open to the northwest and at depth. This new discovery highlights the continued prospective nature of the
- 17.6 gpt gold over 5.8 meters (TW) in drillhole 26GF-1727
- 6.0 gpt gold over 11.4 meters (TW) in drillhole 26GF-1731
- 57.3 gpt gold over 1.0 meters (TW) in drillhole 26GF-1736
Grey Fox drill results data (
The Company recently commissioned a Mineral Resource Estimate for the
The Company is advancing three key areas at its
During Q2, drilling at Windfall and
It is important to note that the results continue to show oxide mineralization that could potentially be processed using the same heap leaching technology currently used at the
Windfall (RCW = Reverse Circulation Width, CW = Core Width)
- 1.5 gpt gold over 44.2 meters (RCW) in drillhole WF157
- 2.8 gpt gold over 18.3 meters (RCW) in drillhole WF183
- 2.8 gpt gold over 16.8 meters (RCW) in drillhole WF140
- 1.3 gpt gold over 18.3 meters (RCW) in drillhole WF140
- 1.9 gpt gold over 16.1 meters (RCW) in drillhole WF218
- 1.4 gpt gold over 16.8 meters (RCW) in drillhole WF179
- 2.1 gpt gold over 42.7 meters (RCW) in drillhole WF158
- 1.4 gpt gold over 21.3 meters (RCW) in drillhole WF197
- 0.9 gpt gold over 91.4 meters (RCW) in drillhole LM073
- 1.2 gpt gold over 30.5 meters (RCW) in drillhole LM074
- 1.0 gpt gold over 51.8 meters (RCW) in drillhole LM070
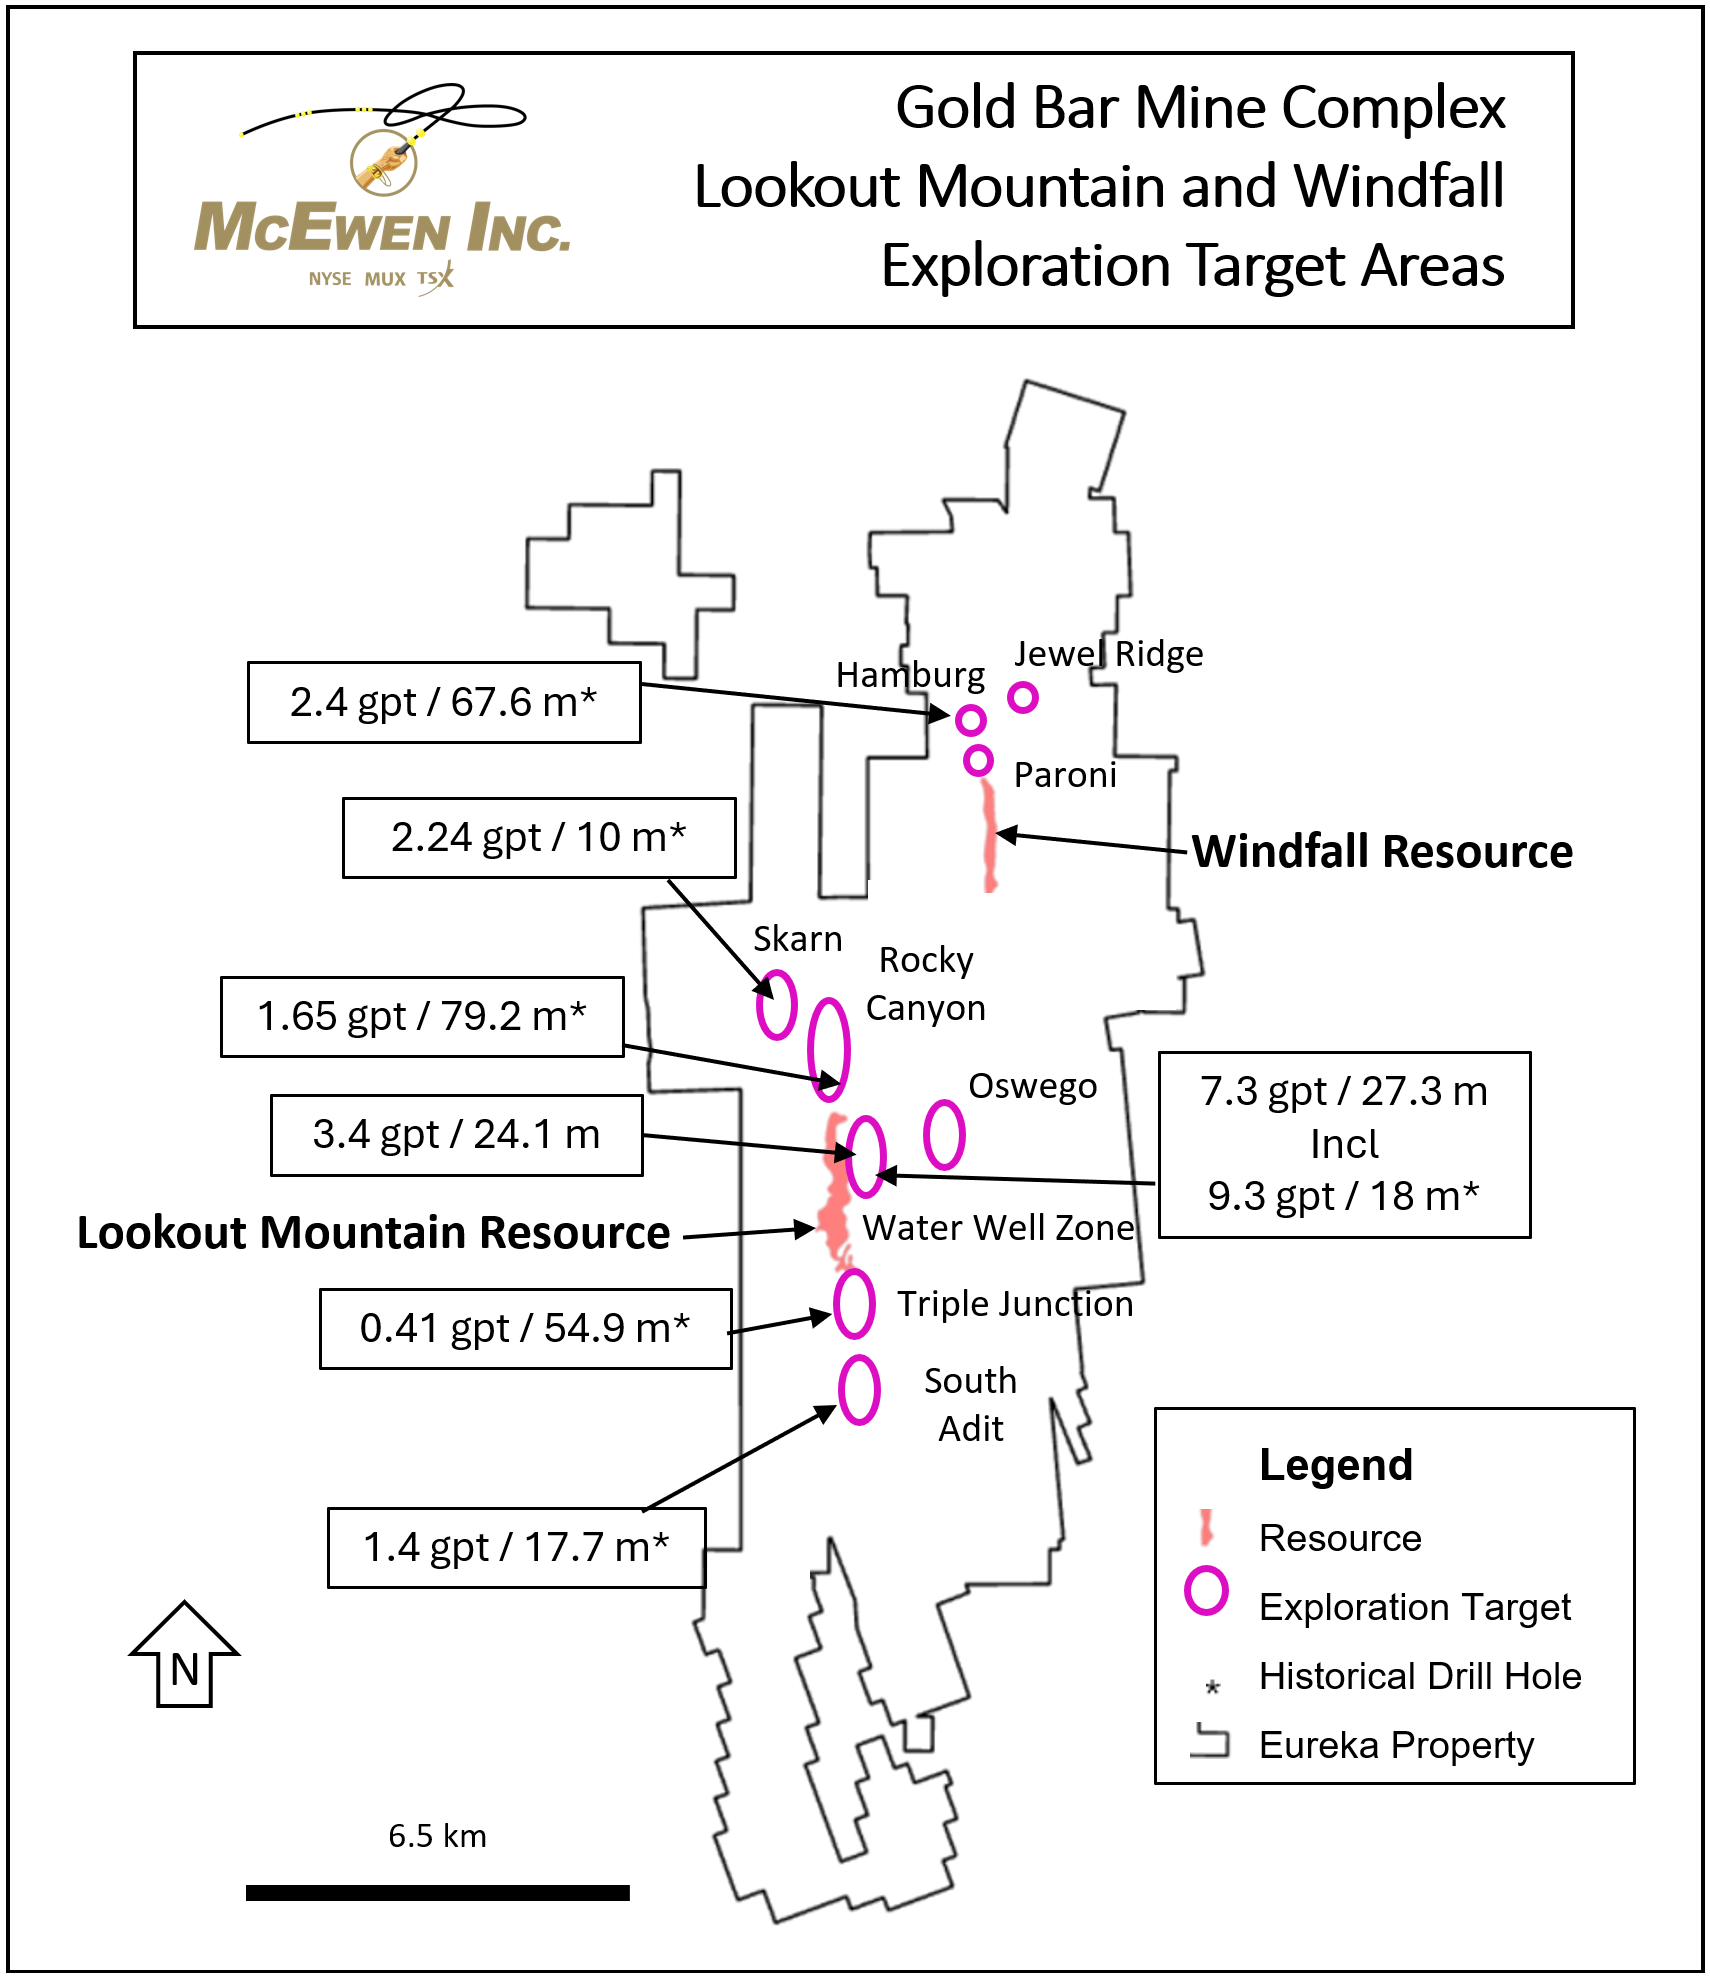
- 3.4 gpt gold over 24.1 meters (CW) in drillhole LM077
- 1.0 gpt gold over 33.5 meters (RCW) in drillhole LM085
The area surrounding
McEwen completed its first hole at the
- 3.4 gpt gold over 24.1 meters (CW) in drillhole LM077
This mineralization is open to the north and east and will be followed by additional drilling.
Immediately north of Windfall sits the recently acquired
Figure 6.
At
Recent drill results, continue to support the Company’s development plans for
- 2.5 gpt gold over 41.1 meters (RCW) in drillhole PK 181
- 2.2 gpt gold over 45.7 meters (RCW) in drillhole PK 109
- 1.8 gpt gold over 54.9 meters (RCW) in drillhole PK 182
- 3.0 gpt gold over 24.4 meters (RCW) in drillhole PK 154
- 1.5 gpt gold over 18.3 meters (RCW) in drillhole PK 154
- 1.9 gpt gold over 41.1 meters (RCW) in drillhole PK 115
- 1.7 gpt gold over 35.1 meters (RCW) in drillhole PK 096
- 1.6 gpt gold over 30.5 meters (RCW) in drillhole PK 180
- 1.8 gpt gold over 18.3 meters (RCW) in drillhole PK 157
- 2.9 gpt gold over 13.7 meters (RCW) in drillhole PK 156
- 1.1 gpt gold over 53.3 meters (RCW) in drillhole PK 174
- 1.0 gpt gold over 42.7 meters (RCW) in drillhole PK 170
- 1.0 gpt gold over 36.6 meters (RCW) in drillhole PK 145
- 1.8 gpt gold over 16.8 meters (RCW) in drillhole RG 047
- 1.6 gpt gold over 30.5 meters (RCW) in drillhole RG 055
Exploration at Tartan (Fig. 7 & 8)
In Q1, the Company released a Mineral Resource Estimate for the
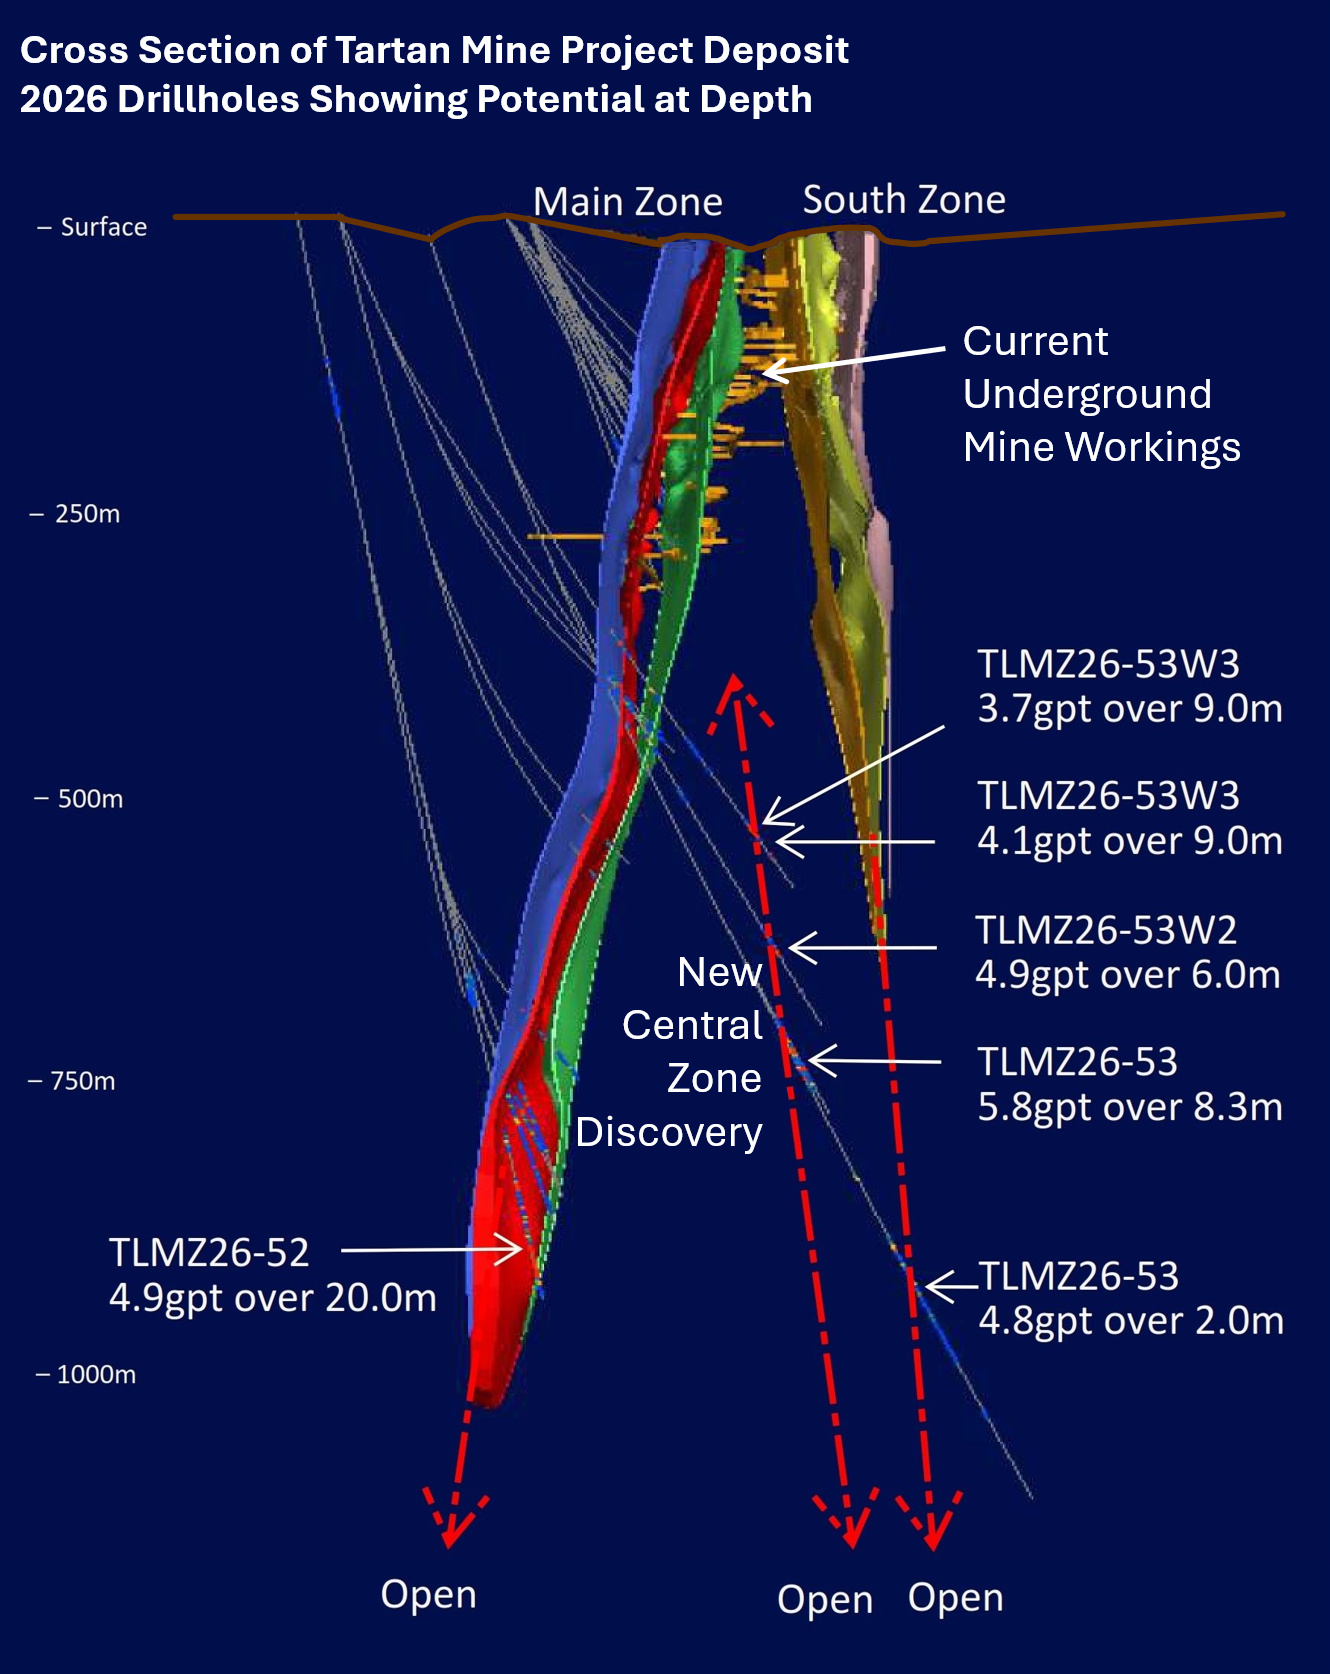
In addition to the new
New Central Zone Discovery (CW = Core Widths)
- 5.8 gpt gold over 8.3 meters (CW) in drillhole TLMZ26-53
- 4.1 gpt gold over 9.0 meters (CW) in drillhole TLMZ26-53W3
- 3.7 gpt gold over 9.0 meters (CW) in drillhole TLMZ26-53W3
- 4.9 gpt gold over 6.0 meters (CW) in drillhole TLMZ26-53W2
Expansion Along Eastern and Western Flanks (CW = Core Widths)
- 29.1 gpt gold over 10.0 meters (CW) in drillhole TLMZ26-67
Including 572.0 gpt gold over 0.5 meters - 17.8 gpt gold over 15.9 meters (CW) in drillhole TLMZ26-58
Including 241.6 gpt gold over 1.0 meter - 11.4 gpt gold over 6.7 meters (CW) in drillhole TLMZ26-55
- 11.1 gpt gold over 2.1 meters (CW) in drillhole TLMZ26-53W2
- 5.9 gpt gold over 2.0 meters (CW) in drillhole TLMZ26-53
- 4.9 gpt gold over 3.8 meters (CW) in drillhole TLMZ26-64
- 5.1 gpt gold over 3.0 meters (CW) in drillhole TLMZ26-52W4
- 6.1 gpt gold over 4.3 meters (CW) in drillhole TLMZ26-68
Deep South Zone Extension Depth (CW = Core Widths)
- 4.8 gpt gold over 2.0 meters (CW) in drillhole TLMZ26-53
Figure 7. Long Section of Tartan’s
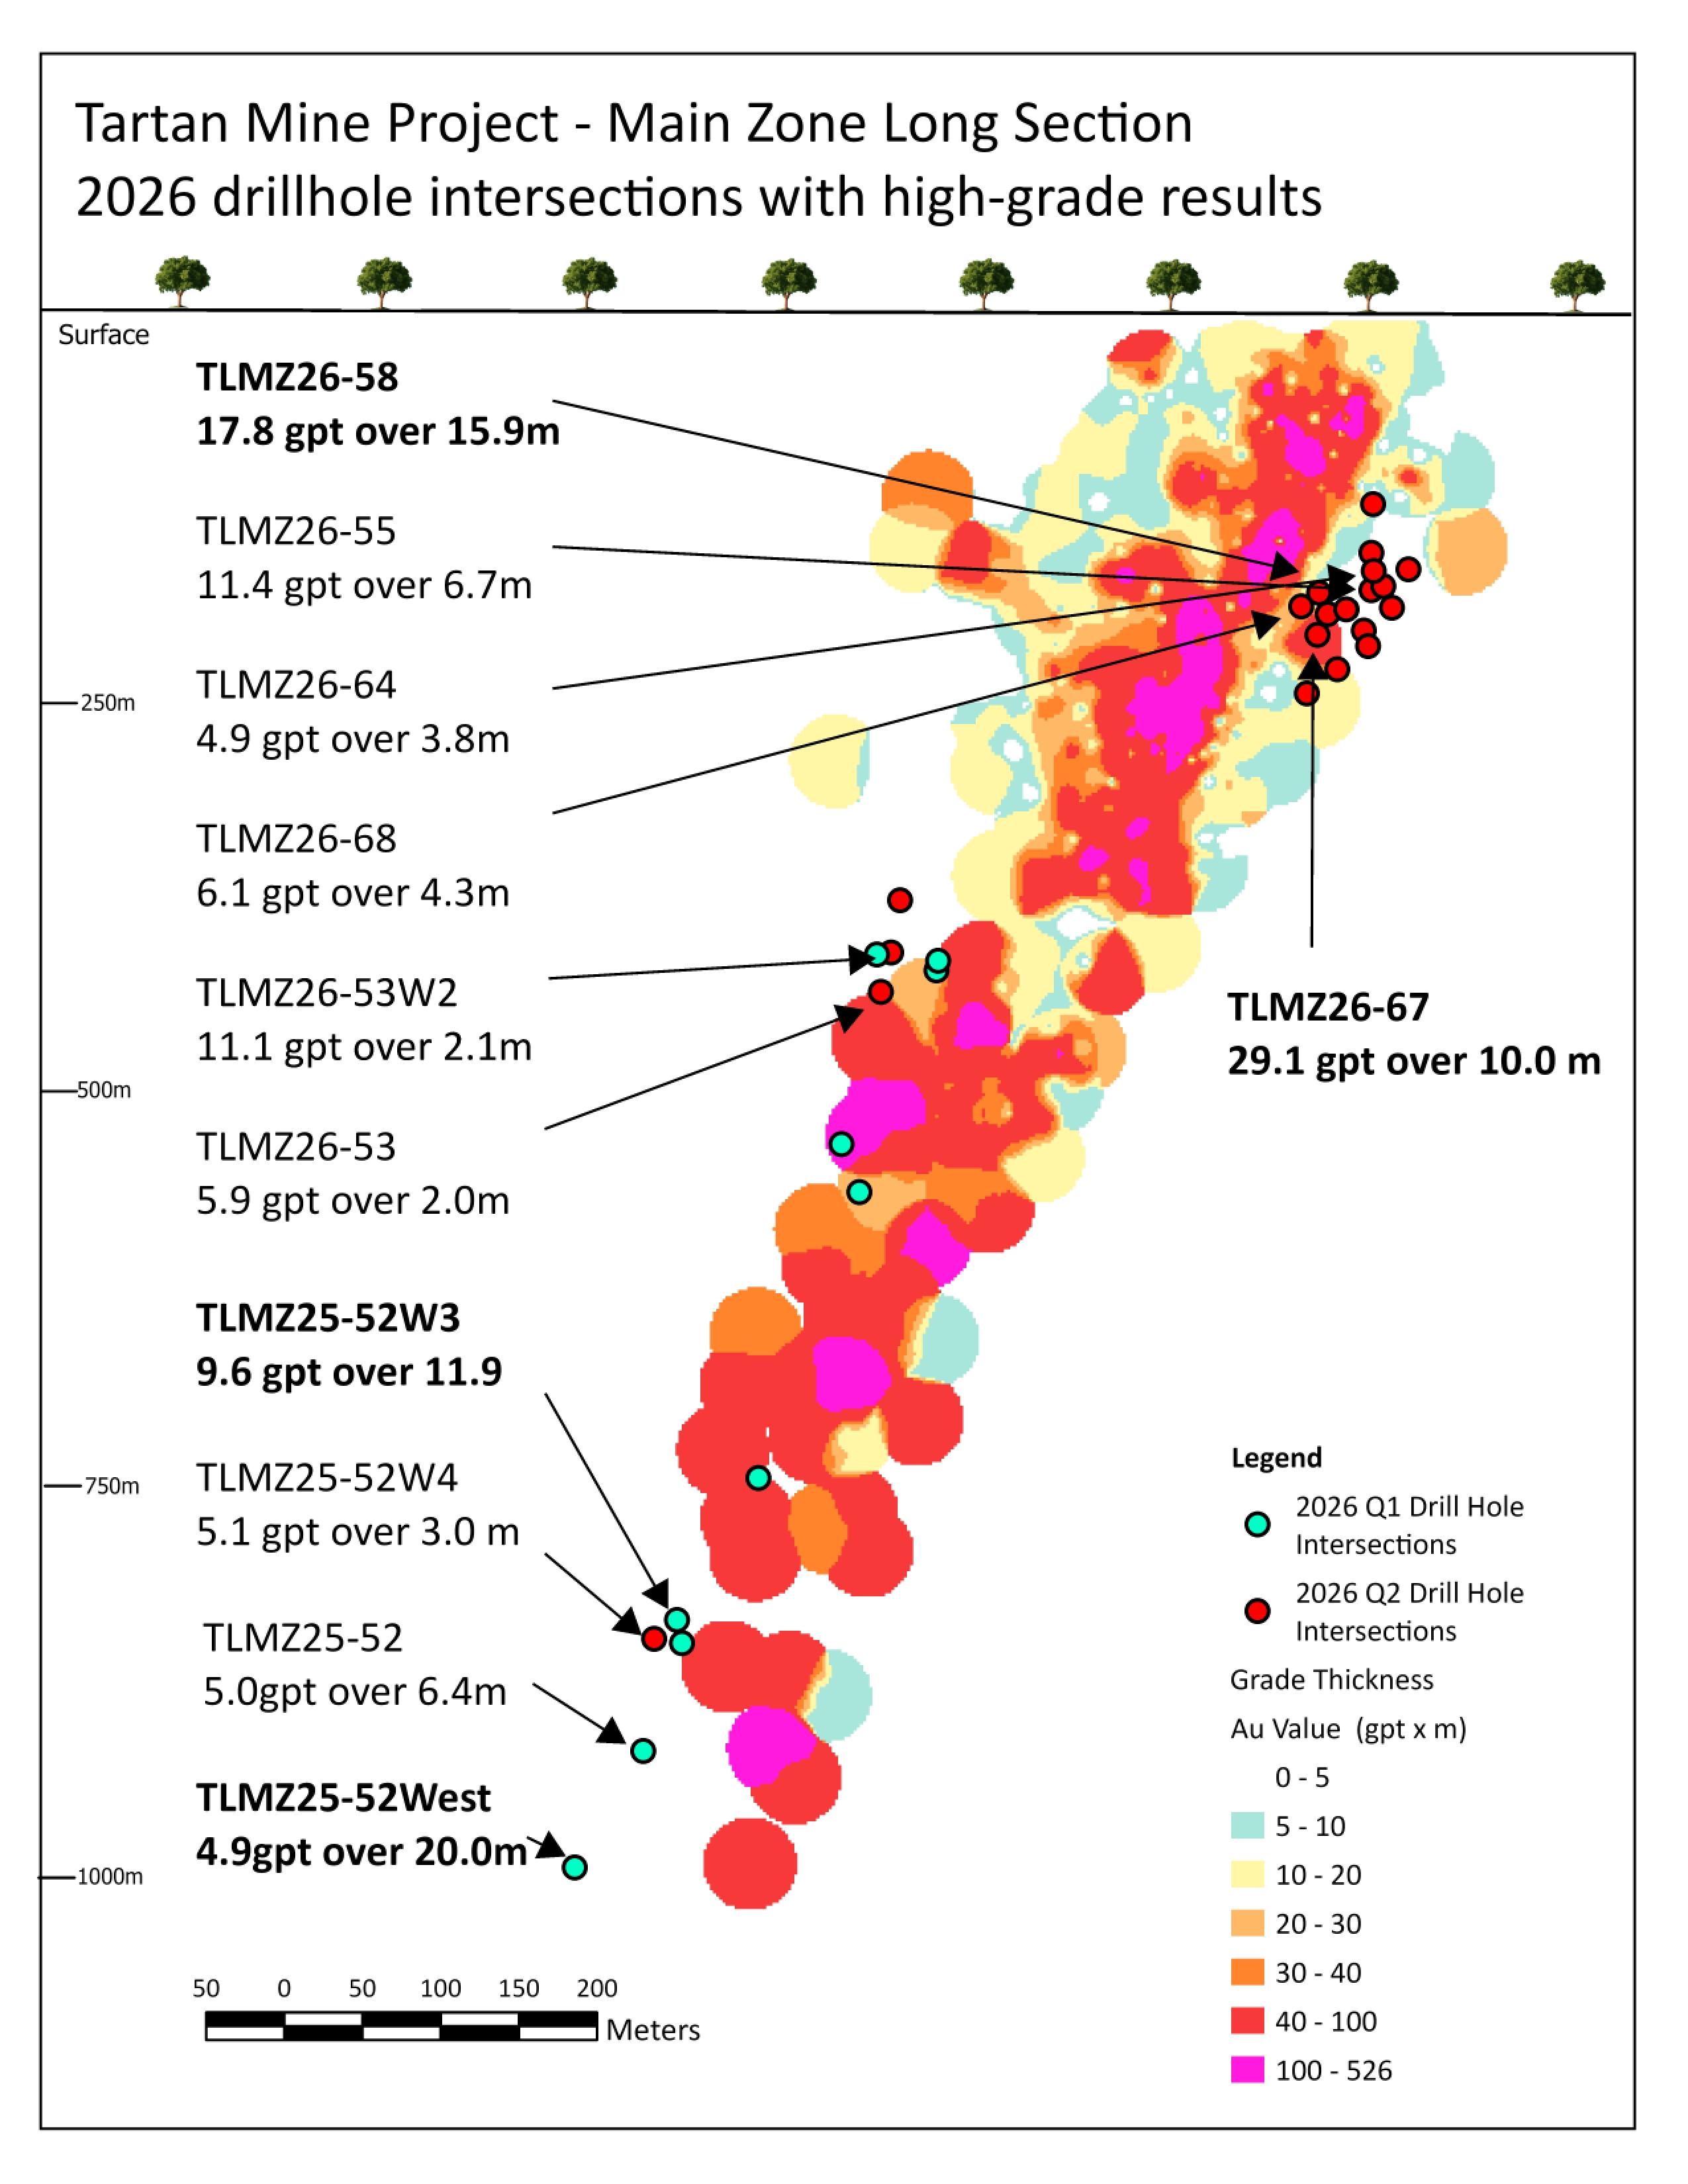
Figure 8. Cross Section of
For additional information, a table showing all drill results and locations from our exploration programs at Gold Bar, Fox and Tartan is available on the Company’s website and can be accessed by clicking here.
Highlights of Q2 2026
Abbreviations used are defined in the Glossary at the end of this press release.
| Revenue | Q2 2026 revenue increased by 27% to | |
| Profitability | Q2 2026 gross profit was Since our investment in the San José Mine is accounted for as an equity method investment, our | |
| Adjusted EBITDA | Q2 2026 adjusted EBITDA increased to Adjusted EBITDA is calculated by adding back our portion of | |
| Liquidity & Capital Resources at | Cash and equivalents increased to The value of marketable securities decreased to On As of The most recent financing of Debt principal outstanding remained unchanged at McEwen had 59.7M shares outstanding on | |
| San José Performance | 17,019 GEOs representing McEwen’s 49% ownership were produced in Q2 2026, continuing the mine’s strong quarterly performance. This is 17% higher than Q1 2026 and 24% higher than in Q2 2025. Higher production was the result of increased plant capacity, mining rates and gold recoveries. Production costs per GEO sold in Q2 2026 were stable at In May, McEwen received an | |
| Fox Complex Performance | 7,000 GEOs were produced in Q2. Costs per GEO sold in Q2 were | |
| Gold Bar Performance | 5,842 GEOs were produced from the Costs per GEO sold in Q2 were | |
| Exploration & Development | ||
| Health & Safety | Zero lost-time incidents across our 100%-owned operations. | |
| 2026 Production & Unit Costs Outlook | Full-year 2026 production guidance was updated to 109,000 - 120,000 GEOs, including our attributable production from our 49%-owned San José mine and assuming a 77:1 silver-to-gold ratio. Our production guidance does not include early pre-commercial production from the Stock mine. Consolidated costs per ounce guidance ranges have been updated, at | |
Management Conference Call
Management will discuss our financial results and project developments, followed by a question-and-answer session.
| McEwen Q2 2026 Results Conference Call Listen to the webcast: Shareholders and other attendees can register here: https://events.q4inc.com/attendee/349025307/guest Ask a question during the live Q&A: Analysts and other participants who wish to ask a question by phone can register here: https://events.q4inc.com/analyst/349025307?pwd=4Vp35oF5 |
An archived replay of the webcast will be available approximately two hours after the conclusion of the live event. Access the replay on the Company’s media page at https://www.mcewenmining.com/media.
Glossary of Terms and Abbreviations
| Au | – gold | oz | – troy ounce |
| AISC | – all-in sustaining costs | PFS | – pre-feasibility study |
| B | – billion | Q1 | – first quarter ( |
| CW | – core width | Q2 | – second quarter ( |
| ft | – foot | If not followed by a specific year, it references Q2 2026 | |
| FS | – feasibility study | Q3 | – third quarter ( |
| GEO | – gold equivalent ounce | Q4 | – fourth quarter ( |
| gpt | – grams per tonne | RCW | – reverse circulation width |
| H1 | – first half of the year ( | t | – tonne |
| H2 | – second half of the year ( | tpd | – tonnes per day |
| ktpa | – kilotonnes per annum | tpa | – tonnes per annum |
| m | – meter | TW | – true width |
| M | – million | ||
Table 3. Q2 2026 Production and Costs1, Comparatives from Q2 2025 and 2026 Annual Guidance
| Q2 | H1 | Full Year 2026 Revised Guidance | |||||||
| 2026 | 2025 | 2026 | 2025 | ||||||
| Consolidated Production | |||||||||
| GEOs(2) (3) | 13,852 | 13,835 | 29,741 | 27,042 | 109,000 – 120,000 | ||||
| GEOs | 5,842 | 8,406 | 13,726 | 16,094 | 30,000 – 33,000 | ||||
| Cash Costs/GEO | $ | 2,705 | $ | 1,679 | $ | 2,565 | $ | 1,419 | |
| AISC/GEO | $ | 3,197 | $ | 1,792 | $ | 2,915 | $ | 1,986 | |
| GEOs | 7,000 | 5,429 | 12,785 | 10,948 | 20,000 – 23,000 | ||||
| Cash Costs/GEO | $ | 1,972 | $ | 2,212 | $ | 2,152 | $ | 2,142 | |
| AISC/GEO | $ | 2,701 | $ | 2,563 | $ | 2,892 | $ | 2,534 | |
| San José Mine, | |||||||||
| GEOs | 17,019 | 13,719 | 31,601 | 24,643 | 59,000 – 64,000 | ||||
| Cash Costs/GEO | $ | 2,466 | $ | 2,310 | $ | 2,414 | $ | 2,428 | |
| AISC/GEO | $ | 2,913 | $ | 2,842 | $ | 2,806 | $ | 2,933 | |
Notes to Table 3:
- Cash gross profit, cash costs per ounce, and all-in sustaining costs (AISC) per ounce, adjusted earnings before interest, taxes, depreciation, and amortization (adjusted EBITDA) and adjusted EBITDA per share are non-GAAP financial performance measures with no standardized definition under
U.S . GAAP. For definitions of these non-GAAP measures, refer to the “Non-GAAP Financial Measures” section in this press release. For reconciliations to the closestU.S . GAAP measures, see the Management Discussion and Analysis for the quarter endedJune 30, 2026 , filed on EDGAR and SEDAR Plus. - Gold Equivalent Ounces (GEOs) are calculated using gold-to-silver price ratio of 61:1 for Q2 2026 and 99:1 for Q2 2025. 2026 production guidance is calculated based on 77:1 gold to silver price ratio.
El Gallo contributed 994 GEOs of production in Q2 2026 and 3,214 in H1 2026.- San José Mine figures represent the portion attributable to McEwen from its 49% interest in the San José Mine.
CAUTIONARY NOTE REGARDING NON-GAAP MEASURES
We have included in this report certain non-GAAP performance measures as detailed below. In the gold mining industry, these are common performance measures but do not have any standardized meaning and are considered non-GAAP measures. We use these measures to evaluate our business on an ongoing basis and believe that, in addition to conventional measures prepared in accordance with GAAP, certain investors use such non-GAAP measures to evaluate our performance and ability to generate cash flow. We also report these measures to provide investors and analysts with useful information about our underlying costs of operations and clarity over our ability to finance operations. Accordingly, they are intended to provide additional information and should not be considered in isolation or as a substitute for measures of performance prepared in accordance with GAAP. There are limitations associated with the use of such non-GAAP measures. We compensate for these limitations by relying primarily on our
The non-GAAP measures are presented for our wholly owned mines and our interest in the San José mine. The amounts in the reconciliation tables labeled “49% basis” were derived by applying to each financial statement line item the ownership percentage interest used to arrive at our share of net income or loss during the period when applying the equity method of accounting. We do not control the interest in or operations of MSC and the presentations of assets and liabilities and revenues and expenses of MSC do not represent our legal claim to such items. The amount of cash we receive is based upon specific provisions of the Option and Joint Venture Agreement (“OJVA”) and varies depending on factors including the profitability of the operations.
The presentation of these measures, including the minority interest in the San José, has limitations as an analytical tool. Some of these limitations include:
- The amounts shown on the individual line items were derived by applying our overall economic ownership interest percentage determined when applying the equity method of accounting and do not represent our legal claim to the assets and liabilities, or the revenues and expenses; and
- Other companies in our industry may calculate their cash costs, cash cost per ounce, all-in sustaining costs, all-in sustaining costs per ounce, adjusted EBITDA, and average realized price per ounce differently than we do, limiting the usefulness as a comparative measure.
Cash Costs and All-In Sustaining Costs
The terms cash costs, cash cost per ounce, all-in sustaining costs (“AISC”), and all-in sustaining cost per ounce used in this report are non-GAAP financial measures. We report these measures to provide additional information regarding operational efficiencies on an individual mine basis, and believe these measures provide investors and analysts with useful information about our underlying costs of operations.
Cash costs consist of mining, processing, on-site general and administrative expenses, community and permitting costs related to current operations, royalty costs, refining and treatment charges (for both doré and concentrate products), sales costs, export taxes and operational stripping costs, but exclude depreciation and amortization (non-cash items). The sum of these costs is divided by the corresponding gold equivalent ounces sold to determine a per ounce amount.
All-in sustaining costs consist of cash costs (as described above), plus accretion of retirement obligations and amortization of the asset retirement costs related to operating sites, environmental rehabilitation costs for mines with no reserves, sustaining exploration and development costs, sustaining capital expenditures and sustaining lease payments. Our all-in sustaining costs exclude the allocation of corporate general and administrative costs. The following is additional information regarding our all-in sustaining costs:
- Sustaining operating costs represent expenditures incurred at current operations that are considered necessary to maintain current annual production at the mine site and include mine development costs and ongoing replacement of mine equipment and other capital facilities. Sustaining capital costs do not include costs of expanding the project that would result in improved productivity of the existing asset, increased existing capacity or extended useful life.
- Sustaining exploration and development costs include expenditures incurred to sustain current operations and to replace reserves and/or resources extracted as part of the ongoing production. Exploration activities performed near-mine (brownfield) or new exploration projects (greenfield) are classified as non-sustaining.
The sum of all-in sustaining costs is divided by the corresponding gold equivalent ounces sold to determine a per ounce amount.
Costs excluded from cash costs and all-in sustaining costs, in addition to depreciation and depletion, are income and mining tax expenses, all corporate financing charges, costs related to business combinations, asset acquisitions and asset disposal, and any items that are deducted for the purpose of normalizing items.
The following tables reconcile these non-GAAP measures to the most directly comparable GAAP measure, production costs applicable to sales:
| Three months ended | Six months ended | |||||||||||||||||||||
| Gold Bar | Total | Gold Bar | Total | |||||||||||||||||||
| (in thousands, except per ounce) | (in thousands, except per ounce) | |||||||||||||||||||||
| Production costs applicable to sales (100% owned) - cash costs | $ | 15,871 | $ | 14,232 | $ | 30,103 | $ | 35,250 | $ | 28,943 | $ | 64,193 | ||||||||||
| Less: costs of externally sourced material processed | — | (1,010 | ) | (1,010 | ) | — | (2,722 | ) | (2,722 | ) | ||||||||||||
| Production costs applicable to sales (100% owned) | 15,871 | 13,222 | 29,093 | 35,250 | 26,221 | 61,471 | ||||||||||||||||
| In-mine exploration | 47 | — | 47 | 131 | — | 131 | ||||||||||||||||
| Capitalized mine development (sustaining) | — | 4,852 | 4,852 | — | 8,939 | 8,939 | ||||||||||||||||
| Capital expenditures on plant and equipment (sustaining) | 2,835 | — | 2,835 | 4,681 | — | 4,681 | ||||||||||||||||
| Sustaining leases | — | 37 | 37 | — | 71 | 71 | ||||||||||||||||
| All-in sustaining costs | $ | 18,753 | $ | 18,111 | $ | 36,863 | $ | 40,062 | $ | 35,231 | $ | 75,293 | ||||||||||
| Ounces sold, including stream (GEO) | 5,866 | 7,088 | 12,954 | 13,744 | 12,737 | 26,481 | ||||||||||||||||
| Less: ounces from externally sourced material processed (GEO) | — | (382 | ) | (382 | ) | — | (554 | ) | (554 | ) | ||||||||||||
| Ounces sold from own production, including stream (GEO) | 5,866 | 6,706 | 12,572 | 13,744 | 12,183 | 25,927 | ||||||||||||||||
| Cash cost per ounce sold ($/GEO) | $ | 2,705 | $ | 1,972 | $ | 2,394 | $ | 2,565 | $ | 2,152 | $ | 2,476 | ||||||||||
| AISC per ounce sold ($/GEO) | $ | 3,197 | $ | 2,701 | $ | 2,932 | $ | 2,915 | $ | 2,892 | $ | 2,904 | ||||||||||
| Three months ended | Six months ended | ||||||||||||||||||||
| Gold Bar | Total | Gold Bar | Total | ||||||||||||||||||
| (in thousands, except per ounce) | (in thousands, except per ounce) | ||||||||||||||||||||
| Production costs applicable to sales (100% owned) - cash costs | $ | 14,020 | $ | 13,713 | $ | 27,733 | $ | 23,113 | $ | 24,225 | $ | 47,338 | |||||||||
| In-mine exploration | 67 | — | 67 | 67 | — | 67 | |||||||||||||||
| Capitalized underground mine development (sustaining) | — | 2,140 | 2,140 | 7,597 | 4,478 | 12,075 | |||||||||||||||
| Capital expenditures on plant and equipment (sustaining) | 870 | — | 870 | 1,535 | — | 1,535 | |||||||||||||||
| Sustaining leases | 9 | 32 | 41 | 22 | (43 | ) | (21 | ) | |||||||||||||
| All-in sustaining costs | $ | 14,966 | $ | 15,885 | $ | 30,851 | $ | 32,334 | $ | 28,660 | $ | 60,994 | |||||||||
| Ounces sold, including stream (GEO) | 8,350 | 6,199 | 14,549 | 16,285 | 11,311 | 27,596 | |||||||||||||||
| Cash cost per ounce sold ($/GEO) | $ | 1,679 | $ | 2,212 | $ | 1,906 | $ | 1,419 | $ | 2,142 | $ | 1,715 | |||||||||
| AISC per ounce sold ($/GEO) | $ | 1,792 | $ | 2,563 | $ | 2,120 | $ | 1,986 | $ | 2,534 | $ | 2,210 | |||||||||
| Three months ended | Six months ended | ||||||||||||||||
| 2026 | 2025 | 2026 | 2025 | ||||||||||||||
| San José mine cash costs (100% basis) | (in thousands, except per ounce) | ||||||||||||||||
| Production costs applicable to sales - cash costs | $ | 77,317 | $ | 63,603 | $ | 155,188 | $ | 120,191 | |||||||||
| Site exploration expenses | 5,716 | 1,825 | 10,057 | 3,155 | |||||||||||||
| Capitalized underground mine development (sustaining) | 5,323 | 9,086 | 11,074 | 17,847 | |||||||||||||
| Less: Depreciation | (201 | ) | (658 | ) | (419 | ) | (1,352 | ) | |||||||||
| Capital expenditures (sustaining) | 3,183 | 4,254 | 4,477 | 5,174 | |||||||||||||
| All-in sustaining costs | $ | 91,338 | $ | 78,246 | $ | 180,378 | $ | 145,218 | |||||||||
| Ounces sold (GEO) | 31,351 | 27,530 | 64,284 | 49,507 | |||||||||||||
| Cash cost per ounce sold ($/GEO) | $ | 2,466 | $ | 2,310 | $ | 2,414 | $ | 2,428 | |||||||||
| AISC per ounce sold ($/GEO) | $ | 2,913 | $ | 2,842 | $ | 2,806 | $ | 2,933 | |||||||||
Adjusted EBITDA
Adjusted earnings before interest expense, taxes, depreciation, and amortization (“Adjusted EBITDA”) is a non-GAAP financial measure and does not have any standardized meaning. We use adjusted EBITDA to evaluate our operating performance and ability to generate cash flow from our gold operations in production, including the San José mine; we believe this measure provides valuable assistance to investors and analysts in evaluating our ability to finance our gold operations and capital activities separately from our other operations and investments. The most directly comparable measure prepared in accordance with GAAP is net income (loss).
The following tables present a reconciliation of adjusted EBITDA:
| Three months ended | Six months ended | |||||||||||||||
| 2026 | 2025 | 2026 | 2025 | |||||||||||||
| (in thousands) | (in thousands) | |||||||||||||||
| Net income (loss) | $ | 9,606 | $ | 3,040 | $ | 42,985 | $ | (3,230 | ) | |||||||
| Less: | ||||||||||||||||
| Depreciation and depletion | 8,187 | 6,853 | 15,264 | 13,024 | ||||||||||||
| Loss from investment in Paragon Advanced Labs Inc. (Note 9) | 663 | 978 | ||||||||||||||
| Loss from investment in | 5,434 | 6,978 | 7,508 | 15,556 | ||||||||||||
| Interest expense | 2,151 | 1,549 | 4,274 | 2,858 | ||||||||||||
| Income and mining tax recovery | (3,186 | ) | (1,111 | ) | (3,990 | ) | (2,190 | ) | ||||||||
| Adjusted EBITDA | $ | 22,225 | $ | 17,309 | $ | 67,020 | $ | 26,018 | ||||||||
| Weighted average shares outstanding (thousands) | 59,998 | 53,968 | 59,694 | 53,623 | ||||||||||||
| Adjusted EBITDA per share | $ | 0.37 | $ | 0.32 | $ | 0.89 | $ | 0.49 | ||||||||
Technical Information
The technical content of this news release related to financial results, mining, reserves and development projects has been reviewed and approved by
Technical information pertaining to
Technical information pertaining to the
Technical information pertaining to resource estimates and the
Technical information pertaining to resource estimates contained in this news release has been reviewed and approved by
Analyses reported herein were submitted either as half core or reverse circulation (RC) chip samples and assayed by the photon assay method either at the accredited laboratories of
(
Reliability of Information Regarding San José
The Company accounts for its investment in
ABOUT MCEWEN
McEwen is a diversified gold, silver and copper company trading on the NYSE and TSX under the ticker symbol “MUX”.
The Company provides shareholders exposure to a growing base of gold and silver production in prolific mineral-rich regions throughout the Americas including the Cortez Trend in Nevada, USA, the Timmins district of Ontario and Flin Flon in Manitoba, Canada, and the Deseado Massif in Santa Cruz province, Argentina. McEwen is also advancing the reactivation of its El Gallo gold and silver mine in Mexico. The Company’s near-term objective is to double its total annual production to 250,000–300,000 gold equivalent ounces by 2030.
In addition, McEwen provides exposure to copper through its 46.3% interest in McEwen Copper, which owns the large, long-life, advanced-stage Los Azules development project in San Juan, Argentina. Based on the last equity financing for McEwen Copper, the implied value of McEwen’s ownership interest is US$457 M.
Los Azules is being developed with the goal of becoming one of the world’s first regenerative copper mines and achieving carbon neutrality by 2038. The Feasibility Study released on October 7, 2025 highlights the project's strong economics and focus on environmental stewardship.
McEwen also recently purchased 27.3% of Paragon Advanced Labs Inc., a publicly traded company deploying PhotonAssay™ units around the world, a technology that the Company believes is poised to become the new industry standard for assaying precious and base metals, with Paragon seeking to become a leading service provider in the sector.
Chairman and Chief Owner Rob McEwen has invested over US$290 M personally and takes a salary of $1 per year, aligning his interests with those of our shareholders. He is a recipient of the Order of Canada, a member of the Canadian Mining Hall of Fame and winner of the EY Entrepreneur of the Year (Energy) award. His goal is to significantly multiply the value of our shareholders’ investments and his own, as he did while building Goldcorp Inc.
CAUTION CONCERNING FORWARD-LOOKING STATEMENTS
This news release contains certain forward-looking statements and information, including "forward-looking statements" within the meaning of the Private Securities Litigation Reform Act of 1995. The forward-looking statements and information expressed are as at the date of this news release, and are McEwen Inc.'s (the "Company") estimates, forecasts, projections, expectations or beliefs as to future events and results. Forward-looking statements and information are necessarily based upon a number of estimates and assumptions that, while considered reasonable by management, are inherently subject to significant business, economic and competitive uncertainties, risks and contingencies, and there can be no assurance that such statements and information will prove to be accurate. Therefore, actual results and future events could differ materially from those anticipated in such statements and information. Risks and uncertainties that could cause results or future events to differ materially from current expectations expressed or implied by the forward-looking statements and information include, but are not limited to, fluctuations in the market price of precious metals, mining industry risks, political, economic, social and security risks associated with foreign operations, the ability of the Company to receive or receive in a timely manner permits or other approvals required in connection with operations, risks associated with the construction of mining operations and commencement of production and the projected costs thereof, risks related to litigation, the state of the capital markets, environmental risks and hazards, uncertainty as to calculation of mineral resources and reserves, foreign exchange volatility, foreign exchange controls, foreign currency risk, and other risks. Readers should not place undue reliance on forward-looking statements or information included herein, which speak only as of the date hereof. The Company undertakes no obligation to reissue or update forward-looking statements or information as a result of new information or events after the date hereof except as may be required by law. See McEwen Inc.'s Annual Report on Form 10-K for the fiscal year ended December 31, 2025, and other filings with the Securities and Exchange Commission, under the caption "Risk Factors", for additional information on risks, uncertainties and other factors relating to the forward-looking statements and information regarding the Company. All forward-looking statements and information made in this news release are qualified by this cautionary statement.
The NYSE and TSX have not reviewed and do not accept responsibility for the adequacy or accuracy of the contents of this news release, which has been prepared by the management of McEwen.
Want News Fast?
Subscribe to our email list:
https://www.mcewenmining.com/contact-us/#section=followUs
and receive news as it happens!!
| WEB SITE | SOCIAL MEDIA | |||||
| www.mcewenmining.com | McEwen | Facebook: | facebook.com/mceweninc | |||
| LinkedIn: | linkedin.com/company/mceweninc | |||||
| CONTACT INFORMATION | X: | X.com/mceweninc | ||||
| Instagram: | instagram.com/mceweninc | |||||
| Suite 2800, PO Box 24 | ||||||
| McEwenCopper | Facebook: | facebook.com/mcewencopper | ||||
| M5H 1J9 | LinkedIn: | linkedin.com/company/mcewencopper | ||||
| X: | X.com/mcewencopper | |||||
| Investor Relations: | Instagram: | instagram.com/mcewencopper | ||||
| (866)-441-0690 - Toll-free | ||||||
| (647)-258-0395 | Facebook: | facebook.com/mcewenrob | ||||
| LinkedIn: | linkedin.com/in/robert-mcewen-646ab24 | |||||
| info@mcewenmining.com | X: | X.com/robmcewenmux | ||||
Figures accompanying this announcement are available at:
https://www.globenewswire.com/NewsRoom/AttachmentNg/63f57da7-f7c3-40f6-bd6c-5a103cbb72de
https://www.globenewswire.com/NewsRoom/AttachmentNg/c352d452-2101-440a-810d-ec72d8ba06ac
https://www.globenewswire.com/NewsRoom/AttachmentNg/111df3b9-1ac7-4745-90b4-8e01d282cd71
https://www.globenewswire.com/NewsRoom/AttachmentNg/05ffc4f8-44e3-4696-9cf4-1e24b2ce288a
https://www.globenewswire.com/NewsRoom/AttachmentNg/f8a55ffe-35b2-4b04-bff8-fcd022945f50
https://www.globenewswire.com/NewsRoom/AttachmentNg/6039ed75-1b34-457e-a453-1eebf5ccfea6
https://www.globenewswire.com/NewsRoom/AttachmentNg/103e2353-4d2e-437f-8bd9-899856b97860
https://www.globenewswire.com/NewsRoom/AttachmentNg/bd5a9b19-0e79-4fb5-980f-dc569d614671


Figure 1. Plan Map for the Grey Fox Deposit
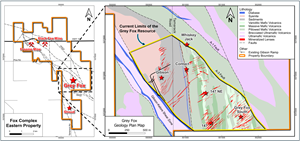
Figure 1. Plan Map for the Grey Fox Deposit
Figure 2. Plan Map for Grey Fox Project Highlighting Q2 Drill Results
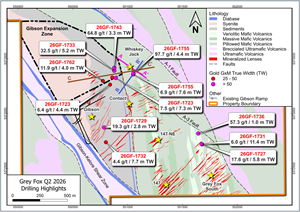
Figure 2. Plan Map for Grey Fox Project Highlighting Q2 Drill Results
Figure 3. Longitudinal Section for the Whiskey Jack Zone at Grey Fox Project
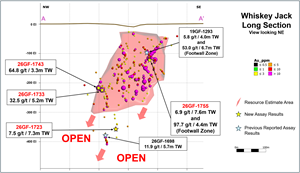
Figure 3. Longitudinal Section for the Whiskey Jack Zone at Grey Fox Project
Figure 4. Cross Section for the Whiskey Jack Zone at Grey Fox Project
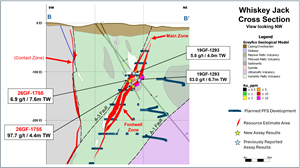
Figure 4. Cross Section for the Whiskey Jack Zone at Grey Fox Project
Figure 5. Cross Section for the Gibson Zone at Grey Fox Project
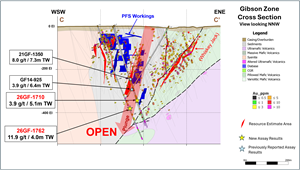
Figure 5. Cross Section for the Gibson Zone at Grey Fox Project
Figure 6. Lookout Mountain and Windfall Exploration Targets and Resources
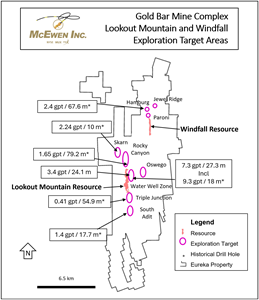
Figure 6. Lookout Mountain and Windfall Exploration Targets and Resources
Figure 7. Long Section of Tartan’s Main Zone – Selected Drill Highlights

Figure 7. Long Section of Tartan’s Main Zone – Selected Drill Highlights
Figure 8. Cross Section of Tartan’s Main Zone – Selected Drill Highlights
