- Reports
$17.3 million in net sales,$2.9 million in gross profit, and 17% gross margin in the first quarter 2026. - Announces operational changes that are expected to generate more than
$3 million in additional gross profit on an annualized basis. - 2026 guidance reflects the Company's emphasis on growth, improved gross margin, and generating positive cash flow.
This press release features multimedia. View the full release here: https://www.businesswire.com/news/home/20260507118333/en/
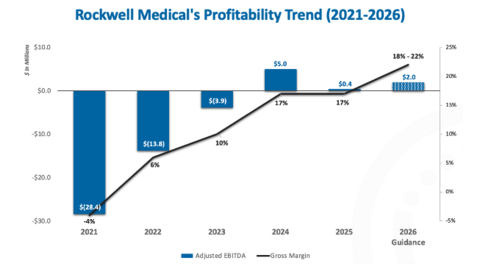
"Our financial and operational performance in the first quarter 2026 builds on the positive trajectory we have established across our key financial metrics, which we expect to continue throughout the remainder of the year," said Mark Strobeck, Ph.D., Rockwell Medical’s President and CEO. "By streamlining our operations, we are on track to generate meaningful cost savings that we believe will support sustained profitability. Our 2026 guidance is centered around strengthening revenue, expanding gross margin, and generating positive Adjusted EBITDA and cash flow."
FIRST QUARTER 2026 FINANCIAL HIGHLIGHTS
- Net sales for the three months ended
March 31, 2026 were$17.3 million , which represents an 8% decrease over net sales of$18.9 million for the same period in 2025. The decrease in net sales was driven by a reduction in purchase volume by one of the Company's customers. - Gross profit for the three months ended
March 31, 2026 was$2.9 million , which was in line with gross profit for the same period in 2025. - Gross margin for the three months ended
March 31, 2026 was 17%, representing a slight improvement over gross margin of 16% for the same period in 2025. - Net loss for the three months ended
March 31, 2026 was$1.6 million , representing a slight increase over a net loss of$1.5 million for the same period in 2025. - Adjusted EBITDA for the three months ended
March 31, 2026 was($0.3) million , an improvement over Adjusted EBITDA of($0.4) million for the same period in 2025. - Cash and cash equivalents and investments available-for-sale at
March 31, 2026 was$23.9 million compared to cash and cash equivalents and investments available-for-sale of$25.0 million atDecember 31, 2025 . The decrease in cash of approximately$1.1 million was driven by seasonal items historically incurred in the first quarter, as well as a$500,000 payment associated with our acquisition of the hemodialysis concentrates business fromEvoqua Water Technologies , which occurred inJuly 2023 . The final Evoqua payment was made inApril 2026 .
| Three Months Ended | ||||||
(In Millions, Except Per Share Amounts) | 2026 |
| 2025(a) | ||||
$ | 17.3 |
|
| $ | 18.9 |
| |
|
|
|
| ||||
Gross Profit |
| 2.9 |
|
|
| 3.0 |
|
|
|
|
| ||||
Operating Income (Loss) |
| (1.5 | ) |
|
| (1.4 | ) |
|
|
|
| ||||
Net Income (Loss) |
| (1.6 | ) |
|
| (1.5 | ) |
|
|
|
| ||||
Adjusted EBITDA(c) |
| (0.3 | ) |
|
| (0.4 | ) |
|
|
|
| ||||
Basic and Diluted Net Loss per Share(b) | $ | (0.04 | ) |
| $ | (0.04 | ) |
Adjusted EPS(c) | $ | (0.01 | ) |
| $ | (0.01 | ) |
(a) | Three months ended |
(b) | See Note 3 for more details related to Basic and Diluted Weighted Average Shares Outstanding on Form 10-Q filed |
(c) | See reconciliation to GAAP financial measures in the tables below. |
2026 GUIDANCE
In 2026,
| 2026 Annual Guidance |
Gross Margin | 18% to 22% |
Adjusted EBITDA | |
Operating Cash Flow | Positive |
WEBCAST DETAILS
Date:
Time:
Webcast and Replay: www.RockwellMed.com/Results
Speakers:
Mark Strobeck , Ph.D. — President and Chief Executive OfficerJesse Neri — SVP, Chief Financial Officer
Format: Discussion of first quarter 2026 financial and operational results followed by Q&A.
NON-GAAP FINANCIAL MEASURES
To supplement Rockwell Medical’s unaudited condensed consolidated statements of operations and unaudited condensed consolidated balance sheets, which are prepared in conformity with generally accepted accounting principles in
Adjusted EBITDA and Adjusted EPS are key measures used by
Adjusted EBITDA and Adjusted EPS should not be considered in isolation of, or as an alternative to, measures prepared in accordance with GAAP. Other companies, including companies in the same industry, may calculate similarly titled non-GAAP financial measures differently or may use other measures to evaluate their performance, all of which could reduce the usefulness of Adjusted EBITDA and Adjusted EPS as tools for comparison. There are a number of limitations related to the use of these non-GAAP financial measures rather than the most directly comparable financial measure calculated in accordance with GAAP. When evaluating the Company’s performance, you should consider Adjusted EBITDA and Adjusted EPS alongside other financial performance measures, including net loss, EPS and other GAAP results.
ABOUT
FORWARD-LOOKING STATEMENTS
Certain statements in this press release may constitute "forward-looking statements" within the meaning of the federal securities laws. Words such as, "may," "might," "will," "should," "believe," "expect," "anticipate," "estimate," "continue," "could," "can," "would," "develop," "plan," "potential," "predict," "forecast," "project," "intend," "look forward to," "remain confident," “remain steadfast,” “guidance,” “working to,” “goal” or the negative of these terms, and similar expressions, or statements regarding intent, belief, or current expectations, are forward looking statements. Such statements include without limitation statements relating to: our financial guidance, including projections regarding net sales, gross margin, Adjusted EBITDA and operating cash flow; and our expectations regarding the outcome of further streamlining and enhancing operational efficiencies and distribution footprint initiatives; the results of anticipated pricing adjustments; and net sales anticipated from onboarding new customers. While
Financial Tables Follow
| CONDENSED CONSOLIDATED BALANCE SHEETS | |||||
| (Dollars In Thousands) | |||||
| |||||
2026 |
| 2025 | |||
| Cash, Cash Equivalents & Investments available-for-sale | $ | 23,890 | $ | 17,331 | |
| Total Assets | $ | 57,423 | $ | 53,961 | |
| Total Liabilities | $ | 21,566 | $ | 22,439 | |
| Total Stockholders’ Equity | $ | 35,857 | $ | 31,522 | |
| Common Stock Outstanding |
| 39,470,299 |
| 34,257,903 | |
| Common stock and common stock equivalents* |
| 49,850,163 |
| 41,902,125 | |
| *Common stock and common stock equivalents: | |||||
| Common stock |
| 39,470,299 |
| 34,257,903 | |
| Options to purchase common stock |
| 3,200,049 |
| 1,884,476 | |
| Restricted stock awards |
| - |
| 891 | |
| Restricted stock units |
| 1,073,330 |
| 383,326 | |
| Preferred stock converted |
| 1,405,001 |
| 1,391,045 | |
| Restricted stock units - Market Condition |
| 717,000 |
| - | |
| Common stock warrants |
| 3,984,484 |
| 3,984,484 | |
| Total common stock and common stock equivalents |
| 49,850,163 |
| 41,902,125 | |
| UNAUDITED CONDENSED CONSOLIDATED STATEMENT OF OPERATIONS | ||||||||
| (In Thousands, Except Shares and Per Share Amounts) | ||||||||
Three Months Ended |
| Three Months Ended | ||||||
$ | 17,336 |
| $ | 18,914 |
| |||
| Cost of Sales |
| 14,439 |
|
| 15,872 |
| ||
| Gross Profit |
| 2,897 |
|
| 3,042 |
| ||
| Selling and Marketing |
| 567 |
|
| 711 |
| ||
| General and Administrative |
| 3,810 |
|
| 3,691 |
| ||
| Operating Income (Loss) |
| (1,480 | ) |
| (1,360 | ) | ||
| Other (Expense) Income | ||||||||
| Realized Gain on Investments |
| 120 |
|
| 56 |
| ||
| Interest Expense |
| (282 | ) |
| (277 | ) | ||
| Interest Income |
| 37 |
|
| 66 |
| ||
| Total Other Expense |
| (125 | ) |
| (155 | ) | ||
| Net Income (Loss) | $ | (1,605 | ) | $ | (1,515 | ) | ||
| Basic and Diluted Net Loss per Share | $ | (0.04 | ) | $ | (0.04 | ) | ||
| Basic and Diluted Weighted Average Shares Outstanding |
| 39,418,302 |
|
| 34,107,640 |
| ||
| Reconciliation to GAAP Financial Measures | ||||||||
| (In Thousands, Except Shares and Per Share Amounts) | ||||||||
Three Months Ended | ||||||||
2026 |
| 2025 | ||||||
| Net Income (Loss) | $ | (1,605 | ) | $ | (1,515 | ) | ||
| Income taxes |
| - |
|
| - |
| ||
| Other Expense, net |
| 125 |
|
| 155 |
| ||
| Depreciation and amortization |
| 508 |
|
| 537 |
| ||
| EBITDA |
| (972 | ) |
| (823 | ) | ||
| Severance costs |
| 21 |
|
| 48 |
| ||
| Stock-based compensation |
| 480 |
|
| 445 |
| ||
| Facility transition |
| 178 |
|
| 39 |
| ||
| Deferred license revenue |
| - |
|
| (325 | ) | ||
| Triferic inventory write-off |
| - |
|
| 178 |
| ||
| Adjusted EBITDA | $ | (294 | ) | $ | (439 | ) | ||
| Adjusted EPS | $ | (0.01 | ) | $ | (0.01 | ) | ||
| Basic Weighted Average Shares Outstanding |
| 39,418,302 |
|
| 34,107,640 |
| ||
View source version on businesswire.com: https://www.businesswire.com/news/home/20260507118333/en/
(248) 432-1362
IR@RockwellMed.com
Source: