- Shareholder Distributions Totaled
$5.6 Million , Including$1.6 Million of Dividends and$4.0 Million of Share Repurchases - Tight Operating and Financial Controls in Place
- Current Ratio Remains Healthy at 3.1
- Early Order Rates Underscore Normalization of School Furniture Market
For the fourth quarter alone, total revenue was
For the full fiscal year ended
The market dislocations of the COVID-era school closures and supply chain disruptions remain difficult to assess. Management attempted during the middle of that cycle to disentangle some of the backlog buildup that appeared to be growth but was in fact deferred demand and shipments. Even now, three years after the event, those factors remain difficult to isolate.
Nonetheless, because Management believed those forces and their consequences were extraordinary, it adopted a conservative approach to capital management, assuming that few of the observable trends, other than its proven expansion of field service capabilities along with rapid prototyping and product development, were of durable market advantage. This perspective derives from the Company’s 76-year history of serving the school furniture market. As more schools seek
Financially and operationally, the Company now finds itself in a position to capitalize on the nascent market recovery. Even modest growth in revenue may deliver favorable impact to cash flows and operating income, allowing the Company to expand its market-leading reputation for on-time delivery and superior, made-in-USA quality. Management also looks forward to continuing its recent practice of balanced cash returns to shareholders.
As of the date of this report, the Company’s preferred metric for production planning and staffing—“Shipments plus Backlog”—is approximately 3% lower than last year. This two-part metric combines actual year-to-date shipments plus backlog, most of which is expected to ship in the current fiscal year. However, as of this date, incoming orders rates are running ahead of the prior year by low double digits. Should these more normalized order rates continue, they may eventually translate to an improved metric of shipments plus backlog. Given that the market for school furniture is still struggling to re-establish equilibrium following dislocations of the pandemic, Management reiterates its traditional warning that investors should not treat these various metrics as “guidance,” or forecasts.
Interestingly, there also appears to be a renewed focus on vocational and technical training as well as traditional education. This is, perhaps, a response to anticipated impacts on the job market by artificial intelligence, as well as ongoing efforts to address the negative impacts of school closures during the pandemic. These trends are evident both in the product mix of incoming orders as well as discussions with educators who are planning new projects and renovations.
Looking back on what was clearly a challenging year for the Company, Chairman and CEO
"Our core market is large, with over 60 million end users, and geographically and economically diverse, reflecting the ground-level uniqueness of tens of thousands of local communities across
"If last year was a practical stress test of this structure, we are reasonably satisfied with the outcome. We obviously look forward to improved results as school functions across the country return to more normal levels, like the order rates we’re seeing now. Further, we look forward to using our strong position as a platform to develop additional business with similar characteristics to school furniture.”
About
Founded in 1950,
Contact:
(310) 533-0474
Non-GAAP Financial Information
This press release includes a statement regarding shipments plus backlog as of
Statement Concerning Forward-Looking Information
This news release contains “forward-looking statements” as defined by the Private Securities Litigation Reform Act of 1995. These statements include, but are not limited to, statements regarding: our future financial results and growth in our business; our business strategies; market demand and product development; estimates of backlog; order rates and trends in seasonality; product relevance; economic conditions and patterns; the educational furniture industry generally, including the domestic market for classroom furniture; cost control initiatives; absorption rates; and supply chain challenges. Forward-looking statements are based on current expectations and beliefs about future events or circumstances, and you should not place undue reliance on these statements. Such statements involve known and unknown risks, uncertainties, assumptions and other factors, many of which are out of our control and difficult to forecast. These factors may cause actual results to differ materially from those that are anticipated. Such factors include, but are not limited to: the impacts of tariffs and global trade uncertainties; changes in general economic conditions including raw material, energy and freight costs; state and municipal bond funding; state, local, and municipal tax receipts; order rates; the seasonality of our markets; the markets for school and office furniture generally, the specific markets and customers with which we conduct our principal business; the impact of cost-saving initiatives on our business; the competitive landscape, including responses of our competitors and customers to changes in our prices; changes in demographics; and the terms and conditions of available funding sources. See our Annual Report on Form 10-K for the year ended
Financial Tables Follow
Consolidated Balance Sheets
| | |||||
| 2026 | 2025 | ||||
| (In thousands) | |||||
| Assets | |||||
| Current assets | |||||
| Cash | $ | 14,437 | $ | 26,867 | |
| Trade accounts receivables (net of allowance of | 13,590 | 13,004 | |||
| Income tax receivable | 3,863 | 4,060 | |||
| Inventories | 56,735 | 55,647 | |||
| Prepaid expenses and other current assets | 10,104 | 2,595 | |||
| Total current assets | 98,729 | 102,173 | |||
| Property, plant and equipment, net | 34,578 | 36,428 | |||
| Operating lease right-of-use assets | 30,415 | 35,593 | |||
| Deferred income tax assets, net | 5,437 | 5,821 | |||
| Other assets | 5,020 | 11,931 | |||
| Total assets | $ | 174,179 | $ | 191,946 | |
Consolidated Balance Sheets
| 2026 | 2025 | ||||||
| (In thousands, except share and par value data) | |||||||
| Liabilities | |||||||
| Current liabilities | |||||||
| Accounts payable | $ | 7,393 | $ | 11,593 | |||
| Accrued compensation and employee benefits | 11,434 | 11,064 | |||||
| Current portion of long-term debt | 269 | 258 | |||||
| Current portion of operating lease liability | 6,490 | 1,673 | |||||
| Other accrued liabilities | 6,396 | 9,687 | |||||
| Total current liabilities | 31,982 | 34,275 | |||||
| Non-current liabilities | |||||||
| Accrued self-insurance retention | 730 | 780 | |||||
| Accrued pension expenses | 839 | 6,746 | |||||
| Income tax payable, less current portion | 227 | 200 | |||||
| Long-term debt, less current portion | 3,609 | 3,878 | |||||
| Operating lease liability, less current portion | 30,006 | 36,007 | |||||
| Other long-term liabilities | 855 | 795 | |||||
| Total non-current liabilities | 36,266 | 48,406 | |||||
| Commitments and contingencies | |||||||
| Stockholders’ equity | |||||||
| Preferred stock: | |||||||
| Authorized 3,000,000 shares, | — | — | |||||
| Common stock: | |||||||
| Authorized 25,000,000 shares, | 157 | 161 | |||||
| Additional paid-in capital | 113,761 | 117,549 | |||||
| Accumulated deficit | (7,875 | ) | (8,867 | ) | |||
| Accumulated other comprehensive (loss) income | (112 | ) | 422 | ||||
| Total stockholders’ equity | 105,931 | 109,265 | |||||
| Total liabilities and stockholders’ equity | $ | 174,179 | $ | 191,946 | |||
Consolidated Statements of Income
| Years ended | |||||||
| 2026 | 2025 | ||||||
| (In thousands, except per share data) | |||||||
| Net sales | $ | 199,652 | $ | 266,240 | |||
| Costs of goods sold | 118,413 | 151,546 | |||||
| Gross profit | 81,239 | 114,694 | |||||
| Selling, general and administrative expenses | 77,580 | 86,835 | |||||
| Operating income | 3,659 | 27,859 | |||||
| Unrealized gain on investment in trust account | (239 | ) | (1,365 | ) | |||
| Pension expense | 135 | 451 | |||||
| Interest expense, net | 300 | 349 | |||||
| Income before income taxes | 3,463 | 28,424 | |||||
| Income tax expense | 895 | 6,780 | |||||
| Net income | $ | 2,568 | $ | 21,644 | |||
| Cash dividends declared per common share: | $ | 0.10 | $ | 0.09 | |||
| Net income per common share: | |||||||
| Basic | $ | 0.16 | $ | 1.32 | |||
| Diluted | $ | 0.16 | $ | 1.32 | |||
| Weighted average shares outstanding: | |||||||
| Basic | 15,761 | 16,365 | |||||
| Diluted | 15,771 | 16,372 | |||||
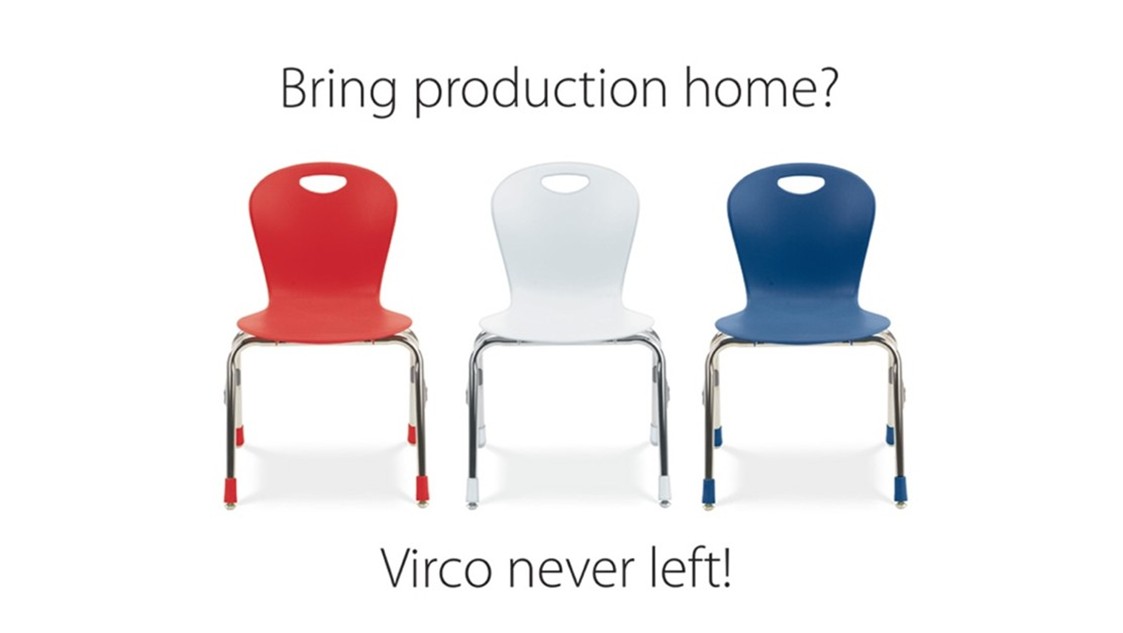
A photo accompanying this announcement is available at https://www.globenewswire.com/NewsRoom/AttachmentNg/6e6b6388-5088-4f77-a6f5-71c3171530fb


Bring production home?
