- Operating Income of
$10.5 Million for Second Quarter Remains Above Long-Term Average - Shipments Plus Backlog of
$162.5 Million is 2.1% Lower Than Same Period Last Year - Current Ratio of 2.5
Supports Aggressive Development of Existing and New Revenue Streams Revenue Quality Remains High , With YTD Gross Margin of 40.4%- Board Declares Quarterly Dividend of
$0.025 per Share, PayableOctober 9, 2026 to Shareholders of Record as ofSeptember 18, 2026
Through six months, net sales totaled
The Company’s domestically-based fabrication and service model continues to deliver good control over cost of goods sold and inventory levels, excellence of delivery and customer service, and of course product quality. In addition, the flexibility provided by
Net income for the three months ended
As global supply chains continue to rebalance, the impact on the Company’s core market of school furniture and equipment remains fluid. Business development efforts in adjacent markets with similar products, processes, and distribution channels are beginning to show consistent data suggesting that domestic manufacturers like
Supply chain relationships tend to be “sticky” and Management anticipates that any rebalancing in Virco’s favor may take several years. However, initial responses to these efforts are encouraging enough to justify further investment in new products and “platform processes”, Management’s term for major operating systems like tube mills, panel processing, injection molding, and metal finishing. Management expects any new investments to fall comfortably within the Company’s typical
Commenting on the first half of the year,
“None of this would be possible without our highly experienced workforce, 40% of whom have been with
“We look forward to sharing our capabilities with public and private schools and many other customers and organizations who may now be in a position to fully appreciate what
On
About Virco Mfg. Corporation
Founded in 1950, Virco Mfg. Corporation is the largest manufacturer and supplier of moveable educational furniture and equipment for the preschool through 12th grade market in the United States. The Company manufactures a wide assortment of products, including mobile tables, mobile storage equipment, desks, computer furniture, chairs, activity tables, folding chairs and folding tables. Along with serving customers in the education market - which in addition to preschool through 12th grade public and private schools includes: junior and community colleges; four-year colleges and universities; trade, technical and vocational schools - Virco is a furniture and equipment supplier for convention centers and arenas; the hospitality industry with respect to banquet and meeting facilities; government facilities at the federal, state, county and municipal levels; and places of worship. The Company also sells to wholesalers, distributors, traditional retailers and catalog retailers that serve these same markets. With operations entirely based in the United States, Virco designs, manufactures, and ships its furniture and equipment from one facility in Torrance, CA and three facilities in Conway, AR. More information on the Company can be found at www.virco.com.
Contact:
Virco Mfg. Corporation
(310) 533-0474
Robert A. Virtue, Chairman and Chief Executive Officer
Doug Virtue, President
Bassey Yau, Chief Financial Officer
Statement Concerning Forward-Looking Information
This news release contains “forward-looking statements” as defined by the Private Securities Litigation Reform Act of 1995. These statements include, but are not limited to, statements regarding: our future financial results and growth in our business; our business strategies; market demand and product development; estimates of backlog; order rates and trends in seasonality; product relevance; economic conditions and patterns; the educational furniture industry generally, including the domestic market for classroom furniture; cost control initiatives; absorption rates; and supply chain challenges. Forward-looking statements are based on current expectations and beliefs about future events or circumstances, and you should not place undue reliance on these statements. Such statements involve known and unknown risks, uncertainties, assumptions and other factors, many of which are out of our control and difficult to forecast. These factors may cause actual results to differ materially from those that are anticipated. Such factors include, but are not limited to: the impacts of tariffs and global trade uncertainties; changes in general economic conditions including raw material, energy and freight costs; state and municipal bond funding; state, local, and municipal tax receipts; order rates; the seasonality of our markets; the markets for school and office furniture generally, the specific markets and customers with which we conduct our principal business; the impact of cost-saving initiatives on our business; the competitive landscape, including responses of our competitors and customers to changes in our prices; changes in demographics; and the terms and conditions of available funding sources. See our Annual Report on Form 10-K for the year ended January 31, 2026, our Quarterly Reports on Form 10-Q, and other reports and material that we file with the Securities and Exchange Commission for a further description of these and other risks and uncertainties applicable to our business. We assume no, and hereby disclaim any, obligation to update any of our forward-looking statements. We nonetheless reserve the right to make such updates from time to time by press release, periodic reports, or other methods of public disclosure without the need for specific reference to this press release. No such update shall be deemed to indicate that other statements which are not addressed by such an update remain correct or create an obligation to provide any other updates.
Financial Tables Follow
Unaudited Condensed Consolidated Balance Sheets | ||||||||||
| (In thousands) | ||||||||||
| Assets | ||||||||||
| Current assets | ||||||||||
| Cash | $ | 9,212 | $ | 14,437 | $ | 2,610 | ||||
| Trade accounts receivable, net | 45,560 | 13,590 | 46,817 | |||||||
| Income tax receivable | 4,237 | 3,863 | — | |||||||
| Inventories | 53,032 | 56,735 | 59,866 | |||||||
| Prepaid expenses and other current assets | 10,568 | 10,104 | 2,592 | |||||||
| Total current assets | 122,609 | 98,729 | 111,885 | |||||||
| Non-current assets | ||||||||||
| Property, plant and equipment, net | 33,396 | 34,578 | 36,120 | |||||||
| Operating lease right-of-use assets | 27,396 | 30,415 | 33,019 | |||||||
| Deferred income tax assets, net | 3,594 | 5,437 | 5,847 | |||||||
| Other assets, net | 5,171 | 5,020 | 11,770 | |||||||
| Total assets | $ | 192,166 | $ | 174,179 | $ | 198,641 | ||||
| Liabilities | ||||||||||
| Current liabilities | ||||||||||
| Accounts payable | $ | 20,034 | $ | 7,393 | $ | 17,069 | ||||
| Accrued compensation and employee benefits | 12,850 | 11,434 | 6,856 | |||||||
| Income tax payable | — | — | 14 | |||||||
| Current portion of long-term debt | 274 | 269 | 263 | |||||||
| Current portion of operating lease liability | 6,623 | 6,490 | 4,790 | |||||||
| Other accrued liabilities | 8,714 | 6,396 | 8,747 | |||||||
| Total current liabilities | 48,495 | 31,982 | 37,739 | |||||||
| Non-current liabilities | ||||||||||
| Long-term debt, less current portion | 3,471 | 3,609 | 3,745 | |||||||
| Operating lease liability, less current portion | 26,672 | 30,006 | 33,096 | |||||||
| Other long-term liabilities | 3,054 | 2,651 | 8,685 | |||||||
| Total non-current liabilities | 33,197 | 36,266 | 45,526 | |||||||
| Commitments and contingencies (Note 13) | ||||||||||
| Stockholders’ equity | ||||||||||
| Preferred stock: | ||||||||||
| Authorized 3,000,000 shares, | — | — | — | |||||||
| Common stock: | ||||||||||
| Authorized 25,000,000 shares, 15,763,815 shares at 7/31/2026, 15,761,141 shares at 1/31/2026, and 15,761,141 shares at | 157 | 157 | 157 | |||||||
| Additional paid-in capital | 113,669 | 113,761 | 113,667 | |||||||
| (Accumulated deficit) retained earnings | (2,827 | ) | (7,875 | ) | 1,264 | |||||
| Accumulated other comprehensive (loss) income | (525 | ) | (112 | ) | 288 | |||||
| Total stockholders’ equity | 110,474 | 105,931 | 115,376 | |||||||
| Total liabilities and stockholders’ equity | $ | 192,166 | $ | 174,179 | $ | 198,641 | ||||
Unaudited Condensed Consolidated Statements of Income
| Three Months Ended | Six Months Ended | |||||||||||||
| (In thousands, except per share data) | ||||||||||||||
| Net sales | $ | 87,466 | $ | 92,086 | $ | 118,158 | $ | 125,840 | ||||||
| Cost of goods sold | 52,453 | 51,212 | 70,450 | 68,946 | ||||||||||
| Gross profit | 35,013 | 40,874 | 47,708 | 56,894 | ||||||||||
| Selling, general and administrative expenses | 24,466 | 25,503 | 40,821 | 41,617 | ||||||||||
| Operating income | 10,547 | 15,371 | 6,887 | 15,277 | ||||||||||
| Unrealized (gain) loss on investment in trust account | (656 | ) | 968 | (529 | ) | (207 | ) | |||||||
| Pension (benefit) expense | (203 | ) | 27 | (392 | ) | 54 | ||||||||
| Interest expense, net | 170 | 205 | 276 | 265 | ||||||||||
| Income before income taxes | 11,236 | 14,171 | 7,532 | 15,165 | ||||||||||
| Income tax expense | 2,623 | 3,985 | 1,696 | 4,247 | ||||||||||
| Net income | $ | 8,613 | $ | 10,186 | $ | 5,836 | $ | 10,918 | ||||||
| Cash dividends declared per common share: | $ | 0.025 | $ | 0.025 | $ | 0.050 | $ | 0.050 | ||||||
| Net income per common share: | ||||||||||||||
| Basic | $ | 0.55 | $ | 0.65 | $ | 0.37 | $ | 0.69 | ||||||
| Diluted | $ | 0.55 | $ | 0.65 | $ | 0.37 | $ | 0.69 | ||||||
| Weighted average shares of common stock outstanding: | ||||||||||||||
| Basic | 15,734 | 15,741 | 15,733 | 15,749 | ||||||||||
| Diluted | 15,737 | 15,743 | 15,735 | 15,750 | ||||||||||
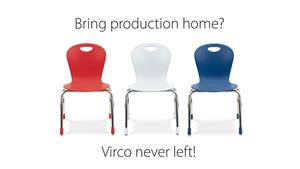
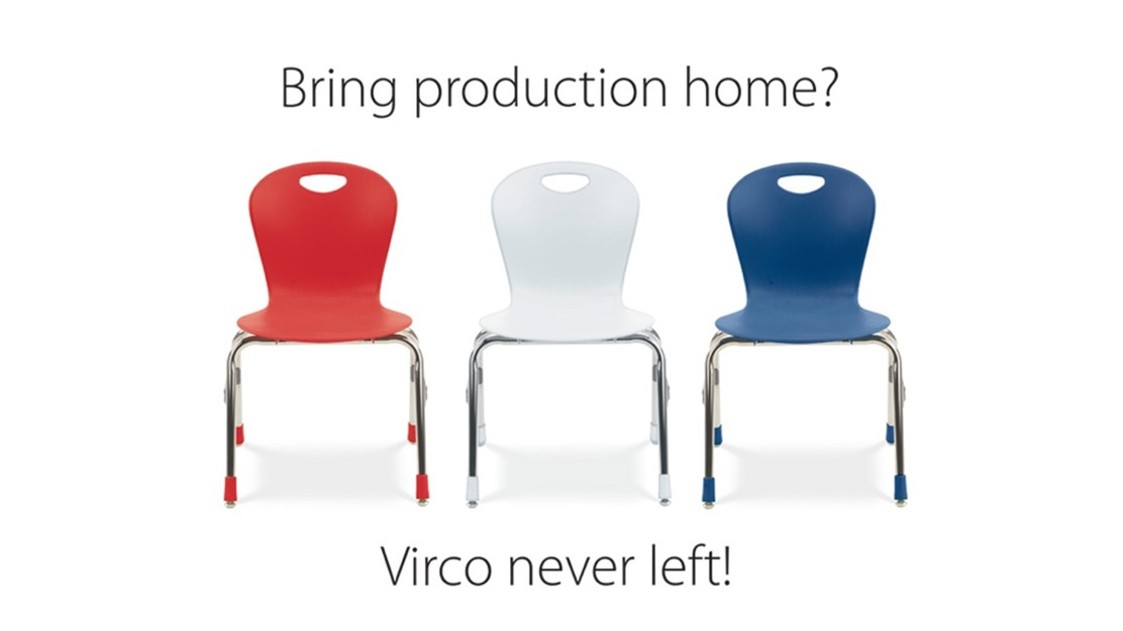
A photo accompanying this announcement is available at https://www.globenewswire.com/NewsRoom/AttachmentNg/937177b1-765d-4e40-b0c5-048296f11f14.


Bring production home?