Full Year
- Total revenue of
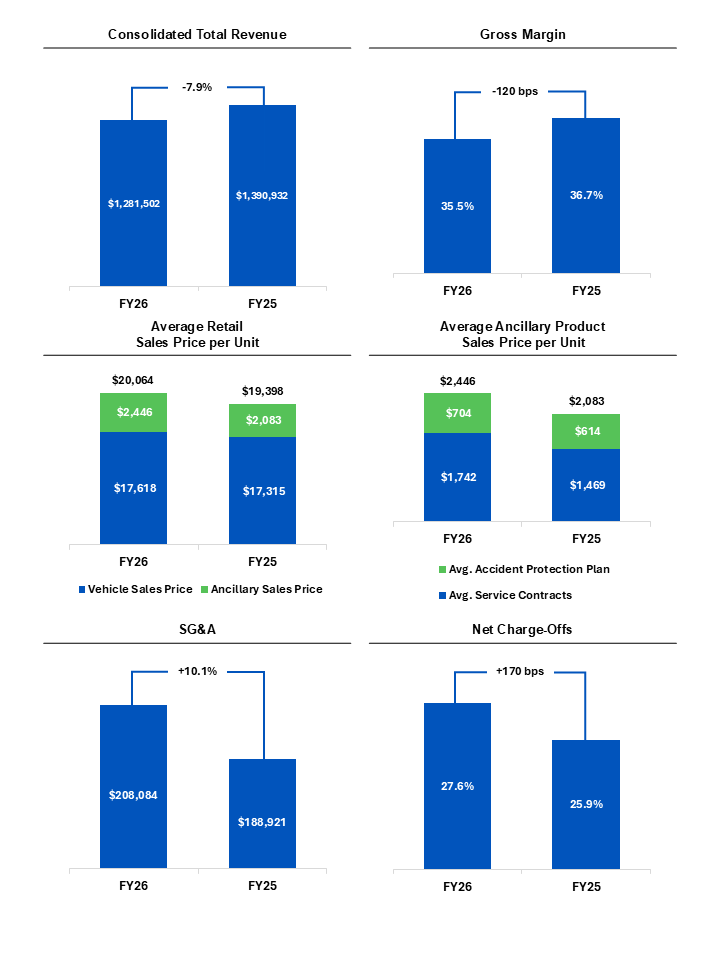
$1,281.5 million , down 7.9%; interest income increased 3.7% to$253.7 million - Sales volumes declined 14.3% to 48,891 units, reflecting reductions in both the active dealership base and inventory purchases, partially offset by a 3.4% increase in the average retail sales price
- Gross profit per unit improved 1.0% to
$7,442 ; gross margin percentage of 35.4% vs. 36.7% - Total collections of
$730.0 million , up 2.2% year-over-year - Net charge-offs as a percentage of average finance receivables were 27.6% vs. 25.9%
- SG&A of
$208.1 million ; includes$4.0 million in non-recurring restructuring-related charges; adjusted SG&A[¹] of$204.1 million , or 19.9% of sales - Non-cash impairment of
$11.0 million related to the dealership consolidations, reported on a separate line from SG&A - Loss per share of
$16.79 and adjusted loss per share[1] of$3.71
[1] Calculation of this non-GAAP financial measure and a reconciliation to the most directly comparable GAAP measure are included in the tables accompanying this release.
President and CEO
Our fourth quarter results reflect the actions we took to preserve liquidity, reduce risk, and operate within our capital structure — and you can see that in our financial performance. The year did not meet our expectations, but this is a liquidity and capital-structure story, not a credit-quality one.
On credit, our charge-off ratio ticked up to 7.5% in the fourth quarter, from 6.9% a year ago. Part of that is simply a smaller book — with fewer new loans, our finance receivables are about 6.4% smaller than a year ago, and a smaller balance raises the percentage. The rest reflects our customers paying more at the pump for much of the year, along with some disruption from our dealership consolidations — and we're watching both closely. Underlying credit behavior has been relatively stable, even against those pressures.
With respect to our dealership consolidations, the customer accounts from our closed stores moved to stronger nearby locations, or to a centralized collections team we built for the first time earlier this year — a way to serve accounts where the nearest store was no longer a practical fit. That was the right call for the business. It was also a hard one for the associates affected, and I don't want that to get lost in the numbers. We've worked to handle it the right way, with severance pay and assistance in helping those associates find their next role.
On
To our customers: our job every day is still to keep you on the road, and that continues without interruption. To our vendors and associates: I know there are a lot of questions right now, and I'm not going to pretend otherwise. It takes what it takes to work through this the right way, and that's where our focus is. To our shareholders: I know this has been a difficult and uncertain period, and you have every right to expect us to work through it with urgency and discipline. That is exactly what this team and this Board are doing. Thank you for staying with us through a hard year. We do not take it for granted.
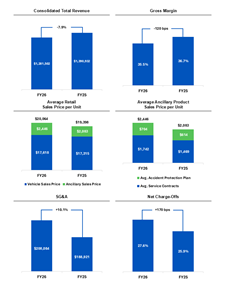
| Fiscal year 2026 Key Operating Metrics |
Dollars in thousands, except per share data. Dollar and percentage changes may not recalculate due to rounding. Charts may not be to scale.
| Fourth Quarter Business Review |
Note: Discussions in each section provide information for the fourth quarter of fiscal year 2026, compared to the fourth quarter of fiscal year 2025, unless otherwise noted.
SALES VOLUME – Retail units sold decreased 27.1% to 11,411 units when compared to the prior year's quarter. These results were driven primarily by lower inventory levels — the result of the reduced availability of origination capital and reduced inventory purchases to preserve capital — and, to a lesser extent, the earlier store consolidations completed in the third quarter.
Sales volumes during the quarter are not indicative of underlying consumer demand. Lead indicators for demand remained robust throughout the quarter.
TOTAL REVENUE – Total revenue for the quarter was
GROSS PROFIT – Gross profit margin as a percentage of sales was 31.2%, compared to 36.4% in the prior year quarter. Total gross profit per retail unit sold decreased by 8.1% to
SG&A EXPENSE – SG&A expenses totaled
The Company continued to make progress on its footprint optimization initiative. During the quarter, the Company consolidated 42 dealership locations into nearby, higher-performing dealerships, and consolidated some customer accounts into a centralized collections team. Including the Company's Q3 reductions in footprint, this reduced the Company's active dealership count from 154 at
IMPAIRMENT – The Company recognized
CREDIT AND UNDERWRITING PERFORMANCE – Net charge-offs as a percentage of average finance receivables were 7.5%, compared to 6.9% in the prior year quarter. The increase in the ratio partly reflects the contraction in the receivables base — the principal balance of finance receivables declined 6.4% compared to the prior year quarter as management moderated originations due to liquidity constraints. Adjusting for that smaller base, net charge-offs would have been lower, with only a modest increase related to continued fuel and cost-of-living pressure on the Company’s customers, and not to any change in underwriting standards.
Total collections were
Accounts over 30 days past due were 4.1% at year-end, up from 3.4% a year ago but down sequentially from 4.4% at
Car-Mart's disciplined underwriting approach continues to strengthen its receivables portfolio, with the highest credit-tier customers now representing 66.6% of accounts receivable, up from 64.6% in the prior year quarter.
ALLOWANCE FOR CREDIT LOSSES – The allowance for credit losses was
The year-over-year increase primarily reflects the broader macroeconomic environment, rather than a change in underlying credit behavior, and the reduction in finance receivable originations undertaken to preserve liquidity. These effects were partially offset by portfolio mix shifts, including the growing share of receivables originated under our loan origination system (LOS) and those added through dealership locations acquired during fiscal year 2025. The modest sequential decline from
LEVERAGE & LIQUIDITY – Total debt declined to
Total cash, including restricted cash, increased to
CAPITAL STRUCTURE – On
The Company’s work ahead is focused on translating asset value into a sustainable funding restructure, either through a warehouse facility, a recapitalization, or another financing transaction, and the amendment gives the Company the time to pursue that in an orderly and thoughtful manner. Securing an additional readily available financing source, such as a revolving warehouse facility or other potential debt facility, remains the critical next step in restoring origination capacity and would provide bridge financing between origination and securitization that allows the Company to fully serve customer demand and restore sales volume. The Company cannot assure, however, that it will be able to secure any such financing on acceptable terms, or at all, or that the review of strategic and financing alternatives will result in any transaction or other outcome favorable to the Company or its stockholders.
GOING CONCERN – In accordance with ASC 205-40, the Company's substantial indebtedness, its liquidity position, and the uncertainties associated with satisfying the milestones under the amendment to its Credit and Guaranty Agreement and securing additional financing raise substantial doubt about its ability to continue as a going concern within one year after the consolidated financial statements are issued. Management's plans to address these conditions have not been fully implemented and do not alleviate that doubt. The financial statements have been prepared on a going-concern basis and include no related adjustments. See Note B (Liquidity and Going Concern) in the Company's Form 10-K.
INTEREST EXPENSE – Interest expense for the quarter was
INCOME TAXES – In fiscal 2026, the Company recorded an income tax provision of
1The calculation of this non-GAAP financial measure and a reconciliation to the most directly comparable GAAP measure are included in the tables accompanying this release.
| Key Operating Results | |||||||||||||
| Three Months Ended | |||||||||||||
| 2026 | 2025 | Change | |||||||||||
| Operating Data: | |||||||||||||
| Retail units sold | 11,411 | 15,649 | (27.1 | ) | % | ||||||||
| Average number of dealerships in operation | 128 | 154 | (16.9 | ) | % | ||||||||
| Average retail units sold per dealerships per month | 29.7 | 33.9 | (12.4 | ) | % | ||||||||
| Average retail sales price | $ | 20,138 | $ | 19,049 | 5.7 | % | |||||||
| Total gross profit per retail unit sold | $ | 6,627 | $ | 7,209 | (8.1 | ) | % | ||||||
| Total gross profit percentage | 31.2 | % | 36.4 | % | (520 | ) | bps | ||||||
| Same dealership revenue growth | (6.1 | ) | % | (3.9 | ) | % | |||||||
| Net charge-offs as a percent of average finance receivables | 7.5 | % | 6.9 | % | 60 | bps | |||||||
| Total collected (principal, interest and late fees), in thousands | $ | 185,710 | $ | 191,114 | (2.8 | ) | % | ||||||
| Average total collected per active customer per month | $ | 617 | $ | 612 | 0.8 | % | |||||||
| Average percentage of finance receivables-current (excl. 1-2 day) | 73.2 | % | 80.2 | % | (700 | ) | bps | ||||||
| Average down-payment percentage | 6.1 | % | 6.2 | % | (10 | ) | bps | ||||||
| Twelve Months Ended | |||||||||||||
| 2026 | 2025 | Change | |||||||||||
| Operating Data: | |||||||||||||
| Retail units sold | 48,891 | 57,022 | (14.3 | ) | % | ||||||||
| Average number of dealerships in operation | 146 | 154 | (5.2 | ) | % | ||||||||
| Average retail units sold per dealerships per month | 27.9 | 30.9 | (9.7 | ) | % | ||||||||
| Average retail sales price | $ | 20,064 | $ | 19,398 | 3.4 | % | |||||||
| Total gross profit per retail unit sold | $ | 7,442 | $ | 7,368 | 1.0 | % | |||||||
| Total gross profit percentage | 35.4 | % | 36.7 | % | (130 | ) | bps | ||||||
| Same dealership revenue growth | (2.2 | ) | % | (5.0 | ) | % | |||||||
| Net charge-offs as a percent of average finance receivables | 27.6 | % | 25.9 | % | 170 | bps | |||||||
| Total collected (principal, interest and late fees), in thousands | $ | 730,048 | $ | 714,102 | 2.2 | % | |||||||
| Average total collected per active customer per month | $ | 591 | $ | 575 | 2.7 | % | |||||||
| Average percentage of finance receivables-current (excl. 1-2 day) | 76.3 | % | 81.4 | % | (510 | ) | bps | ||||||
| Average down-payment percentage | 5.1 | % | 5.5 | % | (40 | ) | bps | ||||||
| Period End Data: | |||||||||||||
| Dealerships open | 94 | 154 | (39.0 | ) | % | ||||||||
| Accounts over 30 days past due | 4.1 | % | 3.4 | % | |||||||||
| Active customer count | 97,696 | 104,682 | (6.7 | ) | |||||||||
| Principal balance of finance receivables (in thousands) | $ | 1,413,059 | $ | 1,509,154 | (6.4 | ) | |||||||
| Weighted average total contract term | 49.0 | 48.3 | 1.4 | ||||||||||
| Conference Call and Webcast |
The Company will hold a conference call to discuss its quarterly results on
| About |
America’s
| Non-GAAP Financial Measures |
This news release contains financial information determined by methods other than in accordance with generally accepted accounting principles (GAAP). Specifically, we present as non-GAAP financial measures in this news release adjusted SG&A as a percentage of sales; adjusted earnings (loss) per share; total debt, net of total cash; and the ratio of debt, net of cash, to finance receivables. These non-GAAP measures are provided as supplemental measures to evaluate operating performance, cost structure, and leverage, and portfolio economics and to facilitate period-to-period comparisons that may be impacted by non-recurring or non-cash items. We believe investors benefit from referring to these non-GAAP measures and ratios in assessing our leverage, balance sheet risk, operating results and related trends, and when planning and forecasting future periods.
These measures should not be considered in isolation or as substitutes for reported GAAP results, as they may include or exclude certain items relative to similar GAAP-based measures and may not be comparable to similarly titled measures reported by other companies. We strongly encourage investors to review our consolidated financial statements included in our publicly filed reports in their entirety and not rely solely on any one financial measure or communication. The most directly comparable GAAP financial measures, as well as reconciliations to those measures, are presented in the tables accompanying this release.
| Forward-Looking Statements |
This news release contains “forward-looking statements” within the meaning of the Private Securities Litigation Reform Act of 1995. These forward-looking statements address the Company’s future events, objectives, plans and goals, as well as the Company’s intent, beliefs and current expectations and projections regarding future financial and operating performance and can generally be identified by words such as “may,” “will,” “should,” “could,” “expect,” “anticipate,” “intend,” “plan,” “project,” “foresee,” and other similar words or phrases. Specific events addressed by these forward-looking statements may include, but are not limited to:
- the Company's ability to continue as a going concern;
- the Company's review of strategic and financing alternatives and the potential outcomes of that review;
- the covenant relief and waivers under, and the Company's ability to satisfy the milestones and other conditions of, the
June 19, 2026 amendment to the Company’s Credit and Guaranty Agreement; - the Company's liquidity and its efforts to preserve liquidity, including the curtailment of inventory purchases and finance receivable originations;
- future earnings performance;
- the availability of capital, including through income from operations and securing additional financing to sustain and supplement operating cash flows through additional securitization transactions, warehouse credit facilities, or other sources, and the Company's ability to consummate such financing transactions;
- the benefits of recent or future changes to the Company’s capital structure;
- operational infrastructure investments;
- technological investments and initiatives;
- the impact of cost reduction and dealership footprint optimization initiatives on operating performance and customer service levels;
- the Company's ability to execute its business plan; and
- the Company’s business, operating and growth strategies and expectations.
These forward-looking statements are based on the Company’s current estimates and assumptions and involve various risks and uncertainties. As a result, you are cautioned that these forward-looking statements are not guarantees of future performance, and that actual results and events could differ materially from those projected in these forward-looking statements. Factors that may cause actual results or events to differ materially from the Company’s projections include, but are not limited to:
- the existence of substantial doubt about the Company's ability to continue as a going concern, and the effects of that disclosure on the Company's relationships with customers, associates, suppliers, lenders and other stakeholders;
- the Company's ability to satisfy the milestones and other conditions of the
June 19, 2026 amendment to its Credit and Guaranty Agreement, to extend the related covenant relief and waiver period, and to obtain further waivers, covenant relief, forbearance or financing from its lenders on acceptable terms, or at all; - the outcome of the Company's review of strategic and financing alternatives, including the risk that the review does not result in any transaction, results in a transaction on unfavorable terms, or is not completed in a timely manner, and the costs, timing and uncertainties associated with the review and related advisory engagements;
- the Company's substantial level of indebtedness and its ability to service that indebtedness, and the risk that its indebtedness could be accelerated (including under cross-default or cross-acceleration provisions) and that the Company would not have sufficient liquidity to repay it;
- the Company's ability to fund finance receivable originations, vehicle inventory purchases, debt service and operating expenses, including its ability to establish a warehouse credit facility and to continue to complete asset-backed securitization transactions;
- the curtailment of the Company's vehicle inventory purchases and finance receivable originations and the effect of that curtailment on the Company's sales, revenues and collections;
- the Company's changes to customer collection practices, including the transition to a centralized collections model and the transfer of customer accounts to dealerships located farther from customers' prior collection locations and the effect of the change on collections, revenues, and customer relationships;
- the potential need for the Company to seek protection under applicable bankruptcy or insolvency laws;
- the possibility that holders of the Company's common stock could experience a significant or complete loss of their investment, including as a result of any restructuring, recapitalization, or dilutive issuance of equity or equity-linked securities;
- the Company's ability to maintain compliance with the continued listing requirements of, and the continued listing of its common stock on, the
Nasdaq Stock Market ; - the diversion of management's attention from ordinary-course operations as a result of the strategic review and the Company's liquidity and capital-structure matters;
- general economic conditions in the markets in which the Company operates, including but not limited to fluctuations in gas prices, grocery prices and employment levels and inflationary pressure on operating costs;
- the availability of quality used vehicles at prices that will be affordable to the Company’s customers, including the impacts of changes in new vehicle production and sales;
- the availability of and access to capital through warehouse credit facilities, securitization financings or other debt or equity financing on terms acceptable to the Company, and any increase in the cost of capital, to support the Company’s business;
- the Company’s ability to consummate debt or equity financing transactions on terms acceptable to the Company;
- the Company’s compliance with financial covenants and other terms of its senior secured term loan, non-recourse notes payable, and any future debt facilities;
- the Company’s ability to underwrite and collect its contracts effectively, including whether anticipated benefits from the Company’s recently implemented loan origination system are achieved as expected or at all;
- competition;
- dependence on existing management;
- ability to attract, develop, and retain qualified general managers;
- changes in consumer finance laws or regulations, including but not limited to rules and regulations that have recently been enacted or could be enacted by federal and state governments;
- future shutdowns of the federal government or changes to federal or state government assistance programs impacting the Company’s customers;
- the ability to keep pace with technological advances and changes in consumer behavior affecting our business;
- security breaches, cyber-attacks, or fraudulent activity;
- the ability to identify and obtain favorable locations for new or relocated dealerships at reasonable cost;
- the ability to successfully transition customers and inventory from underperforming dealerships to nearby more productive dealerships as part of the Company’s footprint optimization strategy;
- the ability to successfully identify, complete and integrate new acquisitions;
- the occurrence and impact of any adverse weather events or other natural disasters affecting the Company’s dealerships or customers;
- the Company's ability to maintain effective internal control over financial reporting following the remediation of its previously identified material weakness, and to design, implement, and maintain effective disclosure controls and procedures;
- the potential dilutive impact of outstanding warrants to purchase the Company's common stock, if exercised, and of any other future issuances of the Company's equity securities; and
- potential business and economic disruptions and uncertainty that may result from any future public health crises and any efforts to mitigate the financial impact and health risks associated with such developments.
Additionally, risks and uncertainties that may affect future results include those described from time to time in the Company’s SEC filings. The Company undertakes no obligation to update or revise any forward-looking statements, whether as a result of new information, future events or otherwise. Readers are cautioned not to place undue reliance on these forward-looking statements, which speak only as of the dates on which they are made.
Chief Financial Officer
(479) 464-9944
InvestorRelations@car-mart.com
andrew@smberger.com
(216) 464-6400
Media Contact
Car-MartComms@fticonsulting.com
| Consolidated Results of Operations | |||||||||||||||||
| (Amounts in thousands, except per share data) | |||||||||||||||||
| As a % of Sales | |||||||||||||||||
| Three Months Ended | Three Months Ended | ||||||||||||||||
| 2026 | 2025 | % Change | 2026 | 2025 | |||||||||||||
| Statements of Operations: | |||||||||||||||||
| Revenues: | |||||||||||||||||
| Sales | $ | 242,637 | $ | 309,702 | (21.7 | ) | % | 100.0 | % | 100.0 | % | ||||||
| Interest income | 60,189 | 60,472 | (0.5 | ) | 24.8 | 19.5 | |||||||||||
| Total | 302,826 | 370,174 | (18.2 | ) | 124.8 | 119.5 | |||||||||||
| Costs and expenses: | |||||||||||||||||
| Cost of sales | 167,022 | 196,896 | (15.2 | ) | 68.8 | 63.6 | |||||||||||
| Selling, general and administrative | 47,565 | 48,343 | (1.6 | ) | 19.6 | 15.6 | |||||||||||
| Provision for credit losses | 91,914 | 92,962 | (1.1 | ) | 37.9 | 30.0 | |||||||||||
| Interest expense | 19,993 | 17,373 | 15.1 | 8.2 | 5.6 | ||||||||||||
| Impairment expense | 6,382 | - | - | 2.6 | - | ||||||||||||
| Depreciation and amortization | 1,926 | 1,947 | (1.1 | ) | 0.8 | 0.6 | |||||||||||
| (Gain) loss on disposal of property and equipment | (235 | ) | 175 | (234.3 | ) | (0.1 | ) | 0.1 | |||||||||
| Total | 334,567 | 357,696 | (6.5 | ) | 137.9 | 115.5 | |||||||||||
| Income (Loss) before taxes | (31,741 | ) | 12,478 | (13.1 | ) | 4.0 | |||||||||||
| Provision (benefit) for income taxes | (2,176 | ) | 1,843 | (0.9 | ) | 0.6 | |||||||||||
| Net income (loss) | $ | (29,565 | ) | $ | 10,635 | (12.2 | ) | 3.4 | |||||||||
| Dividends on subsidiary preferred stock | (10 | ) | (10 | ) | |||||||||||||
| Net income (loss) attributable to common shareholders | $ | (29,575 | ) | $ | 10,625 | ||||||||||||
| Earnings (Loss) per share: | |||||||||||||||||
| Basic | $ | (3.56 | ) | $ | 1.29 | ||||||||||||
| Diluted | $ | (3.56 | ) | $ | 1.26 | ||||||||||||
| Weighted average number of shares used in calculation: | |||||||||||||||||
| Basic | 8,303,434 | 8,260,468 | |||||||||||||||
| Diluted | 8,303,434 | 8,428,197 | |||||||||||||||
| Consolidated Results of Operations | |||||||||||||||||
| (Amounts in thousands, except per share data) | |||||||||||||||||
| As a % of Sales | |||||||||||||||||
| Twelve Months Ended | Twelve Months Ended | ||||||||||||||||
| 2026 | 2025 | % Change | 2026 | 2025 | |||||||||||||
| Statements of Operations: | |||||||||||||||||
| Revenues: | |||||||||||||||||
| Sales | $ | 1,027,813 | $ | 1,146,208 | (10.3 | ) | % | 100.0 | % | 100.0 | % | ||||||
| Interest income | 253,689 | 244,724 | 3.7 | 24.7 | 21.4 | ||||||||||||
| Total | 1,281,502 | 1,390,932 | (7.9 | ) | 124.7 | 121.4 | |||||||||||
| Costs and expenses: | |||||||||||||||||
| Cost of sales | 663,981 | 726,055 | (8.5 | ) | 64.6 | 63.3 | |||||||||||
| Selling, general and administrative | 208,084 | 188,921 | 10.1 | 20.2 | 16.5 | ||||||||||||
| Provision for credit losses | 419,230 | 374,559 | 11.9 | 40.8 | 32.7 | ||||||||||||
| Interest expense | 74,494 | 70,650 | 5.4 | 7.2 | 6.2 | ||||||||||||
| Impairment expense | 11,016 | - | - | 1.1 | - | ||||||||||||
| Loss on extinguishment of debt | 4,476 | - | - | 0.4 | - | ||||||||||||
| Depreciation and amortization | 8,207 | 7,647 | 7.3 | 0.8 | 0.7 | ||||||||||||
| (Gain) loss on disposal of property and equipment | (5 | ) | 299 | (101.7 | ) | - | - | ||||||||||
| Total | 1,389,483 | 1,368,131 | 1.6 | 135.2 | 119.4 | ||||||||||||
| Income (Loss) before taxes | (107,981 | ) | 22,801 | (10.5 | ) | 2.0 | |||||||||||
| Provision (benefit) for income taxes | 31,130 | 4,869 | 3.0 | 0.4 | |||||||||||||
| Net income (loss) | $ | (139,111 | ) | $ | 17,932 | (13.5 | ) | 1.6 | |||||||||
| Dividends on subsidiary preferred stock | (40 | ) | (40 | ) | |||||||||||||
| Net income (loss) attributable to common shareholders | $ | (139,151 | ) | $ | 17,892 | ||||||||||||
| Earnings (Loss) per share: | |||||||||||||||||
| Basic | $ | (16.79 | ) | $ | 2.38 | ||||||||||||
| Diluted | $ | (16.79 | ) | $ | 2.33 | ||||||||||||
| Condensed Consolidated Balance Sheet and Other Data | ||||||||
| (Amounts in thousands, except per share data) | ||||||||
| 2026 | 2025 | |||||||
| Cash and cash equivalents | $ | 46,962 | $ | 9,808 | ||||
| Restricted cash from collections on auto finance receivables | $ | 84,684 | $ | 114,729 | ||||
| Finance receivables, net | $ | 1,079,167 | $ | 1,180,673 | ||||
| Inventory | $ | 54,074 | $ | 112,229 | ||||
| Total assets | $ | 1,416,840 | $ | 1,606,474 | ||||
| Senior Secured Notes Payable, net | $ | 263,681 | $ | - | ||||
| Revolving lines of credit, net | $ | - | $ | 204,769 | ||||
| Non-recourse notes payable, net | $ | 458,685 | $ | 572,010 | ||||
| $ | 298,517 | $ | 298,220 | |||||
| Total equity | $ | 445,656 | $ | 569,522 | ||||
| Shares outstanding | 8,305,520 | 8,263,280 | ||||||
| Book value per outstanding share | $ | 53.71 | $ | 68.97 | ||||
| Allowance for credit losses | (329,901 | ) | (323,100 | ) | ||||
| Allowance as % of principal balance net of deferred revenue | 25.15 | % | 23.25 | % | ||||
| Changes in allowance for credit losses: | ||||||||
| Twelve Months Ended | ||||||||
| 2026 | 2025 | |||||||
| Balance at beginning of period | $ | 323,100 | $ | 331,260 | ||||
| Provision for credit losses | 419,230 | 374,559 | ||||||
| Charge-offs, net of collateral recovered | (412,429 | ) | (382,719 | ) | ||||
| Balance at end of period | $ | 329,901 | $ | 323,100 | ||||
| Condensed Consolidated Statements of Cash Flows | ||||||||
| (Amounts in thousands) | ||||||||
| Twelve Months Ended | ||||||||
| 2026 | 2025 | |||||||
| Operating activities: | ||||||||
| Net loss | $ | (139,111 | ) | $ | 17,932 | |||
| Provision for credit losses | 419,230 | 374,559 | ||||||
| Losses on claims for accident protection plan | 36,276 | 34,525 | ||||||
| Loss on extinguishment of debt | 2,726 | - | ||||||
| Depreciation and amortization | 8,207 | 7,647 | ||||||
| Finance receivable originations | (952,451 | ) | (1,075,080 | ) | ||||
| Finance receivable collections | 477,730 | 469,379 | ||||||
| Inventory | 180,287 | 114,573 | ||||||
| Deferred accident protection plan revenue | (6,518 | ) | (378 | ) | ||||
| Deferred service contract revenue | (10,313 | ) | (7,158 | ) | ||||
| Income taxes, net | (4,975 | ) | 4,409 | |||||
| Deferred income taxes | 27,061 | - | ||||||
| Impairment of assets | 11,016 | |||||||
| Other | 15,794 | 10,828 | ||||||
| Net cash provided by (used in) operating activities | 64,959 | (48,764 | ) | |||||
| Investing activities: | ||||||||
| Purchase of investments | - | (7,527 | ) | |||||
| Purchase of property and equipment and other | (1,810 | ) | (3,890 | ) | ||||
| Proceeds from sale of property and equipment | 289 | 42 | ||||||
| Net cash used in investing activities | (1,521 | ) | (11,375 | ) | ||||
| Financing activities: | ||||||||
| Issuance of common stock | 218 | 74,106 | ||||||
| Purchase of common stock | (297 | ) | (434 | ) | ||||
| Dividend payments | (40 | ) | (40 | ) | ||||
| Change in cash overdrafts | (1,289 | ) | 466 | |||||
| Debt issuance costs | (20,252 | ) | (9,006 | ) | ||||
| Non-recourse notes payable, net | (113,821 | ) | 18,558 | |||||
| Revolving line of credit, net | (207,098 | ) | 6,579 | |||||
| Loss on extinguishment of debt | (1,750 | ) | - | |||||
| Issuance of senior secured notes payable | 288,000 | - | ||||||
| Net cash provided by (used in) financing activities | (56,329 | ) | 90,229 | |||||
| Increase in cash, cash equivalents, and restricted cash | $ | 7,109 | $ | 30,090 | ||||
| Reconciliation of Non-GAAP Financial Measures | ||||||||
| (Amounts in thousands) | ||||||||
| Calculation of Adjusted SG&A as Percentage of Sales: | ||||||||
| Three Months Ended | Three Months Ended | |||||||
| 2026 | 2025 | |||||||
| Sales | 242,637 | 309,702 | ||||||
| Selling, general and administrative | 47,565 | 48,343 | ||||||
| Restructuring-related charges(1) | 3,961 | - | ||||||
| Adjusted selling, general and administrative | 43,604 | 48,343 | ||||||
| Adjusted SG&A as a percentage of sales | 18.0 | % | 15.6 | % | ||||
| Reconciliation of Non-GAAP Financial Measures | ||||||||
| (Amounts in thousands) | ||||||||
| Calculation of Adjusted Loss Per Share: | ||||||||
| Three Months Ended | Twelve Months Ended | |||||||
| 2026 | 2026 | |||||||
| Net loss attributable to common shareholders (A) | $ | (29,575 | ) | $ | (139,151 | ) | ||
| Loss on extinguishment of debt adjustment(1) | - | 4,476 | ||||||
| Credit loss impact of allowance percentage adjustment | 24,927 | 54,932 | ||||||
| Impairment of assets impacted by lot closures and non-core adjustments(1) | 6,382 | 11,016 | ||||||
| Restructuring-related charges(1) | 3,961 | 3,961 | ||||||
| Pre-tax impact of adjustments (B) | 35,270 | 74,385 | ||||||
| Tax effect of adjustment [effective tax rate of (28.83)%] (C) | (10,168 | ) | (21,445 | ) | ||||
| Tax impact of deferred tax asset valuation allowance (D) | 8,444 | 55,454 | ||||||
| Post-tax impact of adjustments (B+C+D) | 33,546 | 108,394 | ||||||
| Adjusted net loss attributable to common shareholders (A+(B+C+D)) | 3,971 | (30,757 | ) | |||||
| Weighted average shares outstanding | 8,303 | 8,289 | ||||||
| Adjusted loss per share | $ | 0.48 | $ | (3.71 | ) | |||
| Diluted earnings (loss) per share (GAAP)(2) | $ | (3.56 | ) | $ | (16.79 | ) | ||
| Diluted earnings (loss) per share impact of adjustments | $ | (4.04 | ) | $ | (13.08 | ) | ||
| (1)The Company recorded certain one-time items in each quarter that did not recur in the other period; as a result, the non-GAAP adjustments reflected in each reconciliation may differ between period. | ||||||||
| (2)Diluted earnings (loss) per share for the current quarter was the same as basic earnings (loss) per share because the net loss makes potential common stock equivalents anti-dilutive. | ||||||||
| Reconciliation of Non-GAAP Financial Measures | ||||||||
| (Amounts in thousands) | ||||||||
| Calculation of Debt, Net of Total Cash, to Finance Receivables: | ||||||||
| Debt: | ||||||||
| Senior Secured Notes Payable, net | $ | 263,681 | $ | - | ||||
| Revolving lines of credit, net | - | 204,769 | ||||||
| Notes payable, net | 458,685 | 572,010 | ||||||
| Total debt | $ | 722,366 | $ | 776,779 | ||||
| Cash: | ||||||||
| Cash and cash equivalents | $ | 46,962 | $ | 9,808 | ||||
| Restricted cash | 84,684 | 114,729 | ||||||
| Total cash, cash equivalents, and restricted cash | $ | 131,646 | $ | 124,537 | ||||
| Debt, net of total cash | $ | 590,720 | $ | 652,242 | ||||
| Principal balance of finance receivables | $ | 1,413,059 | $ | 1,509,155 | ||||
| Ratio of debt to finance receivables | 51.1 | % | 51.5 | % | ||||
| Ratio of debt, net of total cash, to finance receivables | 41.8 | % | 43.2 | % | ||||
An infographic accompanying this announcement is available at https://www.globenewswire.com/NewsRoom/AttachmentNg/3b6126a8-73d1-4d31-b313-55bae12bee31


Dollars in thousands, except per share data. Dollar and percentage changes may not recalculate due to rounding. Charts may not be to scale.