(All amounts expressed in
Second Quarter 2026 Highlights
Operations
- Gold production: 104,616 ounces.
- Gold sales: 102,691 ounces at an average realized gold price per ounce sold(1) of
$4,379 . - Total cash costs(1):
$1,432 per ounce sold. - All-in sustaining costs ("AISC")(1):
$1,926 per ounce sold. - Total capital expenditures:
$441.3 million , including$154.6 million of project capital and$59.6 million of accelerated operational capital at Skouries, and$78.1 million project capital invested atMcIlvenna Bay . Growth capital(1) at the operating mines totalled$91.1 million and sustaining capital(1) at operating mines totalled$35.0 million .
Financial
- Revenue:
$487.5 million . - Production costs:
$184.8 million . - Net cash generated from operating activities from continuing operations:
$149.5 million . - Cash flow from operating activities before changes in working capital(1):
$103.1 million . - Cash and cash equivalents:
$554.6 million , as atJune 30, 2026 . Cash decreased by$314.8 million compared to Q4 2025, primarily due to growth capital investment, share buybacks, repayments of the VAT Facility, dividend payments, and income taxes paid. These cash outflows are offset partly by cash generated from operating activities, drawdowns on the Credit Facility and Term Facility as well as cash received on the acquisition of Foran Mining Corporation ("Foran").(2) - Net earnings attributable to shareholders:
$172.8 million , or$0.69 basic earnings per share. - Adjusted net earnings(1):
$136.7 million or$0.54 per share in Q2 2026. Adjustments in Q2 2026 include a$47.4 million gain on deferred tax due to changes in the Turkish corporate income tax rate, a net gain on derivative instruments of$19.0 million , and a$13.1 million expense relating to acquisition and integration costs. - Adjusted net earnings before interest, taxes, depreciation and amortization ("Adjusted EBITDA")(1):
$281.1 million in Q2 2026. - Free cash flow(1): Negative
$334.1 million in Q2 2026 primarily due to continued investment in Skouries andMcIlvenna Bay . Free cash flow excluding Skouries andMcIlvenna Bay (1) was$40.9 million .
Production and Cost Outlook
The Company is updating its consolidated 2026 annual gold production guidance to 495,000 to 600,000 ounces, reflecting the addition of initial gold production from
Excluding Skouries and
Post acquisition production at
Corporate
- On
July 30, 2026 , the Company declared a third quarter dividend of$0.075 per common share, payable onSeptember 15, 2026 to shareholders of record at the close of business onSeptember 1, 2026 . Steve Reid stepped down as Chair and from the Board, effectiveJuly 30, 2026 .Dan Myerson was appointed as Chair of the Board, effectiveJuly 30, 2026 .Patrick Godin was appointed as Lead Independent Director, effectiveJuly 30, 2026 .George Burns will retire as Chief Executive Officer ofEldorado Gold , effectiveSeptember 30, 2026 . Following his retirement from management,Mr. Burns will remain on the Company’s Board of Directors.Christian Milau will assume the role of President and Chief Executive Officer and will join the Board of Directors, effectiveSeptember 30, 2026 .- Paul Ferneyhough’s role will expand to Executive Vice President, Strategy and Chief Financial Officer, effective
September 30, 2026 .
Commentary
“Second quarter results reflect continued cash flow generation across the portfolio, supported by a favourable gold price environment and consistent operational performance, despite planned lower production at Kisladag," said
We also achieved several key milestones across our growth projects. At Skouries, construction is nearing completion, with first ore successfully crushed on temporary power, marking an important step as we prepare to transition from commissioning into operations. At
Overall, these achievements reflect continued execution across our portfolio as we advance our growth projects and position the Company for increasing production and cash flow generation through the second half of the year.”
Skouries Highlights
First production of the copper-gold concentrate is expected in Q3 2026 and commercial production is expected in Q4 2026, with 2026 gold production projected to be between 60,000 and 100,000 ounces and copper production projected to be between 20 and 40 million pounds.
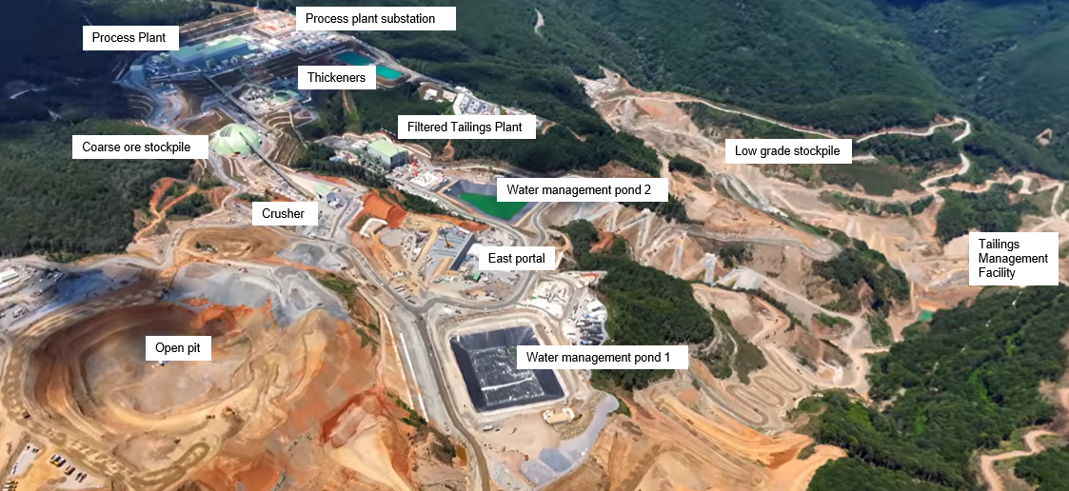
Skouries site layout
Concentrate Off-Take Agreements
The Company has entered into concentrate sales agreements with several offtakers for all expected 2026 volumes and a portion of 2027 volumes, and is in the final process with other counterparties to conclude agreements covering production through to 2029. The commercial terms agreed to are significantly better than those assumed in the 2022 feasibility study, reflective of the prevailing strong market conditions for copper-gold concentrates.
Capital Estimate and Schedule
The capital cost estimate for Skouries is approximately
The project remains fully funded through operating cash flow, cash and debt financing. The Term Facility totalling €740.4 million (
Project capital totalled
The Company is well positioned for start-up, with over 3.9 million tonnes of ore stockpiled which is expected to provide the ore feed required through 2026 and supports a lower-risk commissioning and first year of production. Open pit and underground ore mining will continue for the balance of 2026 and will be blended to maximize cash flow with lower value ore being stockpiled for future years.
Construction Activities
As at
The primary crusher has crushed first ore in July in anticipation of mill start-up, marking an important commissioning milestone for the crushing circuit.
The stockpile dome, ancillary feeders and associated chute work is complete and ready for full operations.
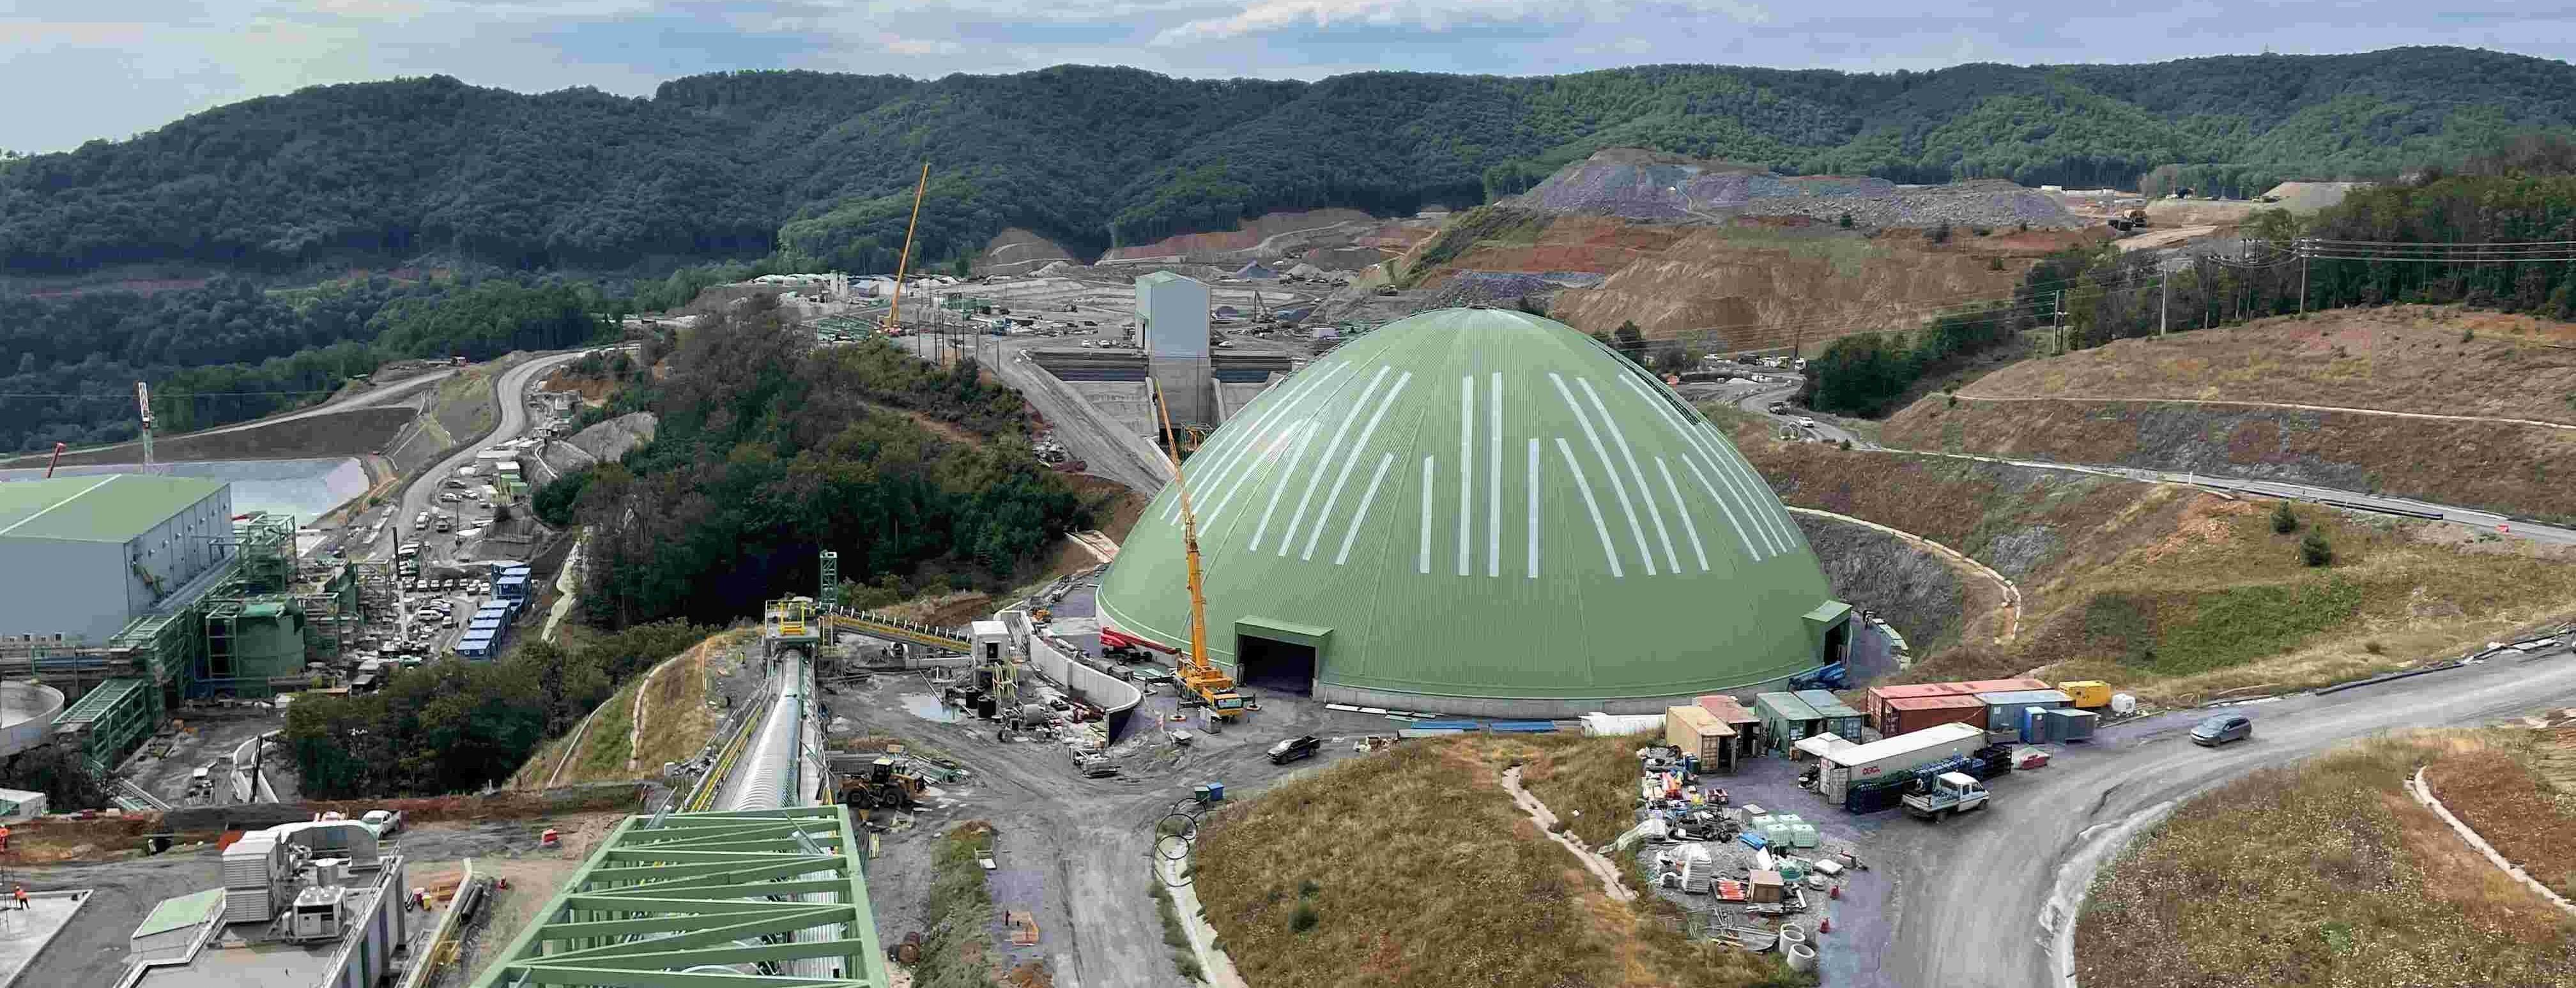
Coarse ore stockpile dome
Process Plant
The process plant is substantially complete, with wet commissioning well underway, in preparation for first ore introduction. Water circulation testing through the entire circuit to the tailings thickener/filter feed tanks is underway.
Thickeners
Two of the three tailings thickeners are in the final stages of being commissioned in advance of first ore. Concrete foundation work for the third tailings thickener, which is not required for start-up, has commenced, with completion planned in Q3 2026.
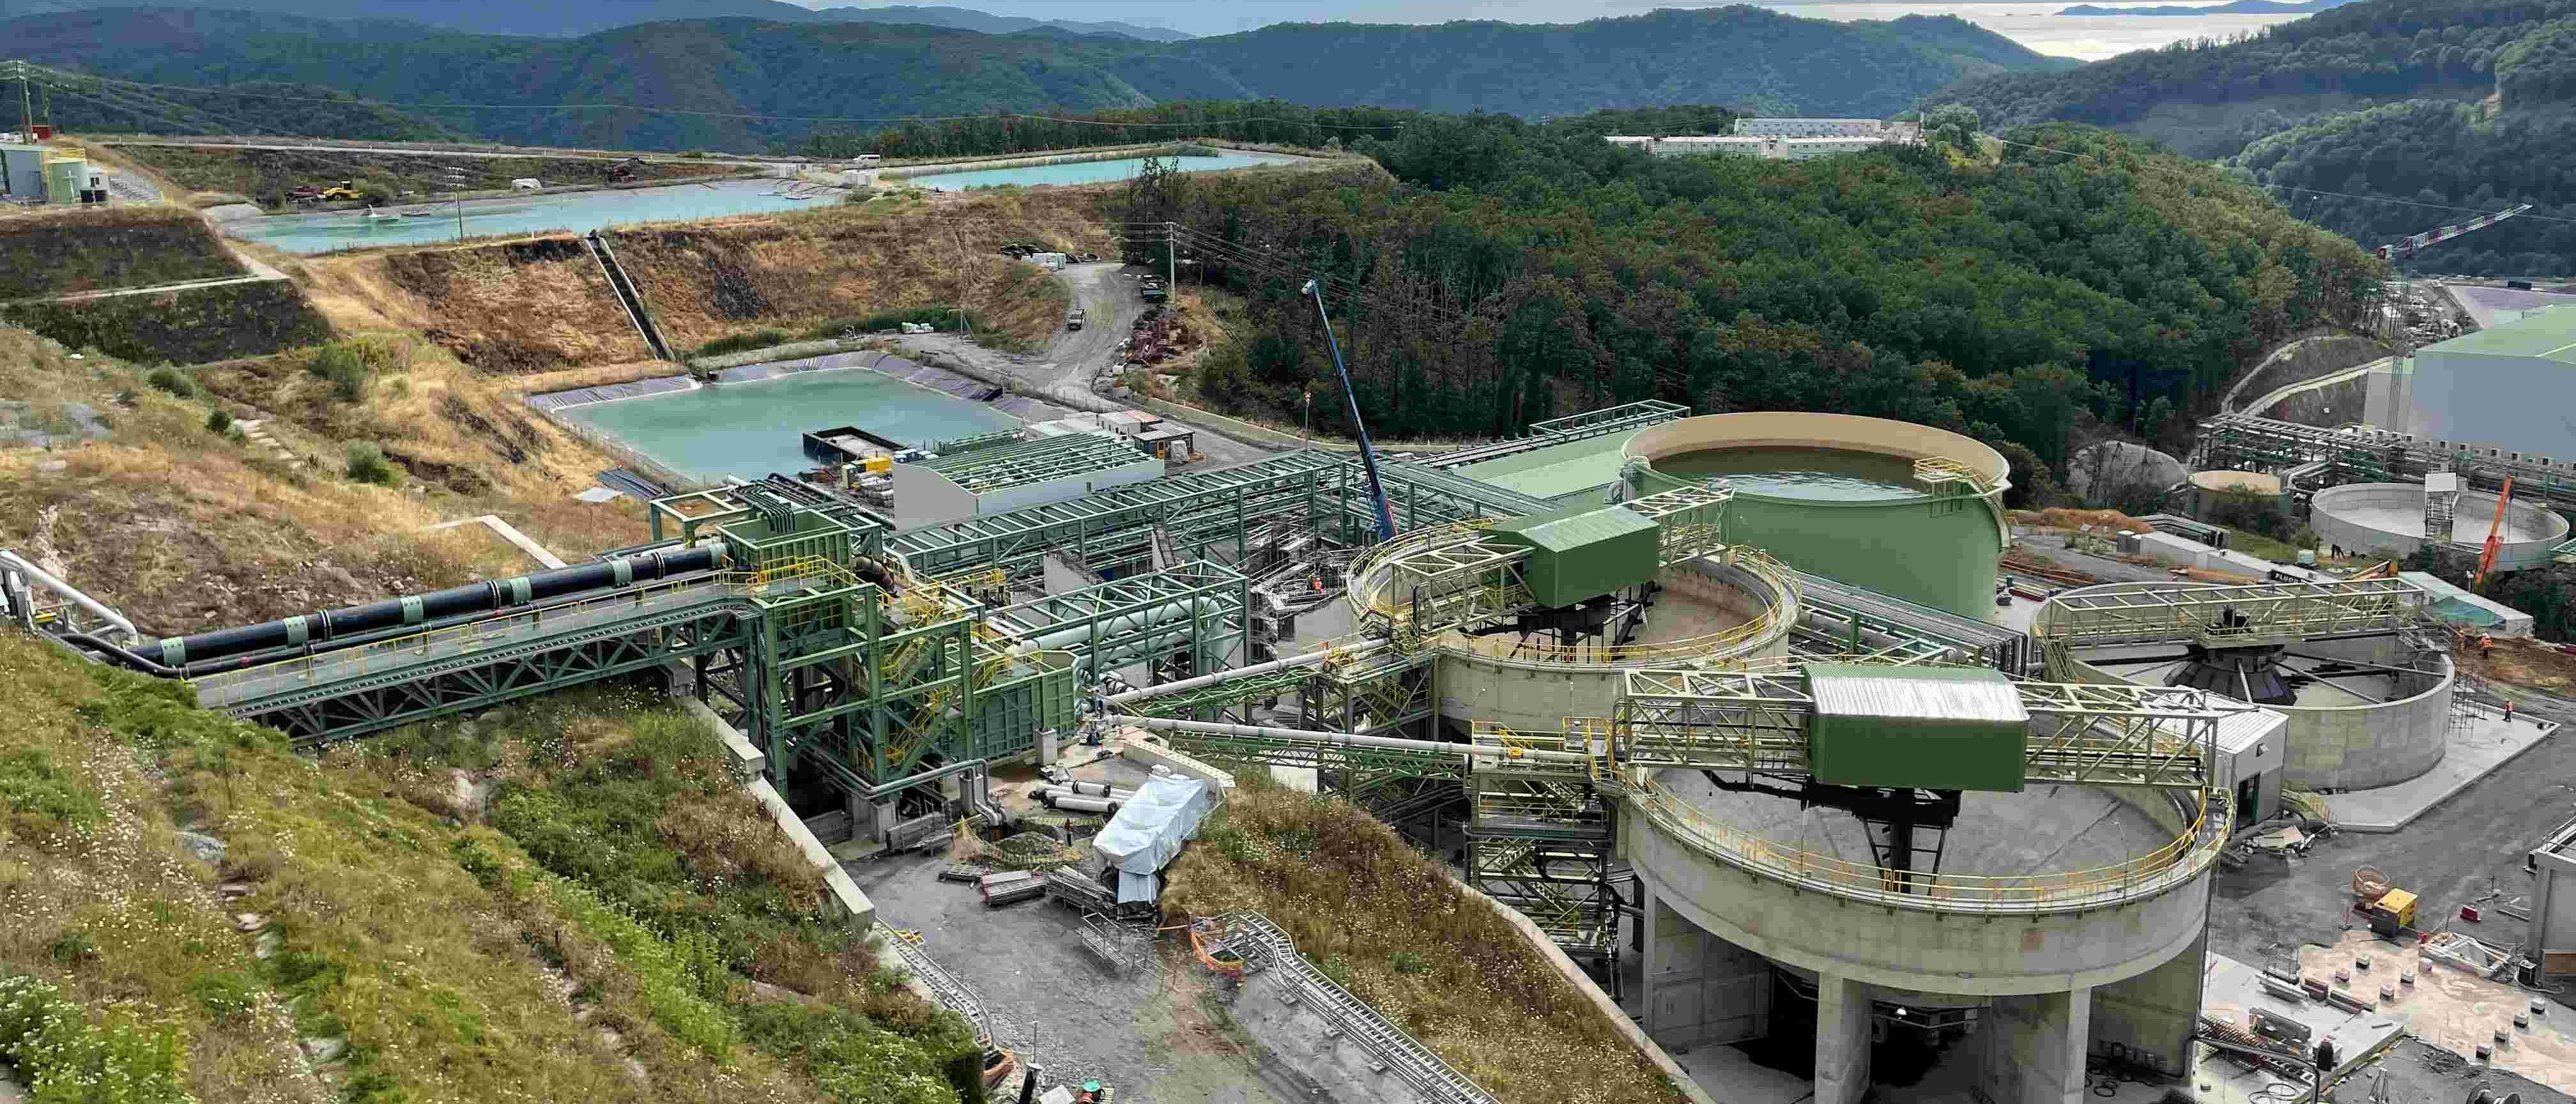
Thickeners
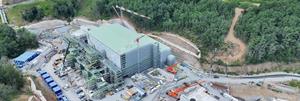
Filtered Tailings Facility
Work continues to progress on the filtered tailings plant which remains on the critical path, with electrical installations and commissioning as the final steps. Work is also advancing on the tailings handling infrastructure which is not required for first concentrate production.
Mechanical and electrical work on two of the six filters has been completed, with both filters ready for commissioning.
Construction of the filter plant tank farm with pump and piping installation and electrical connections are advancing towards commissioning commencement.
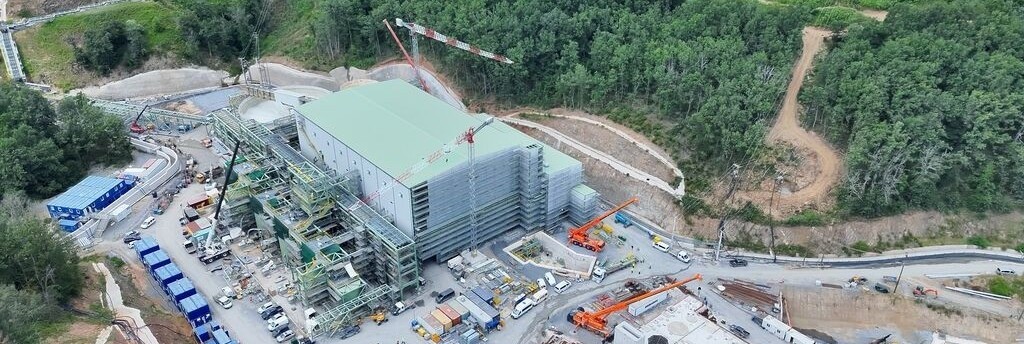
Filtered Tailings Facility
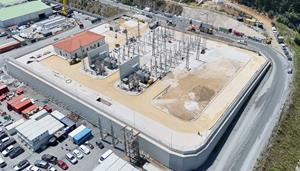
Powerline and Substations
Power infrastructure construction at Skouries has continued to advance and construction of all 12 towers and conductors is now complete. In July, the Company coordinated a successful eight-hour power suspension on the transmission line to enable installation of the final transmission tower. Initial tests of the sub-station have been completed by an independent third-party testing group. Final site energization and receipt of final sign-off remains contingent on inspection, which includes final testing and installation of metering equipment by the relevant Greek authority.
In the interim, the Company is proactively adding additional gensets to support commissioning activities and maintain progress where practical, including readiness and commissioning activities within the process plant. Full operation of major process plant systems, crushing, grinding, flotation, concentrate handling and tailings disposal, requires final site energization by the power authority.
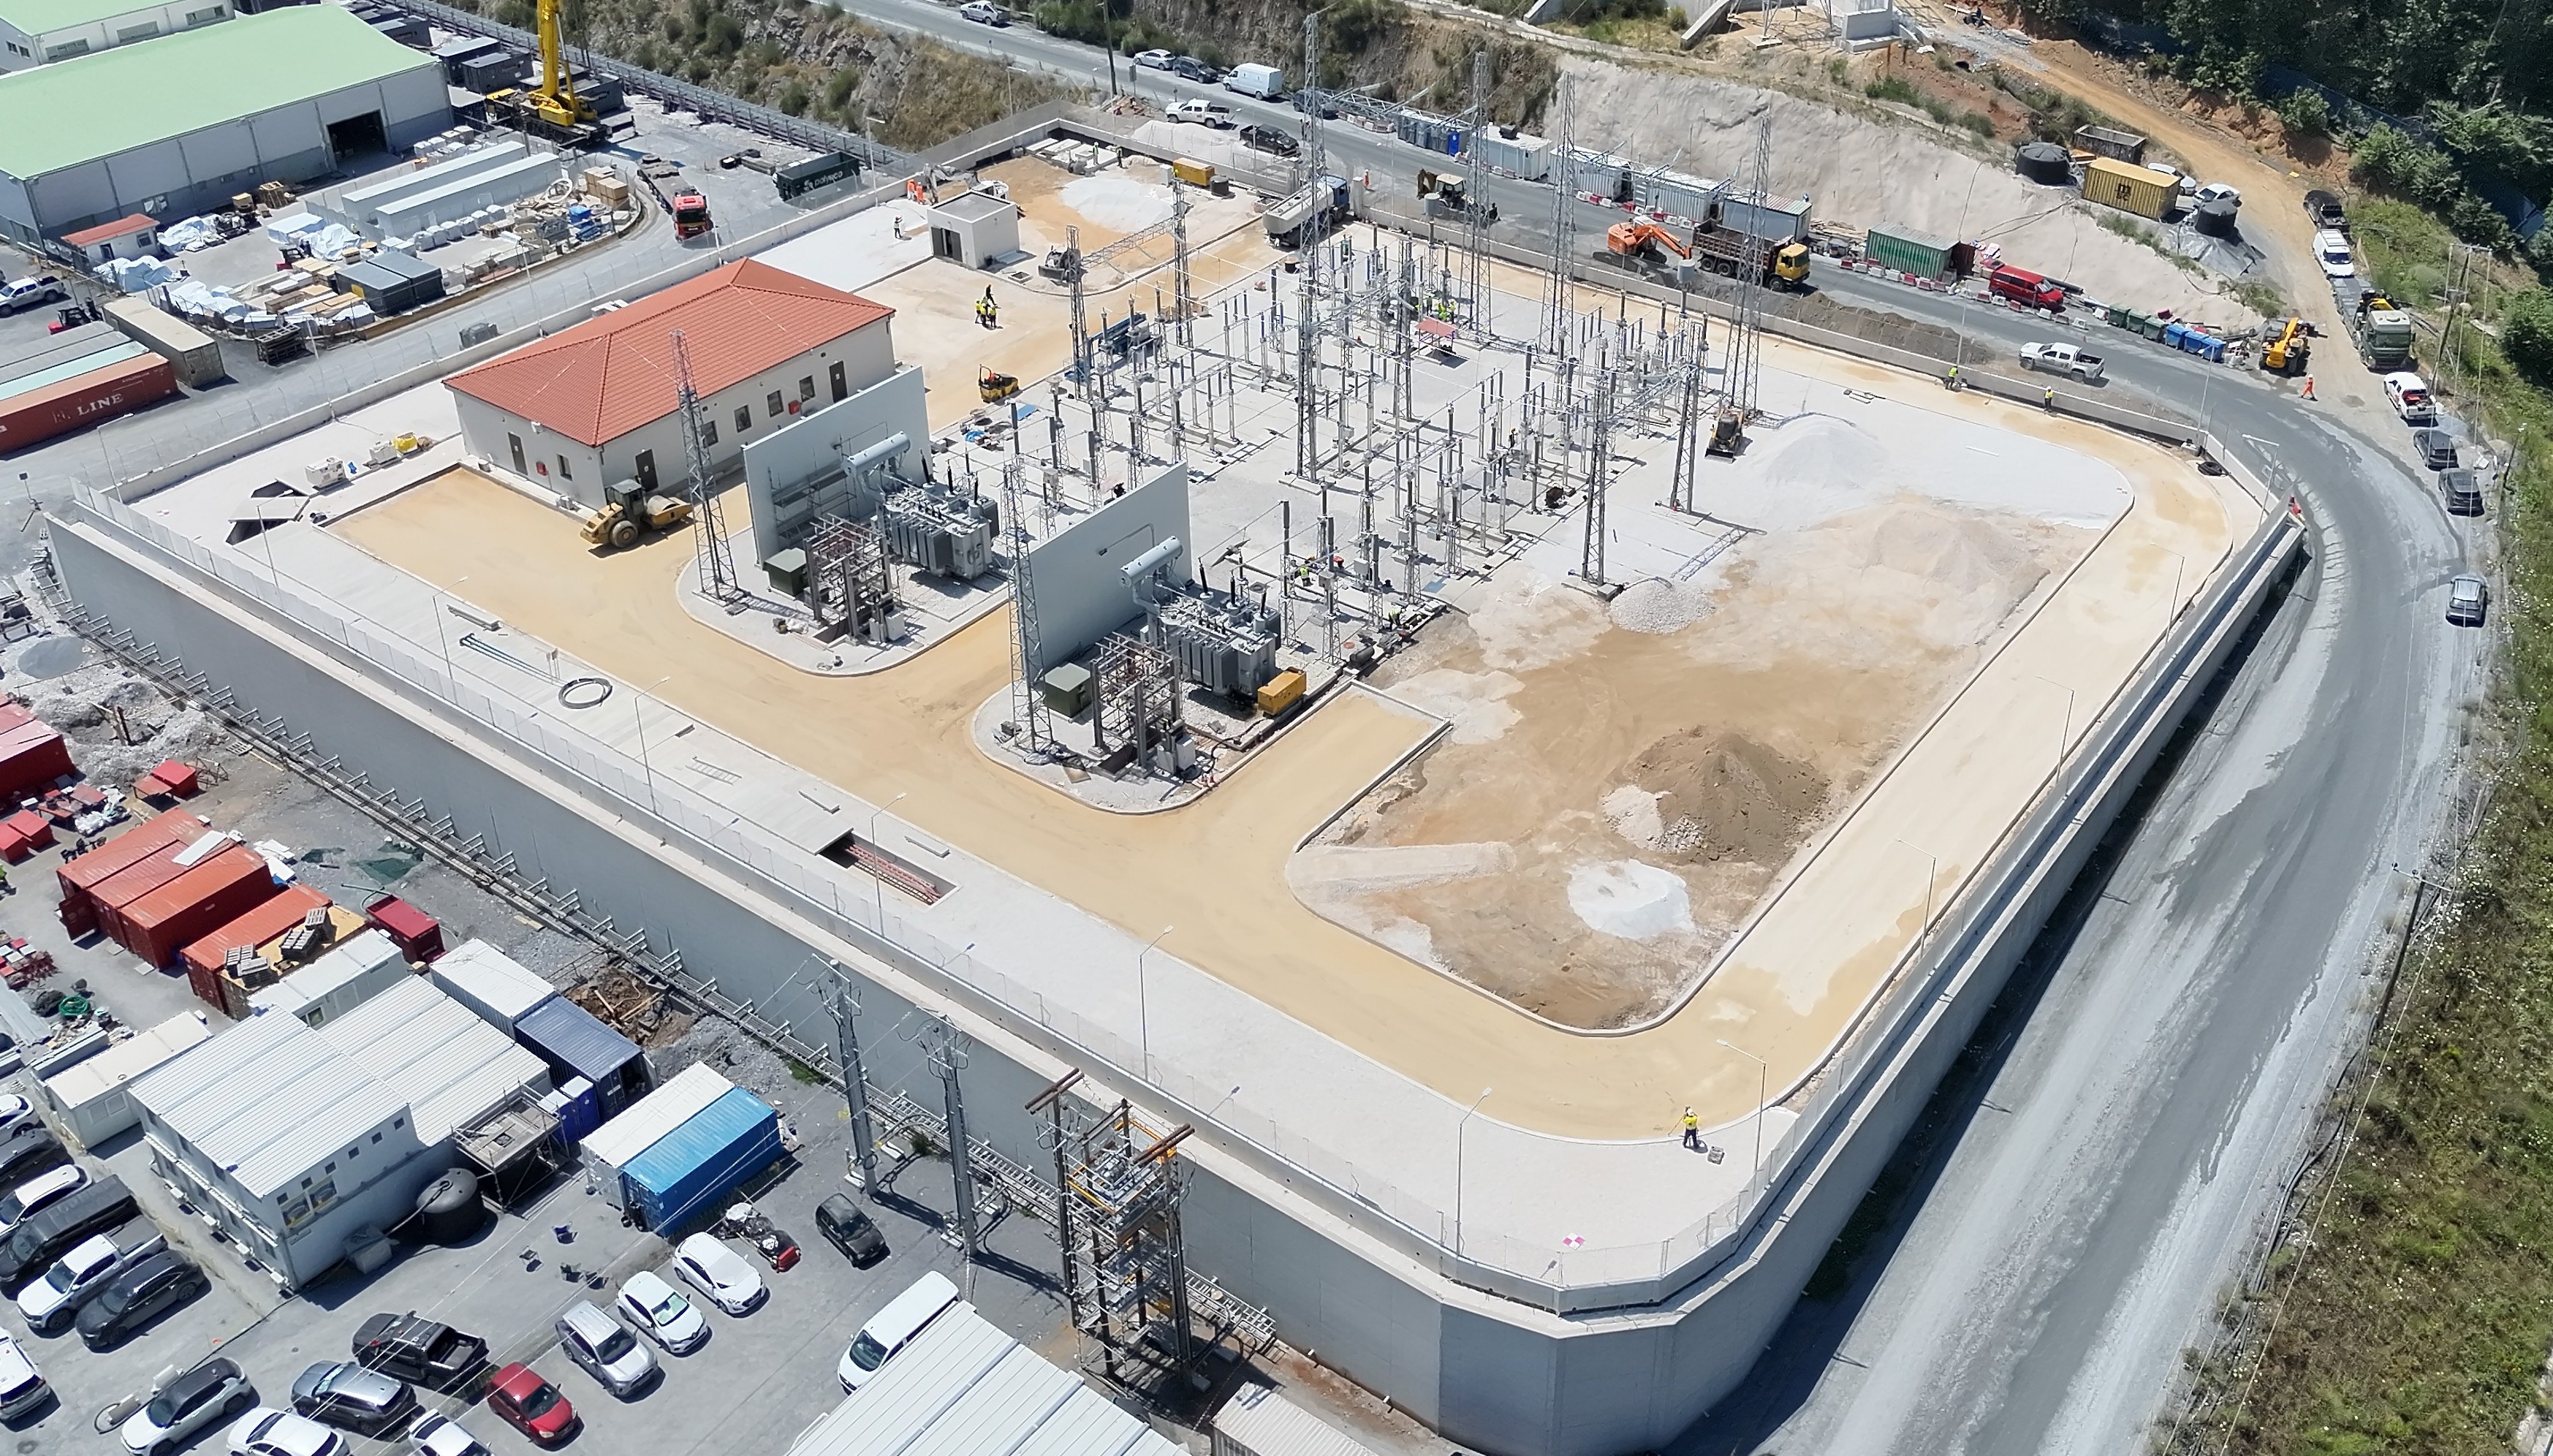
Process plant substation
Commissioning Activities
The plant continues to progress towards commissioning readiness across the major process and utility systems. The majority of the site’s electrical distribution network has been energized using temporary power, enabling the testing and commissioning of equipment prior to startup. Critical air and water utility systems are being progressively transferred to the commissioning team, supporting equipment flushing, functional testing, and wet commissioning. Equipment supplier specialists are on-site to support the commissioning of the SAG mill and ball mill, and work is ongoing. Successful integrated water testing of the process water, rougher flotation, and tailings thickening systems confirmed system performance and enabled expanded wet commissioning activities. Commissioning of the primary crushing and conveying system has begun, with extended runs of main equipment.
Integrated Extractive Waste Management Facility
The initial filtered tailings placement areas are well advanced. The platform for the tailings stacker is complete and ready for assembly, while the access ramp and platform for the mobile (grasshopper) conveyors have been excavated and prepared for placement of the conveyor units. Construction of the rock buttress supporting the downstream embankment of the first filtered tailings placement area in the Karatza Lakkos ("KL") valley is progressing and will be completed ahead of tailings placement.
Foundation preparation for the first phase of the KL filtered tailings embankment is substantially complete, and placement of engineered fill is underway across the full footprint.
Construction of the low-grade ore stockpile continued advancing. The lower section has been completed and construction is now focusing on the upper section.
Open Pit Mining
The open pit mine continued to ramp up during Q2 2026 and remains ahead of plan in building ore stockpiles for the process plant start-up. During the quarter, 1.28 million tonnes of ore were delivered to the stockpiles. At the end of Q2 2026, the stockpiles contained approximately 3.6 million tonnes of open pit and underground ore, representing an estimated 134,000 ounces of gold and 44 million pounds of copper.
The underground mine delivered 131 kt of ore to stockpiles during Q2 2026. Underground access development rates continued to accelerate, with a total of 2,191 metres of development completed during the quarter. Monthly advance rates reached a project record of 900 metres in
Drilling of the third test stope commenced in Q2 2026 in preparation for blasting and extraction of a larger test stope (approximately 100 kt), which is expected to support improved productivity.
Processing
The processing operations and maintenance teams have successfully completed their theoretical training and are now completing job familiarization training at both the Skouries and Olympias sites.
Twelve highly experienced process plant ramp-up experts have been contracted to support the operations team during the first three months of operations.
Workforce
As at
Skouries Multimedia
- A progress update video can be found here: https://youtu.be/jMpdM-m6vY4
- Photos of the construction progress at Skouries can be viewed and downloaded via this link:
https://eldoradogold.getbynder.com/share/303E6589-7229-4764-9BAC8F7299A7E887/
McIlvenna Bay Highlights
First production of copper concentrate from
The mine is expected to have a long life and is supported by a robust resource base, with highly prospective exploration upside across the broader district, including the nearby
Located in one of the world’s most attractive mining jurisdictions, the project benefits from established infrastructure and is designated by the
Production at
The total project capital cost estimate from
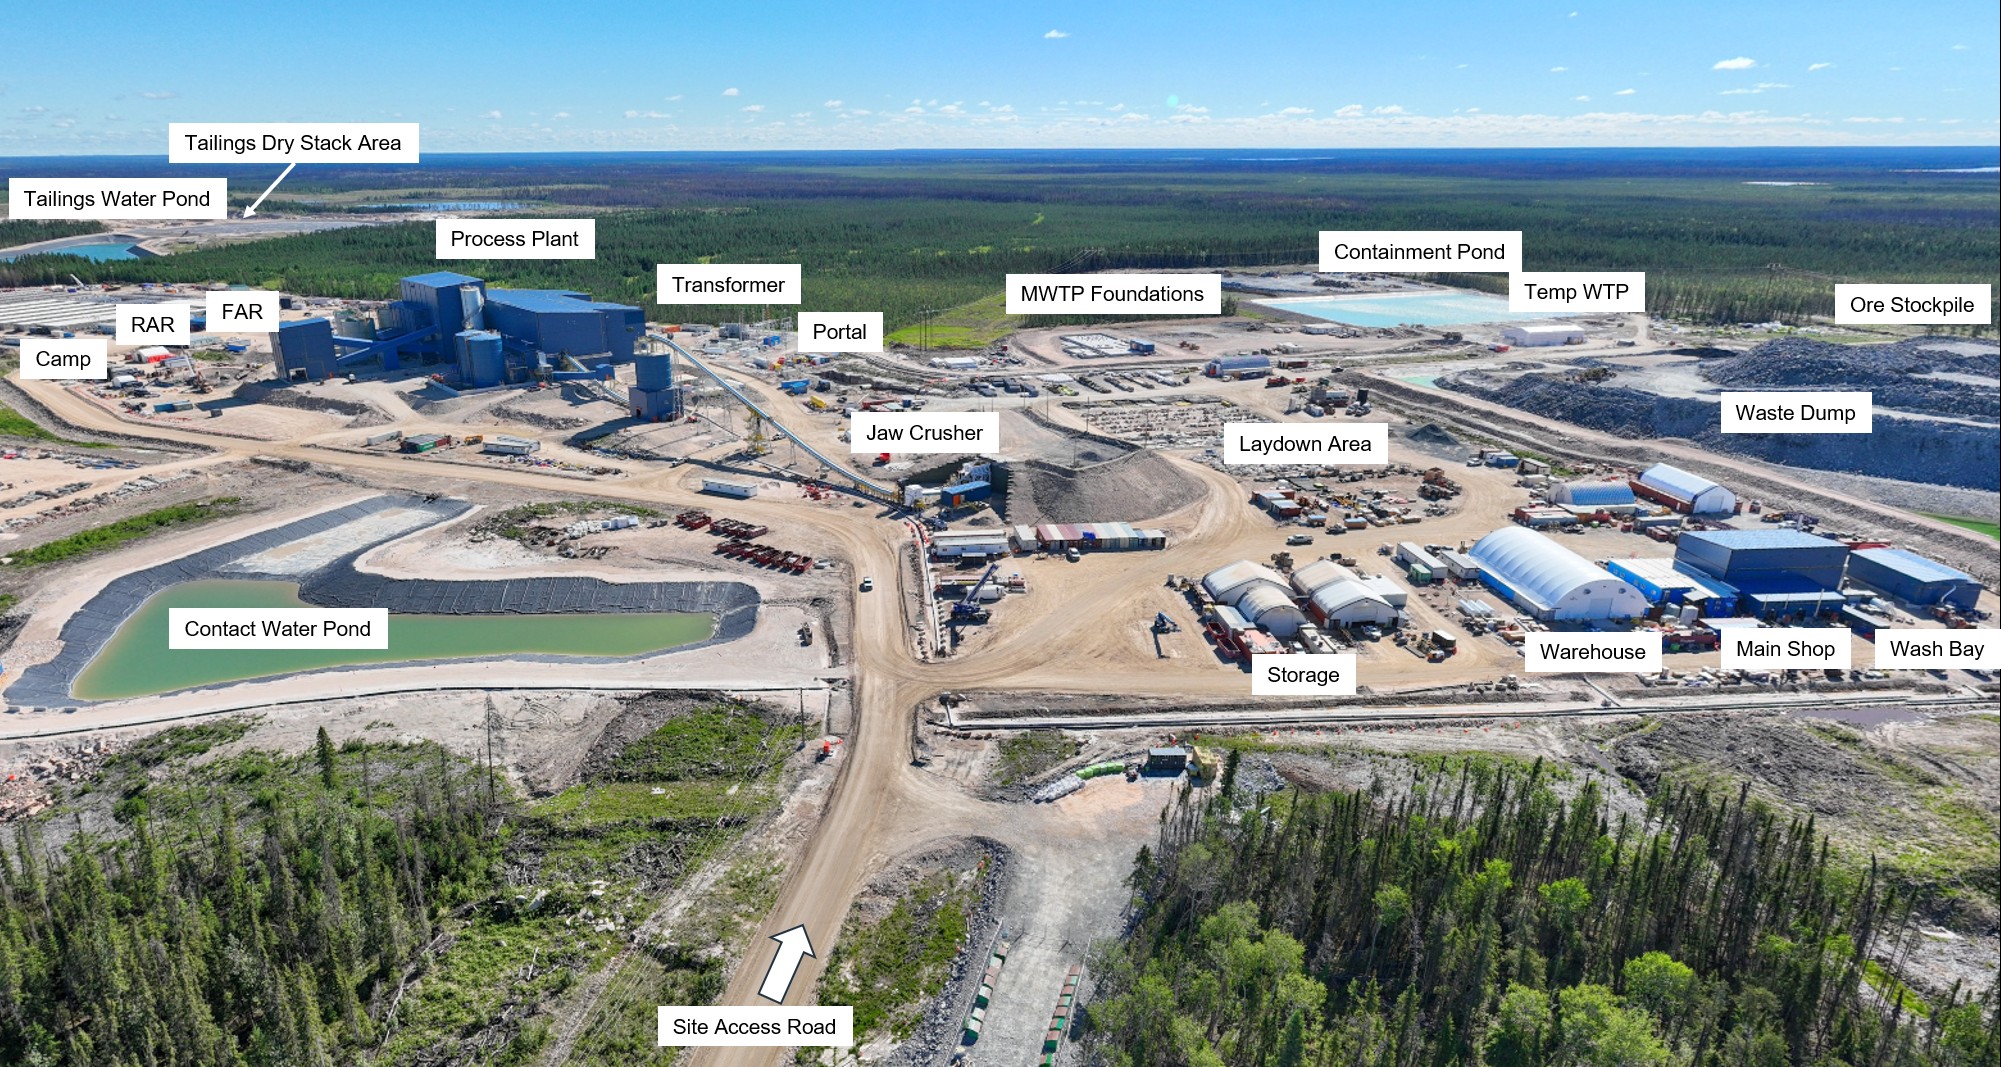
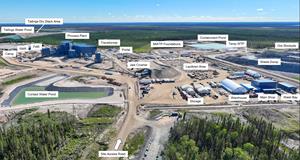
McIlvenna Bay Mine Site Overview
Operating Activities
More than 400 kt of copper and zinc mineralized material is available on surface for processing. The primary crusher is operating at design capacity, material transfer to the fine ore bin is as expected, and ore-sorting and metal separation practices continue to be refined.
Process Plant
The SAG and ball mill circuits are ramping up well and continue to demonstrate increasing throughput as commissioning advances. As expected for a new processing plant, we continue to work through equipment, instrumentation and other availability-related challenges associated with ramp-up. Throughput is expected to continue increasing through the third quarter as the operation progresses toward commercial production.
Flotation
All flotation circuits are fully commissioned and have successfully produced copper, zinc and pyrite concentrates. Final commissioning of the regrind circuit is underway and expected to be completed in early August, supporting further improvements in concentrate quality as ramp-up progresses.
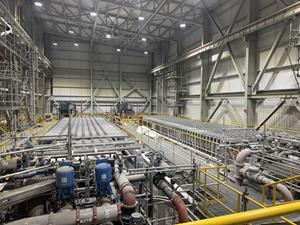
Thickening & Filtration
The thickening and filtration circuits are key to the ramp up of production. The teams are working to optimize the sequence of filtration and the thickening control circuit.
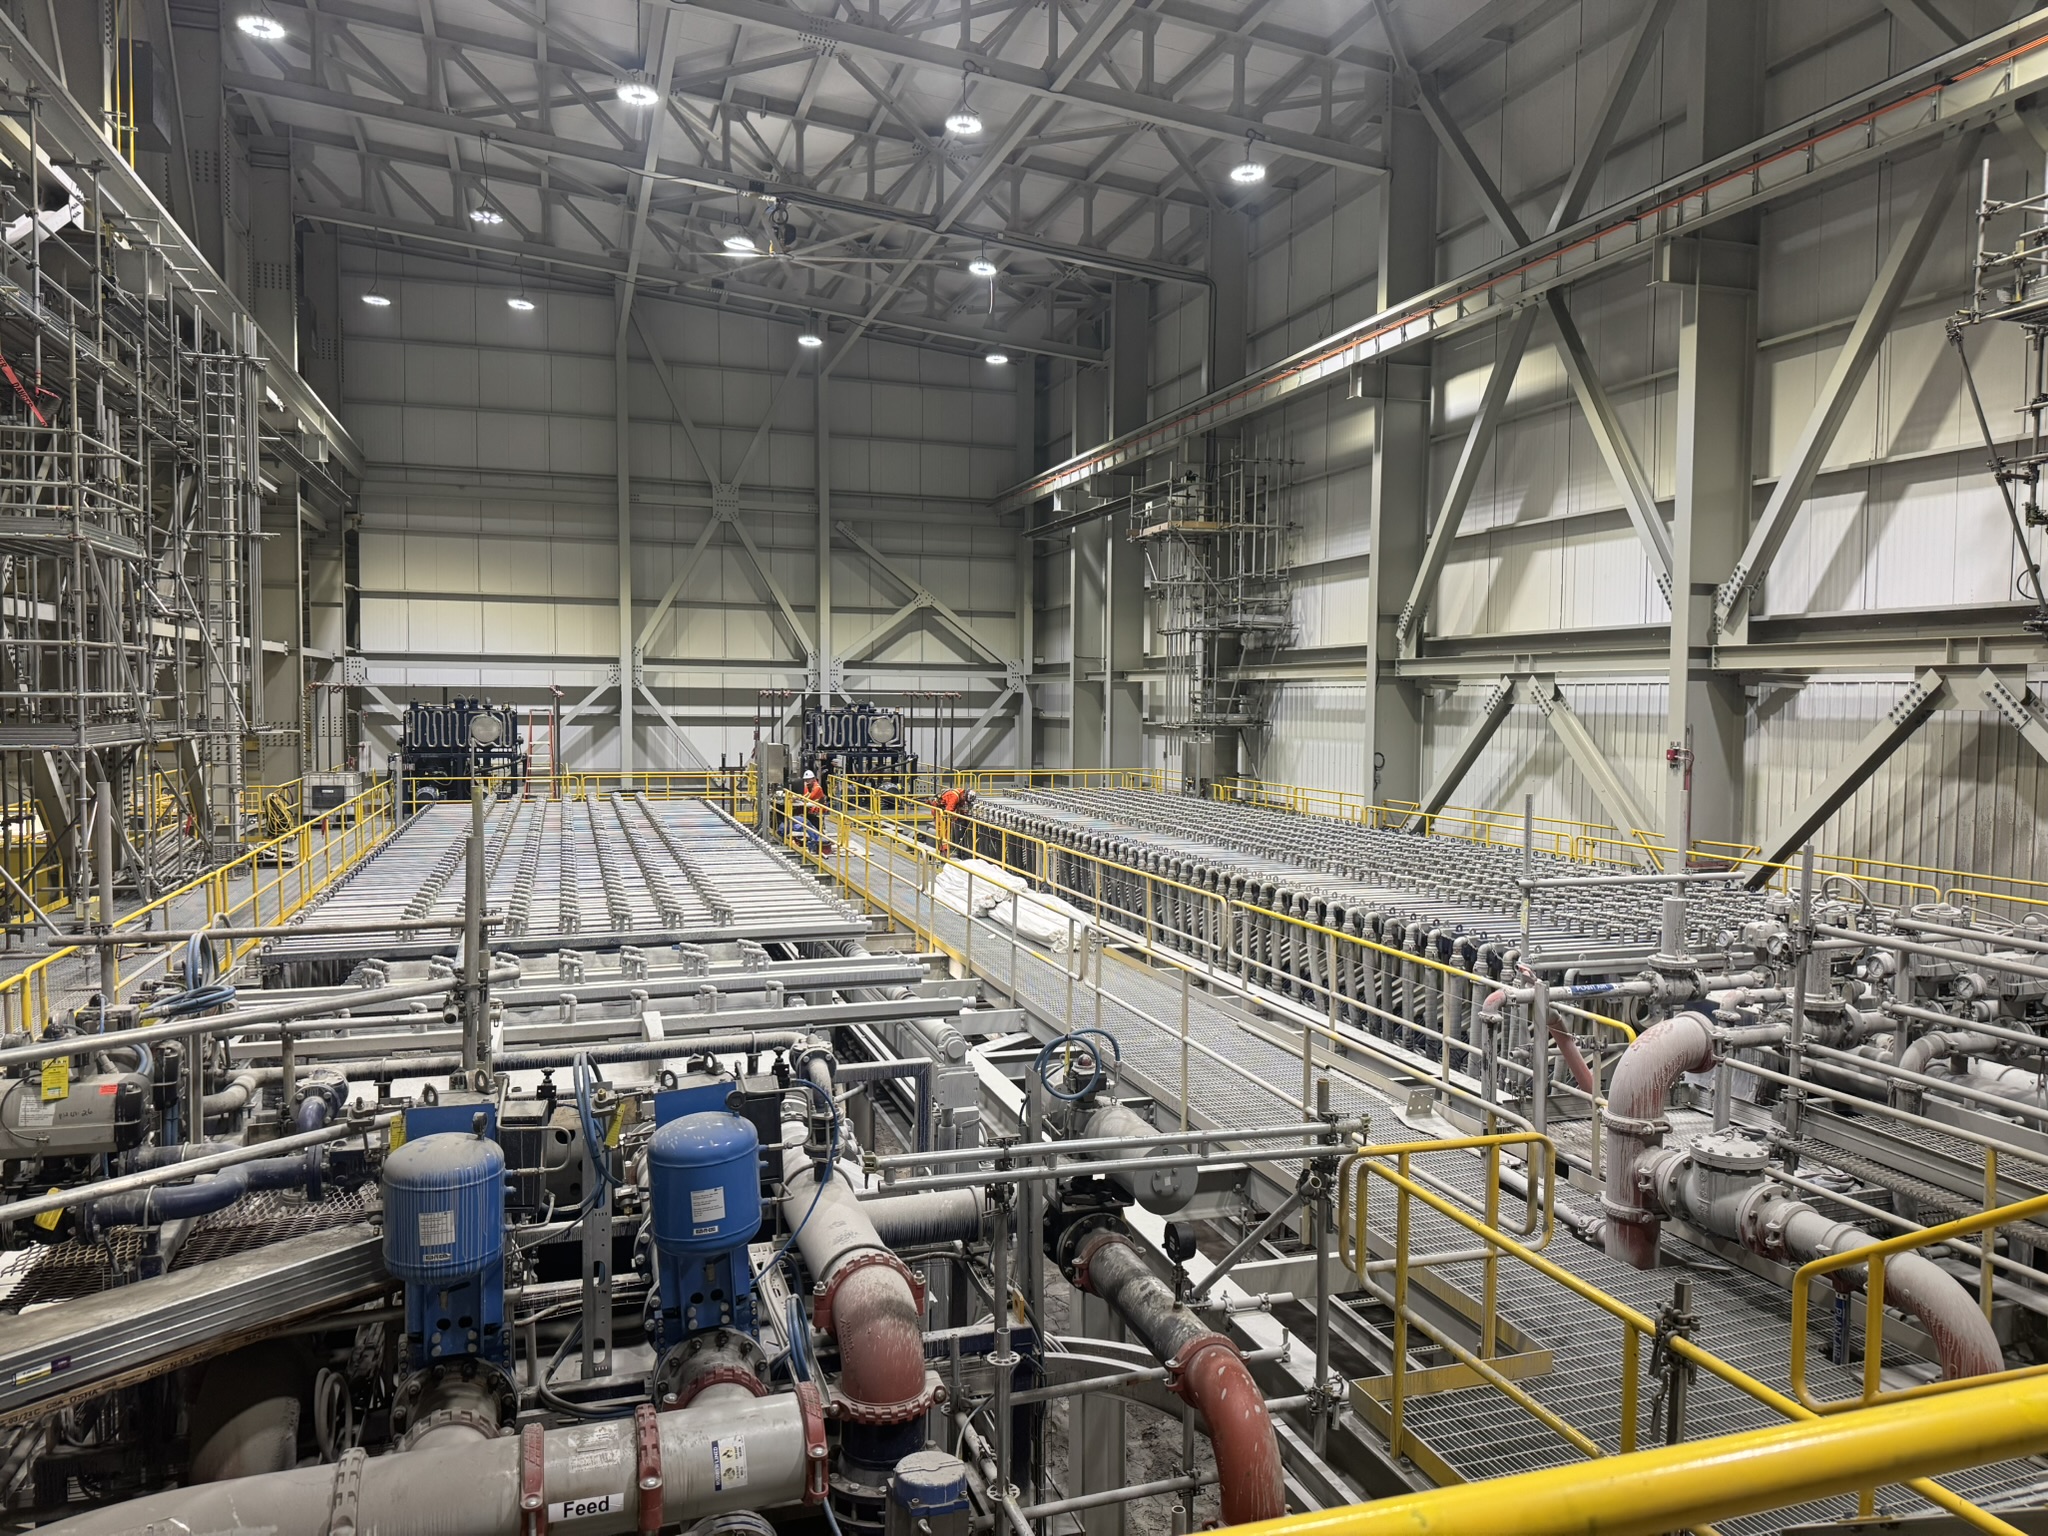
Tailings filtration within the process plant
Underground development continues to advance well. In addition to the 400 kt of ore stockpiled on surface, the mine has approximately 20 kt of blasted inventory, more than 330 km of drilling, and approximately 2 million tonnes of fully developed reserves within Block 1.
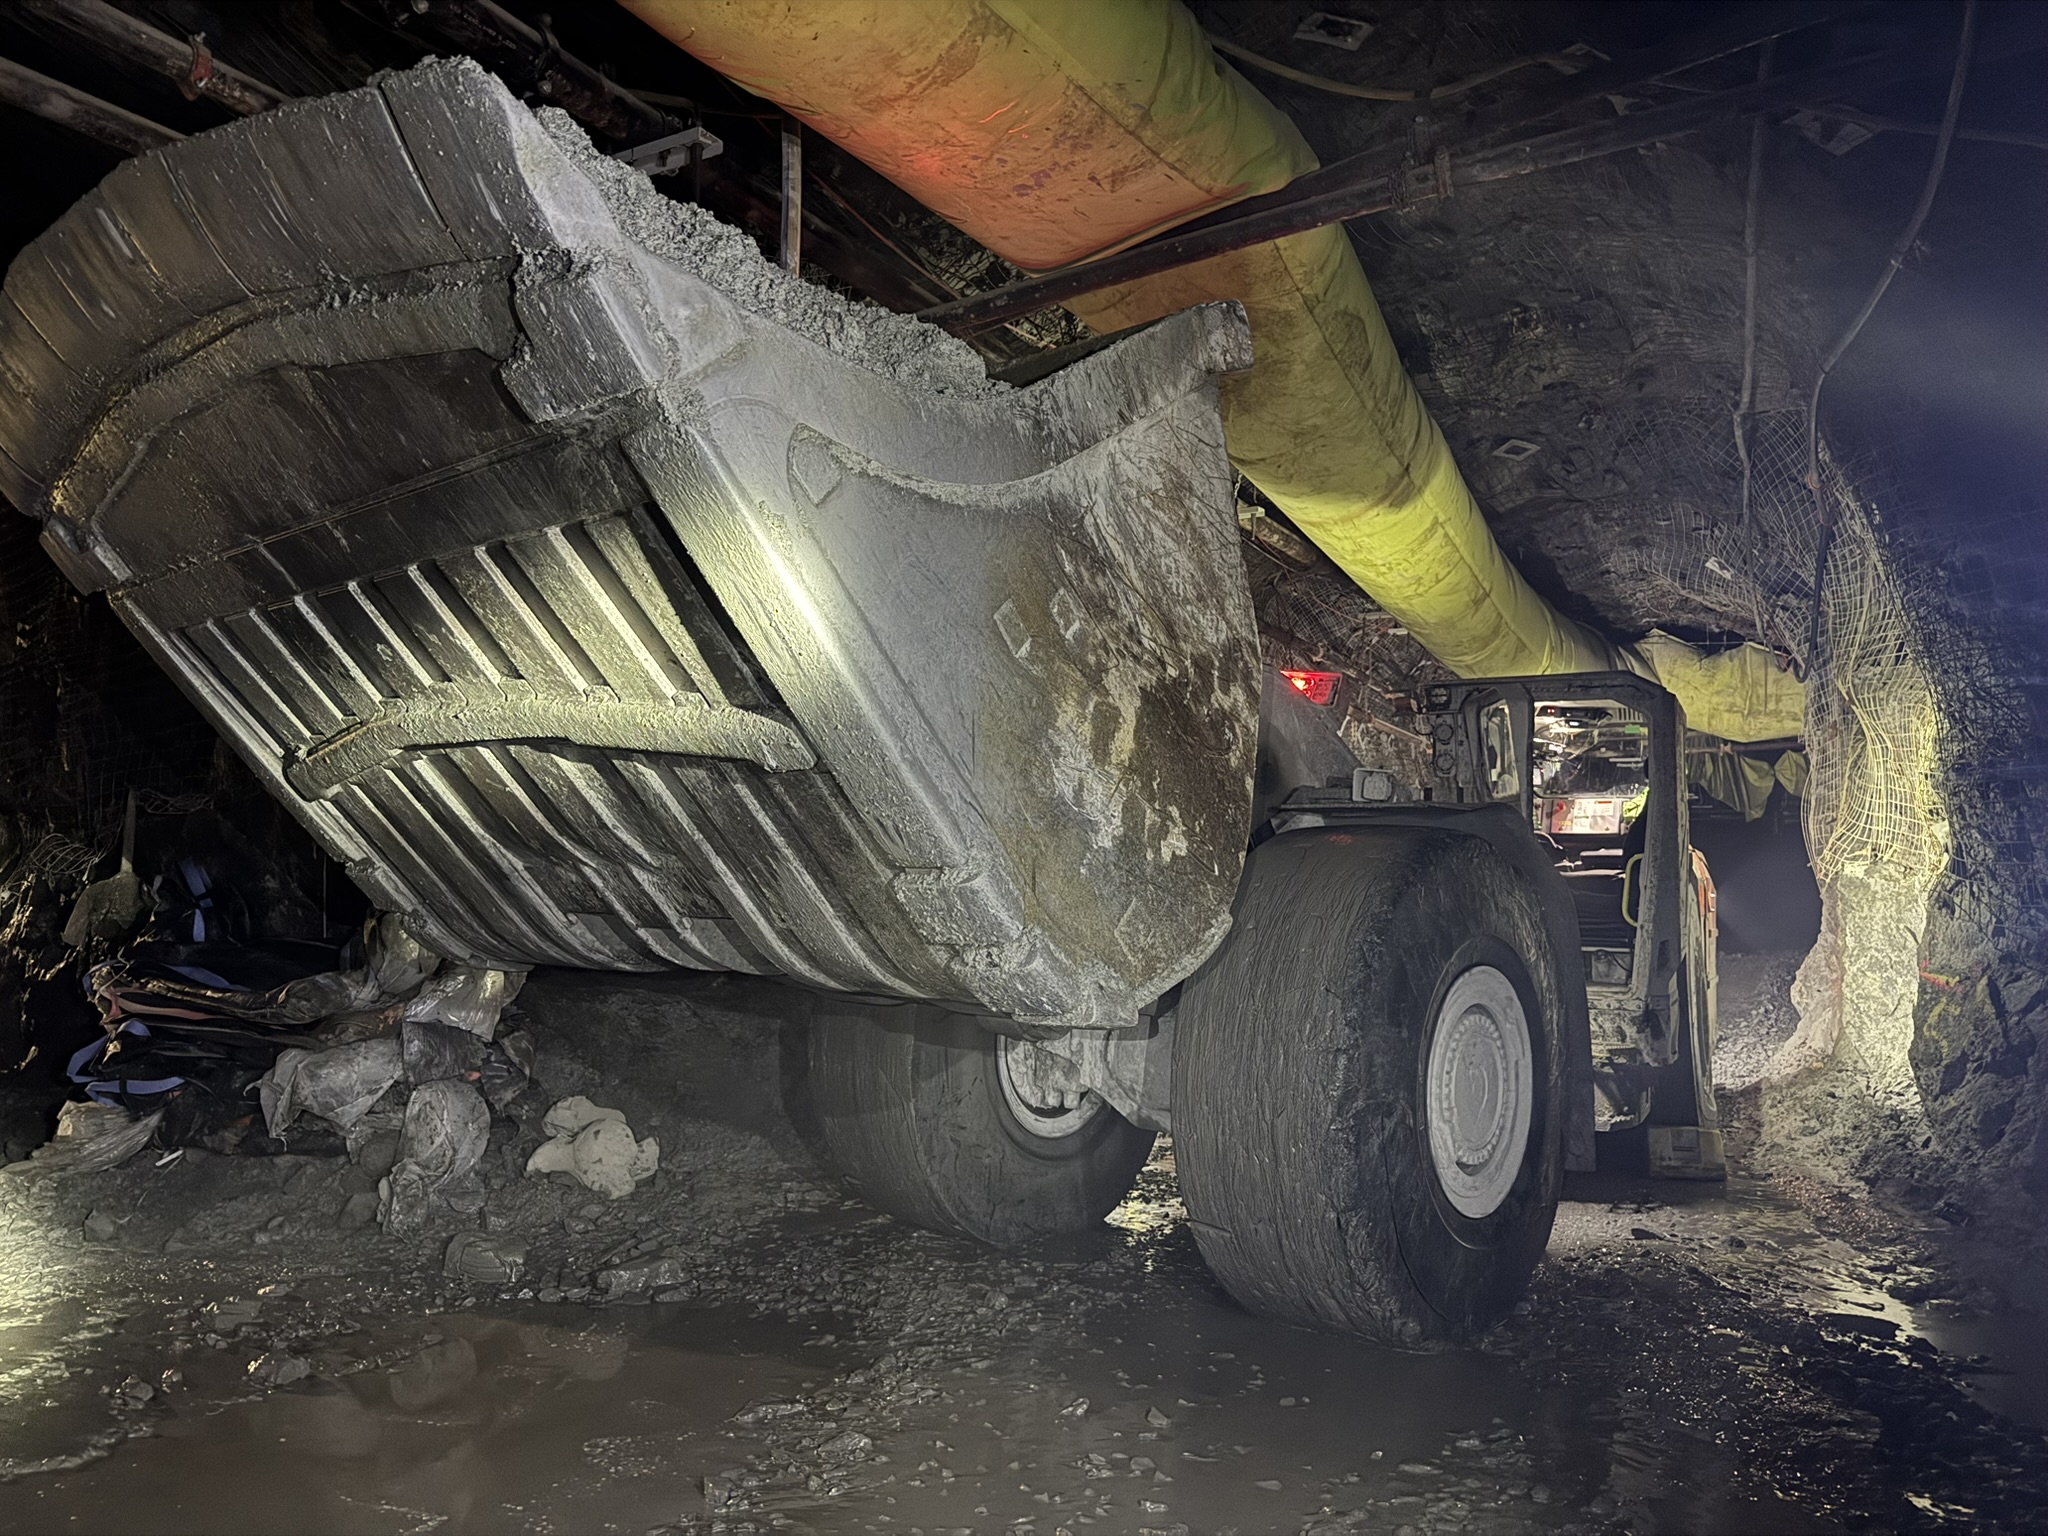
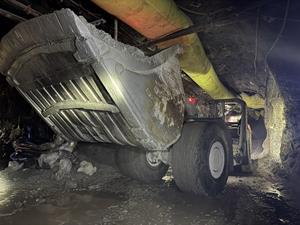
Mucking out a stope
Study Commenced on Processing Expansion, Including Throughput Increase and
The Company has commenced a study to evaluate an expansion of the processing facility, which includes an increase in throughput as well as the incorporation of a silver-lead circuit. The expansion will evaluate a potential increase of processing capacity at
This initial study will assess the technical, economic, environmental and permitting considerations associated with the expansion. Any future development would be subject to completion of the project evaluation, receipt of required permits, Indigenous and Stakeholder engagement, and a positive final investment decision. The Company is targeting commissioning of the silver-lead circuit in 2028 and the expansion in 2030.
Positioned as the
In parallel, core scanning programs will enhance geological modelling and orebody characterization. Airborne and ground geophysical surveys are expected to help refine known deposit footprints and identify new targets across the broader land package.
McIlvenna Bay Multimedia
- Photos of the
McIlvenna Bay site can be viewed and downloaded via this link:
https://eldoradogold.getbynder.com/share/9751B411-8FE0-4543-B224904FFB39B6DC/
| 3 months ended | 6 months ended | ||||||||||||
| 2026 | 2025 | 2026 | 2025 | ||||||||||
| Revenue | |||||||||||||
| Gold produced (oz) | 104,616 | 133,769 | 204,974 | 249,662 | |||||||||
| Gold sold (oz) | 102,691 | 131,489 | 203,310 | 247,752 | |||||||||
| Average realized gold price ($/oz sold)(2) | |||||||||||||
| Production costs | 184.8 | 162.2 | 373.0 | 310.5 | |||||||||
| Total cash costs ($/oz sold)(2,3) | 1,432 | 1,064 | 1,451 | 1,106 | |||||||||
| All-in sustaining costs ($/oz sold)(2,3) | 1,926 | 1,520 | 1,934 | 1,538 | |||||||||
| Net earnings for the period(1) | 172.8 | 138.0 | 309.2 | 210.4 | |||||||||
| Net earnings per share – basic ($/share)(1) | 0.69 | 0.67 | 1.38 | 1.03 | |||||||||
| Net earnings per share – diluted ($/share)(1) | 0.68 | 0.67 | 1.36 | 1.02 | |||||||||
| Net earnings for the period continuing operations(1,4) | 172.8 | 139.0 | 309.2 | 211.0 | |||||||||
| Net earnings per share continuing operations – basic ($/share)(1,4) | 0.69 | 0.68 | 1.38 | 1.03 | |||||||||
| Net earnings per share continuing operations – diluted ($/share)(1,4) | 0.68 | 0.67 | 1.36 | 1.02 | |||||||||
| Adjusted net earnings(1,2,4) | 136.7 | 90.1 | 325.0 | 146.5 | |||||||||
| Adjusted net earnings per share - basic ($/share)(1,2,4) | 0.54 | 0.44 | 1.45 | 0.72 | |||||||||
| Net cash generated from operating activities(4) | 149.5 | 158.2 | 290.9 | 288.6 | |||||||||
| Cash flow from operating activities before changes in working capital(2,4) | 103.1 | 202.0 | 290.2 | 338.5 | |||||||||
| Free cash flow(2,4) | (334.1 | ) | (61.6 | ) | (463.2 | ) | (91.0 | ) | |||||
| Free cash flow excluding Skouries and | 40.9 | 61.5 | 103.8 | 129.4 | |||||||||
| Cash and cash equivalents(4) | 554.6 | 1,078.6 | 554.6 | 1,078.6 | |||||||||
| Total assets | 10,252.2 | 6,303.8 | 10,252.2 | 6,303.8 | |||||||||
| Debt | 1,749.9 | 1,157.1 | 1,749.9 | 1,157.1 | |||||||||
(1) Attributable to shareholders of the Company.
(2) These financial measures or ratios are non-IFRS financial measures or ratios. See the section 'Non-IFRS and Other Financial Measures and Ratios' of our MD&A for explanations and discussions of these non-IFRS financial measures or ratios.
(3) Includes costs allocated to by-products.
(4) 2025 amounts presented are from continuing operations only and exclude the
(5) Amounts presented add back cash-basis capital expenditure on the
In Q2 2026, we produced 104,616 ounces of gold, a decrease from Q2 2025 production of 133,769 ounces. The decrease was driven by decreases at Kisladag, due to the planned lower tonnes and ore grade stacked, and at Efemcukuru, due to lower ore grade and recoveries, partially offset by higher production at Lamaque as a result of higher throughput and recoveries, which includes the positive impact of Ormaque ore following receipt of the operating authorization in March.
Gold sales in Q2 2026 were 102,691 ounces, a decrease from 131,489 ounces sold in Q2 2025. The lower sales volume reflects lower production at Kisladag and Efemcukuru, partially offset by higher production at Lamaque.
The average realized gold price was
Total revenue increased to
Production costs increased to
Production costs include royalty expense, which increased to
Total cash costs(5) averaged
AISC per ounce sold(5) averaged
The Company reported net earnings attributable to shareholders from continuing operations of
Adjusted net earnings(5) was
Adjusted net earnings(5) was
Quarterly Operations Update
| 3 months ended | 6 months ended | |||||||
| 2026 | 2025 | 2026 | 2025 | |||||
| Consolidated | ||||||||
| Gold produced (oz) | 104,616 | 133,769 | 204,974 | 249,662 | ||||
| Gold sold (oz) | 102,691 | 131,489 | 203,310 | 247,752 | ||||
| Production costs | ||||||||
| Total cash costs ($/oz sold)(1,2) | ||||||||
| All-in sustaining costs ($/oz sold)(1,2) | ||||||||
| Sustaining capital expenditures(2) | ||||||||
| Kisladag | ||||||||
| Gold produced (oz) | 19,108 | 46,058 | 47,447 | 90,377 | ||||
| Gold sold (oz) | 19,389 | 45,290 | 47,700 | 89,628 | ||||
| Production costs | ||||||||
| Total cash costs ($/oz sold)(1,2) | ||||||||
| All-in sustaining costs ($/oz sold)(1,2) | ||||||||
| Sustaining capital expenditures(2) | ||||||||
| Lamaque | ||||||||
| Gold produced (oz) | 52,340 | 50,640 | 94,646 | 91,078 | ||||
| Gold sold (oz) | 50,060 | 49,447 | 94,667 | 91,652 | ||||
| Production costs | ||||||||
| Total cash costs ($/oz sold)(1,2) | ||||||||
| All-in sustaining costs ($/oz sold)(1,2) | ||||||||
| Sustaining capital expenditures(2) | ||||||||
| Efemcukuru | ||||||||
| Gold produced (oz) | 18,019 | 21,093 | 33,413 | 40,400 | ||||
| Gold sold (oz) | 18,345 | 20,779 | 33,518 | 38,569 | ||||
| Production costs | ||||||||
| Total cash costs ($/oz sold)(1,2) | ||||||||
| All-in sustaining costs ($/oz sold)(1,2) | ||||||||
| Sustaining capital expenditures(2) | ||||||||
| Olympias | ||||||||
| Gold produced (oz) | 15,125 | 15,978 | 29,444 | 27,807 | ||||
| Gold sold (oz) | 14,897 | 15,973 | 27,425 | 27,903 | ||||
| Production costs | ||||||||
| Total cash costs ($/oz sold)(1,2) | ||||||||
| All-in sustaining costs ($/oz sold)(1,2) | ||||||||
| Sustaining capital expenditures(2) | ||||||||
(1) Includes costs allocated to by-products.
(2) These financial measures or ratios are non-IFRS financial measures or ratios. See the section 'Non-IFRS and Other Financial Measures and Ratios' of our MD&A for explanations and discussions of these non-IFRS financial measures or ratios.
Kisladag
Kisladag produced 19,108 ounces of gold in Q2 2026 compared to 46,058 ounces in Q2 2025, with the decrease due to the planned lower tonnes while the operation continues accelerated waste removal from phase 6 and the western area. Ore grade decreased to 0.40 grams per tonne in Q2 2026 from 0.74 grams per tonne in Q2 2025, which, combined with the lower tonnage, resulted in lower recoverable ounces stacked during the quarter.
Production is expected to increase in the third quarter compared to the second quarter benefitting from increased throughput and grades.
Revenue decreased to
Production costs decreased to
AISC per ounce sold increased to
Sustaining capital expenditures were
Kisladag incurred higher reagent costs as a result of increased water management activities following a period of higher-than-average precipitation that resulted in elevated water levels within site ponds. The Company continues to actively manage water balances across the operation, with a focus on continuing to maximize on-site water capture and reuse in support of its sustainability objectives, and has constructed additional water storage capacity to enhance operational flexibility.
The current higher metal price environment has enabled further optimization of the Kisladag open pit. The Company is evaluating a pit shell based on a higher reserve gold price assumption of
Progress on construction of the whole ore agglomeration circuit, which is expected to increase permeability and reduce leach time, is on track with earthworks well underway and all long-lead items procured. Commissioning and ramp-up are expected in H1 2027.
The geometallurgical study, which characterized future mining phases and evaluated the benefits of additional screening for the high-pressure grinding rolls, has been completed and the financial evaluation is underway. An investment decision on the additional screening is expected to be considered before year-end. Results from the associated drilling program have increased confidence in grade, ore classifications and recovery variability.
Overall, this mine optimization plan is expected to support improved sequencing of ore and waste movement and with implementation of whole ore agglomeration is expected to contribute to more consistent year-over-year operating performance over the longer term.
Lamaque
Lamaque produced 52,340 ounces of gold in Q2 2026, an increase of 3% from 50,640 ounces in Q2 2025. The increase was due to higher throughput, benefiting from strong mill performance and the receipt of the Ormaque operating authorization in March.
Production in the third quarter is expected to be similar to the second quarter.
Revenue increased to
Production costs increased to
AISC per ounce sold was
Sustaining capital expenditures of
Efemcukuru
Efemcukuru produced 18,019 ounces of gold in Q2 2026 compared to 21,093 ounces in Q2 2025. The decrease was primarily due to lower ore grade, which decreased to 4.64 grams per tonne in Q2 2026 from 5.75 grams per tonne in Q2 2025, partially offset by higher mill throughput.
Production in the third quarter is expected to be similar to the second quarter.
Revenue increased to
Production costs increased to
AISC per ounce sold increased to
Sustaining capital expenditures of
Olympias
Olympias produced 15,125 ounces of gold in Q2 2026 compared to 15,978 ounces in Q2 2025, driven by lower gold grades, partially offset by a stable ore blend and flotation performance which resulted in increased metal recoveries.
Production in the third quarter is expected to increase, benefitting from increased throughput over the second quarter.
Revenue increased to
Production costs increased to
AISC per ounce sold increased to
Sustaining capital expenditures of
At Olympias, production has stabilized over the past three quarters, with flotation recoveries returning to modelled levels. Completion of the 650 ktpa expansion is expected by the end of 2026, with ramp-up anticipated in the first quarter of 2027.
For further information on the Company's operating results for the second quarter of 2026, please see the Company’s MD&A filed on SEDAR+ at www.sedarplus.com under the Company’s profile.
Conference Call
A conference call to discuss the details of the Company’s Second Quarter 2026 Results will be held by senior management on
Participants may elect to pre-register for the conference call via this link: https://dpregister.com/sreg/10209854/10438a8dd8a.
Upon registration, participants will receive a calendar invitation by email with dial in details and a unique PIN. This will allow participants to bypass the operator queue and connect directly to the conference. Registration will remain open until the end of the conference call.
| Conference Call Details | Replay (available until | |||
| Date: | +1 412 317 0088 | |||
| Time: | Toll Free: | +1 855 669 9658 | ||
| Dial in: | +1 647 846 2782 | Access code: | 6422557 | |
| Toll free: | +1 833 752 3325 | |||
About Eldorado
Eldorado is a gold, copper and base metals producer with mining, development and exploration operations in
Contact
Investor Relations
647 271 2827 or 1 888 353 8166
lynette.gould@eldoradogold.com
Media
236 885 6251 or 1 888 353 8166
chad.pederson@eldoradogold.com
Non-IFRS and Other Financial Measures and Ratios
Certain non-IFRS financial measures and ratios are included in this news release, including earnings before interest, taxes, depreciation and amortization (“EBITDA”), adjusted earnings before interest, taxes, depreciation and amortization ("Adjusted EBITDA"), adjusted net earnings/(loss) attributable to shareholders, adjusted net earnings/(loss) per share attributable to shareholders, total cash costs and total cash costs per ounce sold, all-in sustaining costs ("AISC") and AISC per ounce sold, sustaining and growth capital, average realized gold price per ounce sold, free cash flow, free cash flow excluding Skouries and
Please see the
We believe that our use of total cash costs per ounce sold and all-in sustaining costs per ounce sold will assist analysts, investors and other stakeholders of the Company in understanding the costs associated with producing gold, assessing our operating performance, and our ability to generate free cash flow from gold operations. Due to the capital-intensive nature of the industry and the long useful lives over which these assets are depreciated, there can be a significant timing difference between net earnings calculated in accordance with IFRS and the amount of free cash flow that is generated by a mine, and therefore we believe these measures are useful non-IFRS operating metrics and supplement our IFRS disclosures. These measures are not representative of all of our cash expenditures as they do not include income tax payments, interest costs or dividend payments. These measures do not include depreciation or amortization. Certain additional disclosures for these and other financial measures and ratios have been incorporated by reference and can be found in the section 'Non-IFRS and Other Financial Measures and Ratios' in the
EBITDA, Adjusted EBITDA
Our reconciliation of EBITDA and Adjusted EBITDA to earnings from continuing operations before income tax, the most directly comparable IFRS measure, is presented below.
| Q2 2026 | Q2 2025 | YTD 2026 | YTD 2025 | |||||||||
| Earnings before income tax(1) | $227.2 | $172.2 | $473.9 | $214.5 | ||||||||
| Depreciation and amortization(2) | 54.7 | 66.4 | 109.1 | 127.0 | ||||||||
| Interest income | (5.4 | ) | (9.0 | ) | (13.1 | ) | (17.2 | ) | ||||
| Finance costs | 10.2 | 0.7 | 24.1 | 12.9 | ||||||||
| EBITDA | $286.6 | $230.3 | $594.1 | $337.2 | ||||||||
| Realized loss on gold and copper derivative instruments | 97.6 | — | 97.6 | — | ||||||||
| Unrealized (gain) loss on derivative instruments | (116.6 | ) | (18.7 | ) | (96.6 | ) | 44.7 | |||||
| Acquisition and integration costs | 13.1 | — | 20.8 | — | ||||||||
| Loss (gain) on disposal of assets | 0.2 | 0.2 | 0.6 | (7.1 | ) | |||||||
| Share of loss from associate | 0.2 | — | 0.4 | — | ||||||||
| Adjusted EBITDA | $281.1 | $211.8 | $616.8 | $374.8 | ||||||||
(1) 2025 amounts presented are from continuing operations only and exclude the
(2) Includes depreciation within general and administrative expenses.
Adjusted Net Earnings Attributable to Shareholders
Our reconciliation of adjusted net earnings (loss) and adjusted net earnings (loss) per share to net earnings (loss) from continuing operations attributable to shareholders of the Company, the most directly comparable IFRS measure, is presented below.
| Q2 2026 | Q2 2025 | YTD 2026 | YTD 2025 | |||||||||
| Net earnings attributable to shareholders of the Company(1) | $172.8 | $139.0 | $309.2 | $211.0 | ||||||||
| Loss (gain) on foreign exchange translation of deferred tax balances | 15.8 | (22.8 | ) | 34.1 | (26.3 | ) | ||||||
| Decrease (increase) in fair value of redemption option derivatives | 1.5 | (7.3 | ) | 7.3 | (7.9 | ) | ||||||
| Realized loss on gold and copper derivative instruments | 97.6 | — | 97.6 | — | ||||||||
| Unrealized (gain) loss on derivative instruments | (116.6 | ) | (18.7 | ) | (96.6 | ) | 44.7 | |||||
| Acquisition and integration costs | 13.1 | — | 20.8 | — | ||||||||
| Gain on deferred tax due to changes in tax rates | (47.4 | ) | — | (47.4 | ) | — | ||||||
| Tax recovery on recognition of deferred tax asset | — | — | — | (73.5 | ) | |||||||
| Discount on sale of marketable securities | — | — | (0.1 | ) | 5.1 | |||||||
| Gain on sale of mining licenses | — | — | — | (6.5 | ) | |||||||
| Share of loss from associate | 0.2 | — | 0.4 | — | ||||||||
| Tax effect on adjustments | (0.2 | ) | — | (0.2 | ) | — | ||||||
| Total adjusted net earnings | $136.7 | $90.1 | $325.0 | $146.5 | ||||||||
| Weighted average shares outstanding (thousands) | 251,453 | 204,907 | 224,741 | 204,835 | ||||||||
| Adjusted net earnings per share ($/share) | $0.54 | $0.44 | $1.45 | $0.72 | ||||||||
(1) 2025 amounts presented are from continuing operations only and exclude the
Reconciliation of Total Cash Costs, Total Cash Cost per Ounce Sold, AISC, and AISC per Ounce Sold to Production Costs
Our reconciliation of total cash costs, total cash costs per ounce sold, AISC, and AISC per Ounce Sold to production costs, the most directly comparable IFRS measure, is presented below.
For the three months ended
| Kisladag | Lamaque | Efemcukuru | Olympias | Corporate(3) | Total | ||||||||||||
| Direct operating costs | $— | $159.6 | |||||||||||||||
| Transportation and selling costs | 0.2 | 0.1 | 3.2 | 3.1 | — | ||||||||||||
| Inventory change(1) | (17.2 | ) | (1.3 | ) | 0.2 | 3.0 | — | ( | ) | ||||||||
| Royalty expense | 7.5 | 3.0 | 12.3 | 11.0 | — | ||||||||||||
| Production costs | $41.6 | $44.2 | $38.7 | $60.3 | $— | $184.8 | |||||||||||
| Costs allocated to by-products | (1.8 | ) | (0.9 | ) | (3.3 | ) | (33.3 | ) | — | ( | ) | ||||||
| Treatment and refining costs(2) | — | — | — | 1.7 | — | ||||||||||||
| Total cash costs | $39.7 | $43.3 | $35.3 | $28.7 | $— | $147.0 | |||||||||||
| Corporate & allocated G&A | — | — | — | — | 13.4 | ||||||||||||
| Exploration costs | — | 0.1 | — | — | — | ||||||||||||
| Reclamation costs and amortization | 1.3 | 0.2 | 0.3 | 0.4 | — | ||||||||||||
| Sustaining capital | 5.6 | 16.1 | 5.7 | 7.6 | — | ||||||||||||
| All-in sustaining costs | $46.7 | $59.7 | $41.3 | $36.7 | $13.4 | $197.8 | |||||||||||
| Gold oz sold | 19,389 | 50,060 | 18,345 | 14,897 | — | 102,691 | |||||||||||
| Total cash costs/oz | $2,050 | $865 | $1,926 | $1,923 | $— | $1,432 | |||||||||||
| AISC/oz | $2,407 | $1,192 | $2,252 | $2,465 | $130 | $1,926 | |||||||||||
(1) Inventory change adjustments result from timing differences between when inventory is produced and when it is sold.
(2) Included in revenue.
(3) Excludes general and administrative expenses related to business development activities and projects. Includes share based payments expense and defined benefit pension plan expense. AISC per ounce sold has been calculated using total consolidated gold ounces sold.
For the six months ended
| Kisladag | Lamaque | Efemcukuru | Olympias | Corporate(3) | Total | ||||||||||||
| Direct operating costs | $— | $296.8 | |||||||||||||||
| Transportation and selling costs | 0.3 | 0.2 | 6.0 | 5.6 | — | ||||||||||||
| Inventory change(1) | (20.3 | ) | (0.3 | ) | — | 0.6 | — | ( | ) | ||||||||
| Royalty expense | 27.9 | 5.6 | 26.6 | 23.8 | — | ||||||||||||
| Production costs | $98.3 | $86.0 | $76.3 | $112.4 | $— | $373.0 | |||||||||||
| Costs allocated to by-products | (4.9 | ) | (2.3 | ) | (7.5 | ) | (65.3 | ) | — | ( | ) | ||||||
| Treatment and refining costs(2) | — | — | — | 2.0 | — | ||||||||||||
| Total cash costs | $93.4 | $83.7 | $68.8 | $49.0 | $— | $294.9 | |||||||||||
| Corporate & allocated G&A | — | — | — | — | 25.5 | ||||||||||||
| Exploration costs | — | 0.5 | — | — | — | ||||||||||||
| Reclamation costs and amortization | 2.5 | 0.4 | 0.6 | 0.9 | — | ||||||||||||
| Sustaining capital | 9.0 | 36.3 | 10.3 | 12.2 | — | ||||||||||||
| All-in sustaining costs | $105.0 | $120.8 | $79.7 | $62.2 | $25.5 | $393.2 | |||||||||||
| Gold oz sold | 47,700 | 94,667 | 33,518 | 27,425 | — | 203,310 | |||||||||||
| Total cash costs/oz | $1,958 | $884 | $2,053 | $1,788 | $— | $1,451 | |||||||||||
| AISC/oz | $2,201 | $1,276 | $2,377 | $2,267 | $125 | $1,934 | |||||||||||
(1) Inventory change adjustments result from timing differences between when inventory is produced and when it is sold.
(2) Included in revenue.
(3) Excludes general and administrative expenses related to business development activities and projects. Includes share based payments expense and defined benefit pension plan expense. AISC per ounce sold has been calculated using total consolidated gold ounces sold.
For the three months ended
| Kisladag | Lamaque | Efemcukuru | Olympias | Corporate(3) | Total | ||||||||||||
| Direct operating costs | $— | $134.5 | |||||||||||||||
| Transportation and selling costs | 0.3 | 0.1 | 2.7 | 2.3 | — | ||||||||||||
| Inventory change(1) | (1.8 | ) | (1.4 | ) | (0.3 | ) | (3.0 | ) | — | ( | ) | ||||||
| Royalty expense | 13.3 | 1.9 | 6.5 | 6.9 | — | ||||||||||||
| Production costs | $52.7 | $36.1 | $28.5 | $44.8 | $— | $162.2 | |||||||||||
| Costs allocated to by-products | (1.4 | ) | (0.5 | ) | (1.8 | ) | (21.4 | ) | — | ( | ) | ||||||
| Treatment and refining costs(2) | — | — | 1.0 | 1.8 | — | ||||||||||||
| Total cash costs | $51.3 | $35.6 | $27.7 | $25.2 | $— | $139.9 | |||||||||||
| Corporate & allocated G&A | 0.4 | — | 0.3 | — | 13.0 | ||||||||||||
| Exploration costs | — | (0.2 | ) | — | — | — | ( | ) | |||||||||
| Reclamation costs and amortization | 1.8 | 0.1 | 0.2 | 0.4 | — | ||||||||||||
| Sustaining capital | 6.5 | 25.4 | 6.4 | 5.8 | — | ||||||||||||
| All-in sustaining costs | $60.0 | $60.9 | $34.6 | $31.4 | $13.0 | $199.9 | |||||||||||
| Gold oz sold | 45,290 | 49,447 | 20,779 | 15,973 | — | 131,489 | |||||||||||
| Total cash costs/oz | $1,133 | $721 | $1,335 | $1,578 | $— | $1,064 | |||||||||||
| AISC/oz | $1,324 | $1,231 | $1,667 | $1,967 | $99 | $1,520 | |||||||||||
(1) Inventory change adjustments result from timing differences between when inventory is produced and when it is sold.
(2) Included in revenue.
(3) Excludes general and administrative expenses related to business development activities and projects. Includes share based payments expense and defined benefit pension plan expense. AISC per ounce sold has been calculated using total consolidated gold ounces sold.
For the six months ended
| Kisladag | Lamaque | Efemcukuru | Olympias | Corporate(3) | Total | ||||||||||||
| Direct operating costs | $— | $260.2 | |||||||||||||||
| Transportation and selling costs | 0.4 | 0.2 | 5.4 | 4.2 | — | ||||||||||||
| Inventory change(1) | (7.0 | ) | 1.5 | (1.7 | ) | (3.6 | ) | — | ( | ) | |||||||
| Royalty expense | 23.9 | 3.3 | 12.2 | 11.5 | — | ||||||||||||
| Production costs | $100.2 | $71.9 | $53.2 | $85.1 | $— | $310.5 | |||||||||||
| Costs allocated to by-products | (2.9 | ) | (0.9 | ) | (3.3 | ) | (34.3 | ) | — | ( | ) | ||||||
| Treatment and refining costs(2) | — | — | 1.9 | 3.0 | — | ||||||||||||
| Total cash costs | $97.4 | $70.9 | $51.9 | $53.8 | $— | $274.0 | |||||||||||
| Corporate & allocated G&A | 0.7 | — | 0.7 | — | 23.5 | ||||||||||||
| Exploration costs | — | 0.4 | — | — | — | ||||||||||||
| Reclamation costs and amortization | 3.6 | 0.2 | 0.3 | 0.8 | — | ||||||||||||
| Sustaining capital | 8.8 | 48.1 | 9.4 | 10.7 | — | ||||||||||||
| All-in sustaining costs | $110.4 | $119.6 | $62.2 | $65.3 | $381.1 | ||||||||||||
| Gold oz sold | 89,628 | 91,652 | 38,569 | 27,903 | — | 247,752 | |||||||||||
| Total cash costs/oz | $1,086 | $774 | $1,345 | $1,929 | $— | $1,106 | |||||||||||
| AISC/oz | $1,232 | $1,305 | $1,613 | $2,341 | $1,538 | ||||||||||||
(1) Inventory change adjustments result from timing differences between when inventory is produced and when it is sold.
(2) Included in revenue.
(3) Excludes general and administrative expenses related to business development activities and projects. Includes share based payments expense and defined benefit pension plan expense. AISC per ounce sold has been calculated using total consolidated gold ounces sold.
Reconciliations of adjustments within AISC to the most directly comparable IFRS measures are presented below.
Reconciliation of general and administrative expenses included in All-in Sustaining Costs:
| Q2 2026 | Q2 2025 | YTD 2026 | YTD 2025 | |||||||||
| General and administrative expenses (from consolidated statement of operations) | $12.1 | $10.6 | $23.3 | $18.7 | ||||||||
| Add: | ||||||||||||
| Share-based payments expense | 2.8 | 4.2 | 6.4 | 8.5 | ||||||||
| Less: | ||||||||||||
| Integration costs | (1.1 | ) | — | (1.1 | ) | — | ||||||
| Depreciation in general and administrative expenses | (0.5 | ) | (0.5 | ) | (0.9 | ) | (0.9 | ) | ||||
| Business development | 0.5 | (0.2 | ) | (1.1 | ) | (0.5 | ) | |||||
| Development projects | (0.6 | ) | (0.4 | ) | (1.1 | ) | (0.9 | ) | ||||
| Corporate and allocated general and administrative expenses per AISC | $13.4 | $13.7 | $25.5 | $24.9 | ||||||||
Reconciliation of exploration and evaluation costs included in All-in Sustaining Costs:
| Q2 2026 | Q2 2025 | YTD 2026 | YTD 2025 | |||||||||
| Exploration and evaluation expense (from consolidated statement of operations)(1) | $15.0 | $7.3 | $24.3 | $14.2 | ||||||||
| Add: | ||||||||||||
| Capitalized exploration cost related to operating gold mines | 0.1 | (0.2 | ) | 0.5 | 0.4 | |||||||
| Less: | ||||||||||||
| Exploration and evaluation expenses related to non-gold mines and other sites | (15.0 | ) | (7.3 | ) | (24.3 | ) | (14.2 | ) | ||||
| Exploration and evaluation costs per AISC | $0.1 | ($0.2 | ) | $0.5 | $0.4 | |||||||
(1) 2025 amounts presented are from continuing operations only and exclude the
Reconciliation of reclamation costs and amortization included in All-in Sustaining Costs:
| Q2 2026 | Q2 2025 | YTD 2026 | YTD 2025 | |||||||||
| Asset retirement obligation accretion (from notes to the consolidated financial statements)(1) | $1.5 | $1.5 | $3.0 | $3.0 | ||||||||
| Add: | ||||||||||||
| Depreciation related to asset retirement obligation assets | 1.0 | 1.2 | 1.9 | 2.4 | ||||||||
| Less: | ||||||||||||
| Asset retirement obligation accretion related to non-gold mines and other sites | (0.2 | ) | (0.2 | ) | (0.5 | ) | (0.5 | ) | ||||
| Reclamation costs and amortization per AISC | $2.3 | $2.5 | $4.4 | $4.9 | ||||||||
(1) 2025 amounts presented are from continuing operations only and exclude the
Sustaining and Growth Capital
Our reconciliation of growth capital investment and sustaining capital expenditure at operating gold mines to additions to property, plant and equipment, the most directly comparable IFRS measure, is presented below.
| Q2 2026 | Q2 2025 | YTD 2026 | YTD 2025 | |||||||||
| Additions to property, plant and equipment (from segment note in the consolidated financial statements)(1) | $441.3 | $240.9 | $759.3 | $414.1 | ||||||||
| Growth and development project capital investment - gold mines | (93.2 | ) | (47.0 | ) | (185.6 | ) | (85.7 | ) | ||||
| Growth and development project capital investment - other | (308.9 | ) | (148.8 | ) | (499.1 | ) | (248.5 | ) | ||||
| Sustaining capital exploration | (0.1 | ) | 0.2 | (0.5 | ) | (0.4 | ) | |||||
| Sustaining capitalized depreciation | (3.4 | ) | — | (6.1 | ) | — | ||||||
| Sustaining leases | (0.7 | ) | (1.2 | ) | (0.2 | ) | (2.5 | ) | ||||
| Sustaining capital expenditure at operating gold mines | $35.0 | $44.1 | $67.9 | $76.9 | ||||||||
(1) 2025 amounts presented are from continuing operations only and exclude the
Average Realized Gold Price per Ounce Sold
Our reconciliation of average realized gold price per ounce sold to revenue, the most directly comparable IFRS measure, is presented below.
For the three months ended
| Revenue | Add concentrate deductions(1) | Less non-gold revenue | Gold revenue(2) | Gold oz sold | Average realized gold price per ounce sold | |||||||
| Kisladag | $— | ( | ) | 19,389 | ||||||||
| Lamaque | 223.4 | — | (0.9 | ) | 222.5 | 50,060 | 4,445 | |||||
| Efemcukuru | 76.8 | — | (3.3 | ) | 73.4 | 18,345 | 4,003 | |||||
| Olympias | 98.6 | 1.7 | (33.3 | ) | 67.0 | 14,897 | 4,494 | |||||
| Total consolidated | $487.5 | $1.7 | ($39.4 | ) | $449.7 | 102,691 | $4,379 | |||||
(1) Treatment charges, refining charges, penalties and other costs deducted from proceeds from gold concentrate sales.
(2) Includes the impact of provisional pricing adjustments on concentrate sales.
For the six months ended
| Revenue | Add concentrate deductions(1) | Less non-gold revenue | Gold revenue(2) | Gold oz sold | Average realized gold price per ounce sold | |||||||
| Kisladag | $— | ( | ) | 47,700 | ||||||||
| Lamaque | 443.0 | — | (2.3 | ) | 440.7 | 94,667 | 4,655 | |||||
| Efemcukuru | 155.4 | — | (7.5 | ) | 147.9 | 33,518 | 4,413 | |||||
| Olympias | 187.1 | 2.0 | (65.3 | ) | 123.8 | 27,425 | 4,513 | |||||
| Total consolidated | $1,019.9 | $2.0 | ($80.0 | ) | $941.8 | 203,310 | $4,632 | |||||
(1) Treatment charges, refining charges, penalties and other costs deducted from proceeds from gold concentrate sales.
(2) Includes the impact of provisional pricing adjustments on concentrate sales.
For the three months ended
| Revenue | Add concentrate deductions(1) | Less non-gold revenue | Gold revenue(2) | Gold oz sold | Average realized gold price per ounce sold | |||||||
| Kisladag | $— | ( | ) | 45,290 | ||||||||
| Lamaque | 164.8 | — | (0.5 | ) | 164.3 | 49,447 | 3,323 | |||||
| Efemcukuru | 70.7 | 1.0 | (1.8 | ) | 69.9 | 20,779 | 3,364 | |||||
| Olympias | 65.9 | 1.8 | (20.8 | ) | 46.8 | 15,973 | 2,932 | |||||
| Total consolidated | $451.7 | $2.8 | ($24.5 | ) | $430.0 | 131,489 | $3,270 | |||||
(1) Treatment charges, refining charges, penalties and other costs deducted from proceeds from gold concentrate sales.
(2) Includes the impact of provisional pricing adjustments on concentrate sales.
For the six months ended
| Revenue | Add concentrate deductions(1) | Less non-gold revenue | Gold revenue(2) | Gold oz sold | Average realized gold price per ounce sold | |||||||
| Kisladag | $— | ( | ) | 89,628 | ||||||||
| Lamaque | 286.8 | — | (0.9 | ) | 285.9 | 91,652 | 3,119 | |||||
| Efemcukuru | 128.2 | 1.9 | (3.3 | ) | 126.8 | 38,569 | 3,287 | |||||
| Olympias | 112.4 | 3.0 | (33.7 | ) | 81.6 | 27,903 | 2,926 | |||||
| Total consolidated | $807.0 | $4.9 | ($40.8 | ) | $771.1 | 247,752 | $3,112 | |||||
(1) Treatment charges, refining charges, penalties and other costs deducted from proceeds from gold concentrate sales.
(2) Includes the impact of provisional pricing adjustments on concentrate sales.
Free Cash Flow and Free Cash Flow Excluding Skouries and
Our reconciliations of free cash flow and free cash flow excluding Skouries and
| Q2 2026 | Q2 2025 | YTD 2026 | YTD 2025 | |||||||||
| Net cash generated from operating activities(1) | $149.5 | $158.2 | $290.9 | $288.6 | ||||||||
| Less: Cash used in investing activities | (361.1 | ) | (217.2 | ) | (591.4 | ) | (222.0 | ) | ||||
| Less: Proceeds from sale of mining licenses | (2.0 | ) | (2.5 | ) | (2.0 | ) | (2.5 | ) | ||||
| Add (less): Purchase (proceeds from sale) of marketable securities | 3.1 | — | (37.1 | ) | (155.1 | ) | ||||||
| Less: Cash received from acquisition of subsidiary | (159.1 | ) | — | (159.1 | ) | — | ||||||
| Add: Acquisition and integration costs | 20.8 | — | 20.8 | — | ||||||||
| Add: Purchase of investment in associate | 14.7 | — | 14.7 | — | ||||||||
| Free cash flow | ($334.1 | ) | ($61.6 | ) | ($463.2 | ) | ($91.0 | ) | ||||
| Add: Skouries cash capital expenditures | 233.1 | 112.1 | 416.7 | 200.3 | ||||||||
| Add: | 119.2 | — | 119.2 | — | ||||||||
| Add: Capitalized interest paid(2) | 22.6 | 10.9 | 31.1 | 20.0 | ||||||||
| Free cash flow excluding Skouries and | $40.9 | $61.5 | $103.8 | $129.4 | ||||||||
(1) 2025 amounts presented are from continuing operations only and exclude the
(2) Includes interest from the Senior Notes, the Term Facility and the Sprott Credit Facility.
Cash Flow from Operating Activities before Changes in Working Capital
Our reconciliation of cash flow from operating activities before changes in working capital to net cash generated from operating activities from continuing operations, the most directly comparable IFRS measure, is presented below.
| Q2 2026 | Q2 2025 | YTD 2026 | YTD 2025 | |||||||
| Net cash generated from operating activities(1) | $ | 149.5 | $ | 158.2 | $ | 290.9 | $ | 288.6 | ||
| (Less) add: Changes in non-cash working capital | (46.4 | ) | 43.8 | (0.7 | ) | 49.9 | ||||
| Cash flow from operating activities before changes in workingcapital | $ | 103.1 | $ | 202.0 | $ | 290.2 | $ | 338.5 | ||
(1) 2025 amounts presented are from continuing operations only and exclude the
Forward-looking Statements and Information
Certain of the statements made and information provided in this news release are forward-looking statements or information within the meaning of the United States Private Securities Litigation Reform Act of 1995 and applicable Canadian securities laws. Often, these forward-looking statements and forward-looking information can be identified by the use of words such as “anticipate”, “believe”, “budget”, “continue”, “commitment”, “confident”, “estimate”, “expect”, "focus", “forecast”, “foresee”, “future”, “goal”, “guidance”, “intend”, “opportunity”, “outlook”, “plan”, “potential”, “project”, “prospective”, “schedule”, “strive”, “target”, “underway”, "working" or the negatives thereof or variations of such words and phrases or similar words or statements that certain actions, events or results “can”, “could”, "likely", "may", “might”, “will” or "would" be taken, occur or be achieved.
Forward-looking statements or information contained in this news release include, but is not limited to, statements or information with respect to: the Company’s 2026 annual production guidance (both for the Company and by material property) and relative production through the year; cost guidance (including expected total cash costs and average AISC); expected changes to Eldorado's management team and Board and the timing in relation thereto; the payment of regular quarterly dividends under our dividend program, including the third quarter dividend payable date; expected mine life; with respect to Skouries: our expectation of first concentrate production in Q3 and commercial production in Q4 2026; our expectations that we are in the final process with other counterparties to conclude concentrate agreements covering production through 2029; projected gold production and copper production; expected project capital and accelerated operational capital and the timing thereof; our belief that we are well positioned for start up, including our expectations of our ore stockpile to provide the ore feed required through 2026 and support a lower-risk commissioning and first year of production; our expectation that open pit and underground ore mining will continue for the balance of 2026 and will be blended to maximize cash flow with lower value ore being stockpiled for future years; expected progress on construction activities and commissioning activities; expected timing and development of test stopes; expected total workforce and our expectation of labour resources; and expected completion of job familiarization training at both the Skouries and Olympias sites; with respect to Kisladag: our evaluation of a pit shell and expected benefits thereof, and our expectation of increased waste stripping; our expectations and progress of the whole ore agglomeration circuit, including expectations to increase permeability and reduce leach time; expected timing of commissioning and ramp-up; expectations of an investment decision on the additional screening from the geometallurgical study and timing thereof; and our expectations of the mine optimization plan; with respect to Olympias: expected completion of the 650 ktpa expansion by the end of 2026 and anticipated ramp-up in the first quarter of 2027; with respect to
Forward-looking statements and forward-looking information by their nature are based on a number of assumptions that management considers reasonable. However, if such assumptions prove to be inaccurate, then actual results, activities, performance, or achievements may be materially different from those described in the forward-looking statements or information. These include assumptions concerning, among other things: timing, costs and results of our construction and development activities, improvements and exploration, including at the
More specifically, with respect to the
In addition, except where otherwise stated, we have assumed a continuation of existing business operations on substantially the same basis as exists at the time of this news release. Even though we believe that the assumptions and expectations represented by such statements or information are reasonable, there can be no assurance that the forward-looking statements or information will prove to be accurate. Many assumptions may be difficult to predict and are beyond our control.
Forward-looking statements or information contained in this news release are subject to a variety of known and unknown risks, uncertainties and other factors which could cause actual events or results to differ from those expressed or implied by the forward-looking statements or information, including, but not limited to: commodity price risk; construction and development risks at the
With respect to the
The inclusion of forward-looking statements and information is designed to help you understand management’s current views of our near- and longer-term prospects, and it may not be appropriate for other purposes. There can be no assurance that forward-looking statements or information will prove to be accurate, as actual results and future events could differ materially from those anticipated in such statements. Except as required by law, we do not expect to update forward-looking statements and information continually as conditions change and you are referred to the full discussion of the Company’s business contained in the Company’s reports filed with the securities regulatory authorities in
Qualified Persons and Disclosure of Mineral Resources
Except as otherwise noted,
Mineral resources that are not mineral reserves do not have demonstrated economic viability. Inferred mineral resources are considered too speculative geologically to have the economic considerations applied to them that would enable them to be categorized as mineral reserves.
Condensed Consolidated Interim Statements of Financial Position | |||||||||
| As at (Unaudited – in thousands of | |||||||||
| Note | |||||||||
| ASSETS | |||||||||
| Current assets | |||||||||
| Cash and cash equivalents | $ | 554,562 | $ | 869,356 | |||||
| Accounts receivable and other | 5 | 207,797 | 279,212 | ||||||
| Inventories | 6 | 415,636 | 297,165 | ||||||
| Current derivative assets | 17 | 1,356 | 2,051 | ||||||
| 1,179,351 | 1,447,784 | ||||||||
| Deferred tax assets | 48,167 | 37,076 | |||||||
| Other assets | 7 | 104,514 | 144,479 | ||||||
| Investment in associate | 123,799 | 109,423 | |||||||
| Non-current derivative assets | 17 | 5,970 | 10,380 | ||||||
| Property, plant and equipment | 8,251,616 | 4,885,564 | |||||||
| 4 | 538,772 | 92,591 | |||||||
| $ | 10,252,189 | $ | 6,727,297 | ||||||
| LIABILITIES & EQUITY | |||||||||
| Current liabilities | |||||||||
| Accounts payable and accrued liabilities | $ | 651,735 | $ | 630,310 | |||||
| Current portion of lease liabilities | 5,372 | 6,024 | |||||||
| Current portion of debt | 8 | 231,749 | 47,968 | ||||||
| Current portion of asset retirement obligation | 6,610 | 7,886 | |||||||
| Current derivative liabilities | 17 | 2,502 | 96,879 | ||||||
| 897,968 | 789,067 | ||||||||
| Debt | 8 | 1,518,164 | 1,227,084 | ||||||
| Lease liabilities | 7,850 | 8,575 | |||||||
| Employee benefit plan obligations | 14,595 | 13,747 | |||||||
| Asset retirement obligations | 144,287 | 135,071 | |||||||
| Non-current derivative liabilities | 17 | 8,669 | 16,254 | ||||||
| Deferred income tax liabilities | 796,229 | 254,420 | |||||||
| 3,387,762 | 2,444,218 | ||||||||
| Equity | |||||||||
| Share capital | 13 | 5,695,878 | 3,341,760 | ||||||
| Shares held in trust for restricted share units | 13 | (19,087 | ) | (16,035 | ) | ||||
| Contributed surplus | 2,493,742 | 2,537,197 | |||||||
| Accumulated other comprehensive loss | (31,302 | ) | (11,553 | ) | |||||
| Deficit | (1,277,628 | ) | (1,572,080 | ) | |||||
| Total equity attributable to shareholders of the Company | 6,861,603 | 4,279,289 | |||||||
| Attributable to non-controlling interests | 2,824 | 3,790 | |||||||
| 6,864,427 | 4,283,079 | ||||||||
| $ | 10,252,189 | $ | 6,727,297 | ||||||
Commitments and contractual obligations (Note 16)
Events after the reporting date (Note 13(b))
Approved on behalf of the Board of Directors
(signed)
Date of approval:
Condensed Consolidated Interim Statements of Operations | |||||||||||||||||
| For the three and six months ended (Unaudited – in thousands of | |||||||||||||||||
| Three months ended | Six months ended | ||||||||||||||||
| Note | 2026 | 2025 | 2026 | 2025 | |||||||||||||
| Revenue | |||||||||||||||||
| Metal sales | 9 | $ | 487,456 | $ | 451,724 | $ | 1,019,884 | $ | 806,969 | ||||||||
| Cost of sales | |||||||||||||||||
| Production costs | 184,788 | 162,158 | 373,001 | 310,469 | |||||||||||||
| Depreciation and amortization | 54,243 | 65,963 | 108,237 | 126,132 | |||||||||||||
| 239,031 | 228,121 | 481,238 | 436,601 | ||||||||||||||
| Earnings from mine operations | 248,425 | 223,603 | 538,646 | 370,368 | |||||||||||||
| Exploration and evaluation expenses | 14,983 | 7,253 | 24,292 | 14,243 | |||||||||||||
| Mine standby costs | 6,050 | 4,656 | 10,764 | 8,787 | |||||||||||||
| General and administrative expenses | 12,121 | 10,608 | 23,285 | 18,688 | |||||||||||||
| Share-based payments expense | 14 | 2,827 | 4,183 | 6,434 | 8,545 | ||||||||||||
| Write-down of assets | 614 | 2,476 | 1,103 | 5,165 | |||||||||||||
| Foreign exchange (gain) loss | (13,866 | ) | 18,524 | (34,233 | ) | 24,808 | |||||||||||
| Acquisition costs | 4 | 11,470 | — | 19,164 | — | ||||||||||||
| Earnings from operations | 214,226 | 175,903 | 487,837 | 290,132 | |||||||||||||
| Other income (expense) | 10 | 23,111 | (3,012 | ) | 10,208 | (62,739 | ) | ||||||||||
| Finance costs | 11 | (10,166 | ) | (669 | ) | (24,129 | ) | (12,913 | ) | ||||||||
| Earnings from continuing operations before income tax | 227,171 | 172,222 | 473,916 | 214,480 | |||||||||||||
| Income tax expense | 12 | 54,502 | 33,295 | 165,509 | 687 | ||||||||||||
| Net earnings from continuing operations | 172,669 | 138,927 | 308,407 | 213,793 | |||||||||||||
| Net loss from discontinued operations, net of tax | — | (4,123 | ) | — | (5,456 | ) | |||||||||||
| Net earnings for the period | $ | 172,669 | $ | 134,804 | $ | 308,407 | $ | 208,337 | |||||||||
| Net earnings (loss) attributable to: | |||||||||||||||||
| Shareholders of the Company | 172,817 | 138,009 | 309,196 | 210,411 | |||||||||||||
| Non-controlling interests | (148 | ) | (3,205 | ) | (789 | ) | (2,074 | ) | |||||||||
| Net earnings for the period | $ | 172,669 | $ | 134,804 | $ | 308,407 | $ | 208,337 | |||||||||
| Net earnings (loss) attributable to shareholders of the Company: | |||||||||||||||||
| Continuing operations | 172,817 | 138,999 | 309,196 | 210,982 | |||||||||||||
| Discontinued operations | — | (990 | ) | — | (571 | ) | |||||||||||
| $ | 172,817 | $ | 138,009 | $ | 309,196 | $ | 210,411 | ||||||||||
| Net (loss) earnings attributable to non-controlling interests: | |||||||||||||||||
| Continuing operations | (148 | ) | (72 | ) | (789 | ) | 2,811 | ||||||||||
| Discontinued operations | — | (3,133 | ) | — | (4,885 | ) | |||||||||||
| $ | (148 | ) | $ | (3,205 | ) | $ | (789 | ) | $ | (2,074 | ) | ||||||
| Weighted average number of shares outstanding: | |||||||||||||||||
| Basic | 13 | 251,453,420 | 204,906,884 | 224,740,512 | 204,834,871 | ||||||||||||
| Diluted | 13 | 253,972,129 | 206,960,823 | 227,547,127 | 206,734,858 | ||||||||||||
| Net earnings per share attributable to shareholders of the Company: | |||||||||||||||||
| Basic earnings per share | $ | 0.69 | $ | 0.67 | $ | 1.38 | $ | 1.03 | |||||||||
| Diluted earnings per share | $ | 0.68 | $ | 0.67 | $ | 1.36 | $ | 1.02 | |||||||||
| Net earnings per share attributable to shareholders of the Company - Continuing operations: | |||||||||||||||||
| Basic earnings per share | $ | 0.69 | $ | 0.68 | $ | 1.38 | $ | 1.03 | |||||||||
| Diluted earnings per share | $ | 0.68 | $ | 0.67 | $ | 1.36 | $ | 1.02 | |||||||||
Condensed Consolidated Interim Statements of Comprehensive Income | |||||||||||||||||
| For the three and six months ended (Unaudited – in thousands of | |||||||||||||||||
| Three months ended | Six months ended | ||||||||||||||||
| 2026 | 2025 | 2026 | 2025 | ||||||||||||||
| Net earnings for the period | $ | 172,669 | $ | 134,804 | $ | 308,407 | $ | 208,337 | |||||||||
| Other comprehensive (loss) income: | |||||||||||||||||
| Items that will not be reclassified to earnings or loss: | |||||||||||||||||
| Change in fair value of investments in marketable securities | (85 | ) | 7,418 | 195 | 29,937 | ||||||||||||
| Income tax recovery (expense) on change in fair value of investments in marketable securities | 14 | (985 | ) | (31 | ) | (4,006 | ) | ||||||||||
| Actuarial (loss) gain on employee benefit plans | (425 | ) | 235 | (228 | ) | 420 | |||||||||||
| Income tax recovery (expense) on employee benefit plans | 102 | (57 | ) | 55 | (101 | ) | |||||||||||
| Total other comprehensive (loss) income for the period | (394 | ) | 6,611 | (9 | ) | 26,250 | |||||||||||
| Total comprehensive income for the period | $ | 172,275 | $ | 141,415 | $ | 308,398 | $ | 234,587 | |||||||||
| Total comprehensive income (loss) attributable to: | |||||||||||||||||
| Shareholders of the Company | 172,423 | 144,620 | 309,187 | 236,661 | |||||||||||||
| Non-controlling interests | (148 | ) | (3,205 | ) | (789 | ) | (2,074 | ) | |||||||||
| $ | 172,275 | $ | 141,415 | $ | 308,398 | $ | 234,587 | ||||||||||
Condensed Consolidated Interim Statements of Cash Flows | |||||||||||||||||
| For the three and six months ended (Unaudited – in thousands of | |||||||||||||||||
| Three months ended | Six months ended | ||||||||||||||||
| Note | 2026 | 2025 | 2026 | 2025 | |||||||||||||
| Cash flows generated from (used in): | |||||||||||||||||
| Operating activities | |||||||||||||||||
| Net earnings from continuing operations | $ | 172,669 | $ | 138,927 | $ | 308,407 | $ | 213,793 | |||||||||
| Adjustments for: | |||||||||||||||||
| Depreciation and amortization | 54,699 | 66,415 | 109,147 | 127,032 | |||||||||||||
| Finance costs | 11 | 10,166 | 669 | 24,129 | 12,913 | ||||||||||||
| Interest income | 10 | (5,399 | ) | (8,964 | ) | (13,093 | ) | (17,221 | ) | ||||||||
| Share of loss from associate | 219 | — | 355 | — | |||||||||||||
| Unrealized foreign exchange (gain) loss | (8,176 | ) | 18,122 | (28,248 | ) | 24,685 | |||||||||||
| Income tax expense | 12 | 54,502 | 33,295 | 165,509 | 687 | ||||||||||||
| Loss (gain) on disposal of assets | 219 | 229 | 611 | (7,059 | ) | ||||||||||||
| Unrealized (gain) loss on derivative contracts | 10 | (116,636 | ) | (18,740 | ) | (96,599 | ) | 44,650 | |||||||||
| Write-down of assets | 614 | 2,476 | 1,103 | 5,165 | |||||||||||||
| Share-based payments expense | 14 | 2,827 | 4,183 | 6,434 | 8,545 | ||||||||||||
| Employee benefit plan expense | 1,234 | 1,087 | 2,318 | 2,101 | |||||||||||||
| 166,938 | 237,699 | 480,073 | 415,291 | ||||||||||||||
| Property reclamation payments | (1,217 | ) | (1,609 | ) | (2,395 | ) | (2,404 | ) | |||||||||
| Employee benefit plan payments | (602 | ) | (369 | ) | (1,065 | ) | (789 | ) | |||||||||
| Income taxes paid | (67,371 | ) | (42,705 | ) | (199,486 | ) | (90,820 | ) | |||||||||
| Interest received | 5,399 | 8,964 | 13,093 | 17,221 | |||||||||||||
| Changes in non-cash operating working capital | 15 | 46,395 | (43,813 | ) | 715 | (49,921 | ) | ||||||||||
| Net cash generated from operating activities of continuing operations | 149,542 | 158,167 | 290,935 | 288,578 | |||||||||||||
| Net cash generated from operating activities of discontinued operations | — | 118 | — | 309 | |||||||||||||
| Investing activities | |||||||||||||||||
| Additions to property, plant and equipment | (469,607 | ) | (191,195 | ) | (780,914 | ) | (349,690 | ) | |||||||||
| Capitalized interest paid | (22,626 | ) | (10,904 | ) | (31,064 | ) | (20,020 | ) | |||||||||
| Cash from acquisition of Foran Mining Corporation, net of cash paid | 4 | 159,110 | — | 159,110 | — | ||||||||||||
| Proceeds from the sale of property, plant and equipment | 2,381 | 2,882 | 2,381 | 2,980 | |||||||||||||
| Purchase of investment in associate | (14,731 | ) | — | (14,731 | ) | — | |||||||||||
| Value added taxes related to mineral property expenditures, net | (9,207 | ) | (14,357 | ) | 44,716 | (1,051 | ) | ||||||||||
| (Purchase of) sale of investments in marketable securities | (3,121 | ) | — | 37,072 | 155,078 | ||||||||||||
| Increase in deposits and other investments | (3,343 | ) | (3,650 | ) | (8,009 | ) | (9,266 | ) | |||||||||
| Net cash used in investing activities of continuing operations | (361,144 | ) | (217,224 | ) | (591,439 | ) | (221,969 | ) | |||||||||
| Financing activities | |||||||||||||||||
| Issuance of common shares for cash, net of share issuance costs | 1,757 | 5,214 | 3,791 | 7,527 | |||||||||||||
| Net distributions to non-controlling interests | — | (317 | ) | (177 | ) | (317 | ) | ||||||||||
| Proceeds from Term Facility - Commercial loans and RRF loans | 8 | — | 180,610 | — | 180,610 | ||||||||||||
| Proceeds (repayments) from Term Facility - VAT Facility | 8 | — | 11,789 | (35,757 | ) | 9,155 | |||||||||||
| Proceeds from Term Facility - Overrun Facility | 8 | 68,364 | — | 68,364 | — | ||||||||||||
| Proceeds from Credit Facility | 8 | 100,000 | — | 100,000 | — | ||||||||||||
| Proceeds on Equipment Finance Facility, net of repayments | 8 | 2,686 | — | 2,686 | — | ||||||||||||
| Term Facility commitment fees | (474 | ) | (1,372 | ) | (474 | ) | (1,372 | ) | |||||||||
| Dividends paid | (19,588 | ) | — | (34,484 | ) | — | |||||||||||
| Interest paid | (5,524 | ) | (1,965 | ) | (15,446 | ) | (10,427 | ) | |||||||||
| Principal portion of lease liabilities | (1,314 | ) | (1,180 | ) | (2,529 | ) | (2,526 | ) | |||||||||
| Purchase of shares for cancellation | 13 | — | (44,588 | ) | (83,895 | ) | (44,588 | ) | |||||||||
| Purchase of shares held in trust for restricted share units | 13 | (4,191 | ) | (2,416 | ) | (8,683 | ) | (4,226 | ) | ||||||||
| Net cash generated from (used in) financing activities of continuing operations | 141,716 | 145,775 | (6,604 | ) | 133,836 | ||||||||||||
| Effect of exchange rates on cash and cash equivalents | (5,276 | ) | 13,712 | (7,686 | ) | 21,330 | |||||||||||
| Net (decrease) increase in cash and cash equivalents | (75,162 | ) | 100,548 | (314,794 | ) | 222,084 | |||||||||||
| Cash and cash equivalents - beginning of period | 629,724 | 978,142 | 869,356 | 856,797 | |||||||||||||
| Change in cash in disposal group held for sale | — | (118 | ) | — | (309 | ) | |||||||||||
| Cash and cash equivalents - end of period | $ | 554,562 | $ | 1,078,572 | $ | 554,562 | $ | 1,078,572 | |||||||||
Condensed Consolidated Interim Statements of Changes in Equity | ||||||||||||||||
| For the three and six months ended (Unaudited – in thousands of | ||||||||||||||||
| Three months ended | Six months ended | |||||||||||||||
| Note | 2026 | 2025 | 2026 | 2025 | ||||||||||||
| Share capital | ||||||||||||||||
| Balance beginning of period | $ | 3,303,820 | $ | 3,442,250 | $ | 3,341,760 | $ | 3,433,778 | ||||||||
| Shares issued upon exercise of share options | 1,750 | 6,098 | 3,791 | 8,411 | ||||||||||||
| Shares issued upon exercise of performance share units | 3,086 | — | 3,086 | 5,282 | ||||||||||||
| Shares issued upon acquisition of Foran Mining Corporation | 4 | 2,385,625 | — | 2,385,625 | — | |||||||||||
| Transfer of contributed surplus on exercise of options | 962 | 2,307 | 1,666 | 3,184 | ||||||||||||
| Shares repurchased and cancelled, net of tax | 635 | (26,405 | ) | (40,050 | ) | (26,405 | ) | |||||||||
| Share issuance costs | — | (811 | ) | — | (811 | ) | ||||||||||
| Balance end of period | 13 | $ | 5,695,878 | $ | 3,423,439 | $ | 5,695,878 | $ | 3,423,439 | |||||||
| Shares held in trust for restricted share units | ||||||||||||||||
| Balance beginning of period | $ | (16,364 | ) | $ | (12,965 | ) | $ | (16,035 | ) | $ | (12,970 | ) | ||||
| Shares purchased and held in trust for restricted share units | (4,191 | ) | (2,416 | ) | (8,683 | ) | (4,226 | ) | ||||||||
| Shares released for settlement of restricted share units | 1,468 | 6,219 | 5,631 | 8,034 | ||||||||||||
| Balance end of period | 13 | $ | (19,087 | ) | $ | (9,162 | ) | $ | (19,087 | ) | $ | (9,162 | ) | |||
| Contributed surplus | ||||||||||||||||
| Balance beginning of period | $ | 2,492,674 | $ | 2,607,605 | $ | 2,537,197 | $ | 2,612,762 | ||||||||
| Shares repurchased and cancelled | — | (19,074 | ) | (42,907 | ) | (19,074 | ) | |||||||||
| Share-based payment arrangements | 3,488 | 3,042 | 6,739 | 5,859 | ||||||||||||
| Option consideration on acquisition of Foran Mining Corporation | 4 | 3,096 | — | 3,096 | — | |||||||||||
| Shares redeemed upon exercise of restricted share units | (1,468 | ) | (6,219 | ) | (5,631 | ) | (8,034 | ) | ||||||||
| Shares redeemed upon exercise of performance share units | (3,086 | ) | — | (3,086 | ) | (5,282 | ) | |||||||||
| Transfer to share capital on exercise of options | (962 | ) | (2,307 | ) | (1,666 | ) | (3,184 | ) | ||||||||
| Balance end of period | $ | 2,493,742 | $ | 2,583,047 | $ | 2,493,742 | $ | 2,583,047 | ||||||||
| Accumulated other comprehensive (loss) income | ||||||||||||||||
| Balance beginning of period | $ | (30,463 | ) | $ | (27,681 | ) | $ | (11,553 | ) | $ | 56,183 | |||||
| Other comprehensive (loss) income for the period attributable to shareholders of the Company | (394 | ) | 6,611 | (9 | ) | 26,250 | ||||||||||
| Reclassification on derecognition of investments in marketable securities | (445 | ) | — | (19,740 | ) | (103,503 | ) | |||||||||
| Balance end of period | $ | (31,302 | ) | $ | (21,070 | ) | $ | (31,302 | ) | $ | (21,070 | ) | ||||
| Deficit | ||||||||||||||||
| Balance beginning of period | $ | (1,431,302 | ) | $ | (2,017,258 | ) | $ | (1,572,080 | ) | $ | (2,193,163 | ) | ||||
| Dividends paid | (19,588 | ) | — | (34,484 | ) | — | ||||||||||
| Net earnings attributable to shareholders of the Company | 172,817 | 138,009 | 309,196 | 210,411 | ||||||||||||
| Reclassification on derecognition of investments in marketable securities | 445 | — | 19,740 | 103,503 | ||||||||||||
| Balance end of period | $ | (1,277,628 | ) | $ | (1,879,249 | ) | $ | (1,277,628 | ) | $ | (1,879,249 | ) | ||||
| Total equity attributable to shareholders of the Company | $ | 6,861,603 | $ | 4,097,005 | $ | 6,861,603 | $ | 4,097,005 | ||||||||
| Non-controlling interests | ||||||||||||||||
| Balance beginning of period | $ | 2,972 | $ | (7,012 | ) | $ | 3,790 | $ | (8,143 | ) | ||||||
| Loss attributable to non-controlling interests | (148 | ) | (3,205 | ) | (789 | ) | (2,074 | ) | ||||||||
| Net distributions to non-controlling interests | — | (317 | ) | (177 | ) | (317 | ) | |||||||||
| Balance end of period | $ | 2,824 | $ | (10,534 | ) | $ | 2,824 | $ | (10,534 | ) | ||||||
| Total equity | $ | 6,864,427 | $ | 4,086,471 | $ | 6,864,427 | $ | 4,086,471 | ||||||||
______________________
(1) These financial measures or ratios are non-IFRS financial measures or ratios. Certain additional disclosure for non-IFRS financial measures and ratios have been incorporated by reference and additional detail can be found at the end of this news release and in the section 'Non-IFRS and Other Financial Measures and Ratios' in the Company's
(2) See the section "Financial Condition and Liquidity" in the Company's
(3) Gold equivalent ounces: Calculated by converting copper pounds produced into gold equivalent using budgeted commodity prices for the relevant period: 2026-2027:
(4) See the section "Financial Condition and Liquidity - Financing Activities" in the Company's
(5) These financial measures or ratios are non-IFRS financial measures or ratios. Certain additional disclosure for non-IFRS financial measures and ratios have been incorporated by reference and additional detail can be found at the end of this news release and in the section 'Non-IFRS and Other Financial Measures and Ratios' in the Company's
Please see the condensed consolidated interim financial statements dated
Photos accompanying this announcement are available at:
https://www.globenewswire.com/NewsRoom/AttachmentNg/5f9ca339-f82a-48d3-8a3a-d0ce431b1de4
https://www.globenewswire.com/NewsRoom/AttachmentNg/4c69f139-a3b0-4969-bf07-f8aaf49c516e
https://www.globenewswire.com/NewsRoom/AttachmentNg/08be0b6d-fb7f-47b9-ae75-f5fba81ef441
https://www.globenewswire.com/NewsRoom/AttachmentNg/bce4b385-44f2-4d01-a1c7-7311c70ef9f7
https://www.globenewswire.com/NewsRoom/AttachmentNg/0744814d-9f81-4864-8c2d-3fa35bf6436c
https://www.globenewswire.com/NewsRoom/AttachmentNg/cd0b276f-6b86-4a2a-abf1-6123dedca992
https://www.globenewswire.com/NewsRoom/AttachmentNg/d7b2acb9-4b2c-4133-ab82-36e32db3db79
https://www.globenewswire.com/NewsRoom/AttachmentNg/07e42c13-c278-4ad5-ad0e-22ff6d505dfb

Site Layout - Skouries
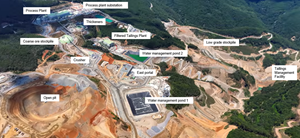
Site Layout - Skouries
Coarse Ore Stockpile Dome - Skouries

Coarse Ore Stockpile Dome - Skouries
Thickeners - Skouries
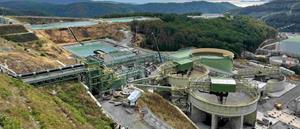
Thickeners - Skouries
Filtered Tailings Plant - Skouries
Filtered Tailings Plant - Skouries
Process Plant Substation - Skouries
Process Plant Substation - Skouries
McIlvenna Bay Site Layout
McIlvenna Bay Site Layout
Tails filtration - McIlvenna Bay
Tails filtration within the process plant - McIlvenna Bay
Underground - McIlvenna Bay