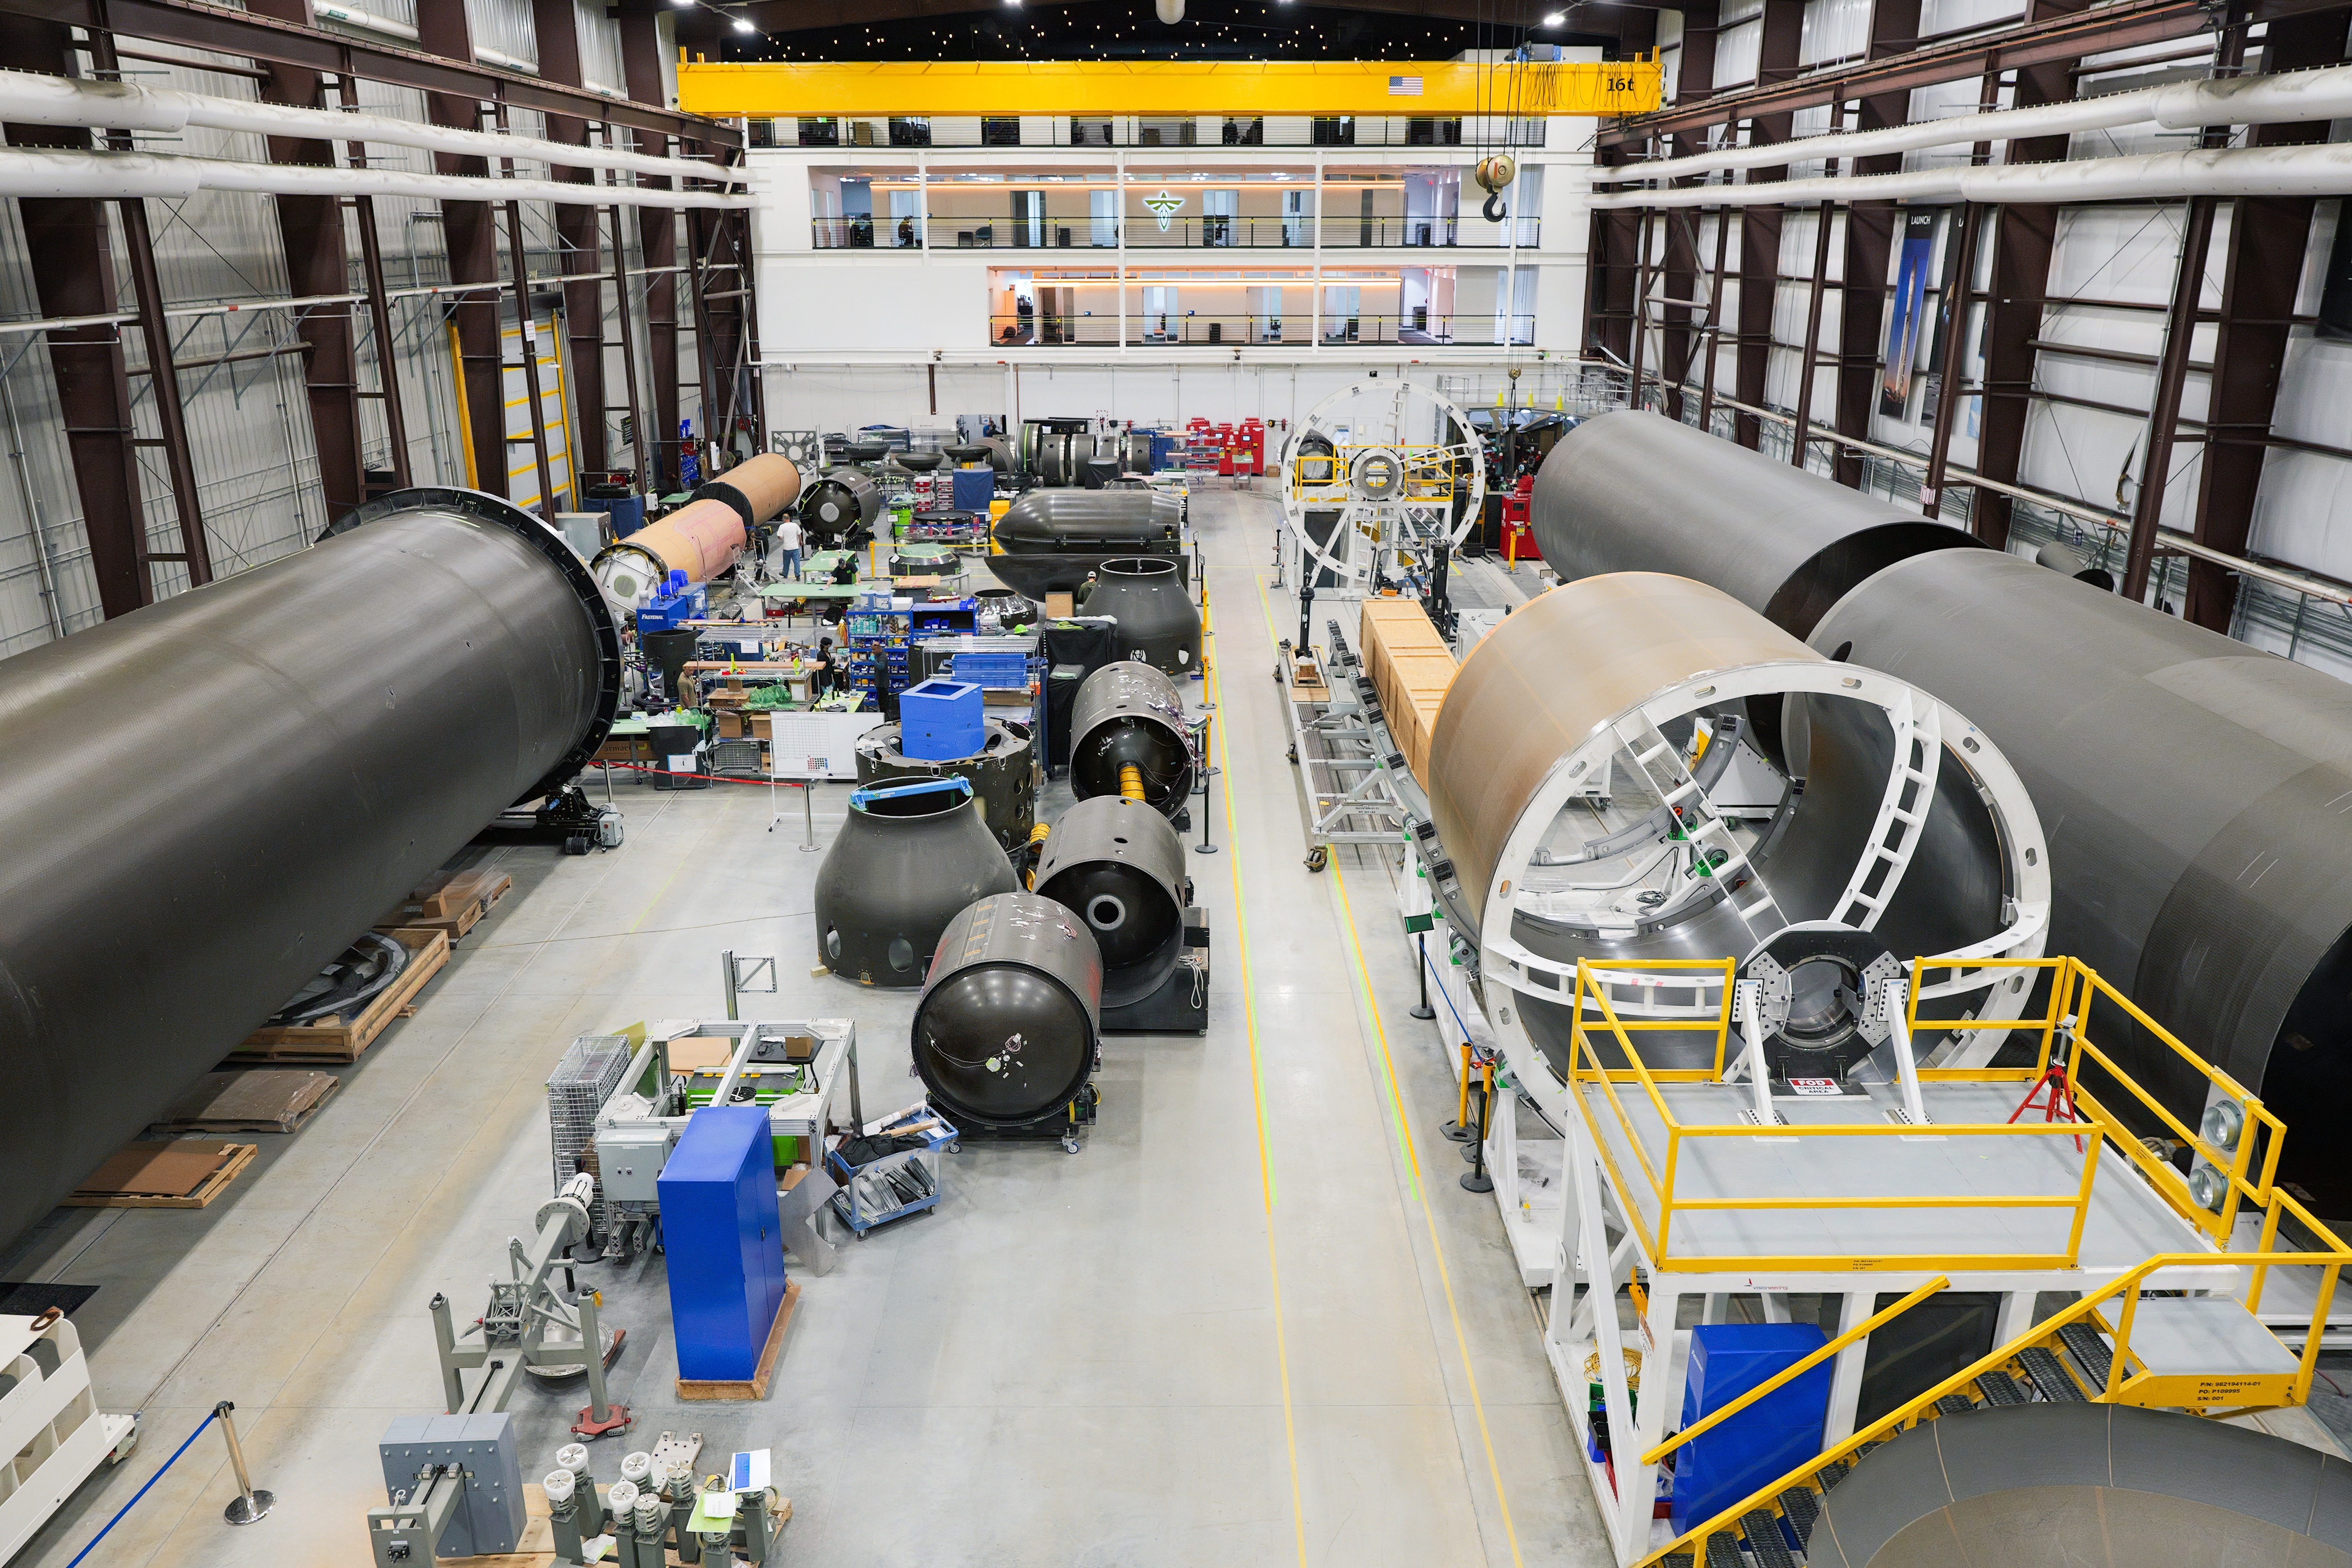
Launch and spacecraft vehicles in assembly at the
"Breaking the
"Firefly is leading the way in unlocking the lunar opportunity, with another two Moon missions added to our manifest during the second quarter," added Kim. "We're also going beyond the Moon to Mars as we support the cutting-edge SkyFall mission for
Second Quarter 2026 Highlights
- Record revenue of
$117.7 million , up 45.5% from the prior quarter. - Awarded a
$144 million NASA Commercial Lunar Payload Services (CLPS) contract for a rapid Blue Ghost lander mission to the Moon, Firefly's sixth contracted lunar mission to date. - Acquired Space-ng, a leader in AI-powered vision navigation and autonomous guidance systems, bringing proven spacecraft software and camera hardware for Firefly’s Blue Ghost landers and Elytra orbital vehicles, which bolsters Firefly’s capabilities to advance the future of autonomous space operations for missions to the Moon, Mars, and beyond.
- Awarded an
Air Force Research Laboratory (AFRL) contract forSciTec to support development of the Advanced Algorithm R&D and Verification Architecture by implementing deep learning and advanced algorithms on small Size, Weight and Power (SWaP) processors to support enhanced target detection, tracking, and custody. - Announced collaboration with NVIDIA to enable rapid on-orbit processing in lunar orbit for Firefly’s Ocula Moon imaging service, utilizing an NVIDIA Jetson module combined with Firefly’s AI software on Elytra to rapidly process data on-orbit.
- Awarded a
$75 million subcontract fromNASA 'sJet Propulsion Laboratory (JPL) to supportNASA 's MoonFall mission, utilizing an Elytra spacecraft to deliver four drones to the Moon’ssouth pole that's targeted to launch no earlier than 2028 in support ofNASA 'sMoon Base initiative. - Completed the Critical Design Review for Blue Ghost's Gruithuisen Domes mission, progressing development of the spacecraft.
- Completed the Preliminary Design Review for Blue Ghost's
South Pole mission, verifying the vehicle's design before production begins. - Awarded
U.S. Air Force contract option worth$5.5 million forSciTec to deliver the operational data fusion system for the Cloud-Based Command and Control (CBC2) program, having participated in a multi-year competition wherein SciTec’s data fusion system was evaluated and selected from among multiple industry and government-owned alternatives. - Completed critical milestones toward Alpha launching from
Sweden's Esrange Space Center , including building initial infrastructure, establishing transatlantic regulatory frameworks, and securing an agreement with theSwedish Defense Materiel Administration . - Signed agreement with Seagate Space to collaborate on the development of an offshore launch platform that enables responsive sea-based Alpha launches.
- Completed underwritten public offering of common stock generating net proceeds of
$181.6 million , to use for expanding core business growth and execution of recently awarded contracts. - Expanded campus with a new headquarters, more than quadrupled spacecraft cleanroom space, added a wing of on-site workstations to support Alpha and Eclipse manufacturing, and established a new Gloworks innovation lab to support accelerated spacecraft production and rapid research and development.
Additional Recent Highlights
- Awarded Firefly's first Mars mission, with a
$13 million subcontract to support the SkyFall mission forNASA JPL, to manufacture, test, and deliver the aeroshell for launch in late 2028, developed by Firefly's Gloworks innovation lab. - Awarded a
$94 million Space Force contract under the Ground-Based Radar Digitization program, to support work overhauling legacy defense systems. - Signed an extension to Lockheed Martin's multi-launch agreement for Alpha flights for up to 25 launches through 2031 using the Block II configuration.
- Crossed 150 hot fire tests to date of Eclipse's Miranda engine, including a flight-like Mission Duty Cycle test that fired for 226 seconds while completing power ratio and mixture ratio sweeps.
- Awarded a second hypersonic task order for Alpha from a confidential customer.
- Onboarded to the
$981 million Space Force IDIQ contract for NITE-STAR – the National Space Test and Training Complex Innovative Technology and Engineering - Space Test andRange Capability Development , to compete for task orders to support advanced test and training operations through 2032.
2026 Full-Year Guidance
- Firefly expects 2026 full-year revenue to be between
$420 million and$450 million .
Conference Call
Firefly will host a conference call today at
The live webcast and accompanying presentation, as well as a replay of the webcast, will be available on Firefly’s Investor Relations website: investors.fireflyspace.com.
About
Cautionary Note Regarding Forward-Looking Statements
This press release contains forward-looking statements (including within the meaning of Section 21E of the United States Securities Exchange Act of 1934, as amended, and Section 27A of the United States Securities Act of 1933, as amended) concerning Firefly. Statements included in this press release that are not statements of historical fact, including statements about our expectations, beliefs, plans, strategies, objectives, prospects, assumptions or future events or performance, are forward-looking statements. Forward-looking statements are inherently subject to risks and uncertainties, some of which cannot be predicted or quantified. In some cases, you can identify forward-looking statements by terminology such as "advance," “anticipate,” “believe,” “continue,” “could,” “estimate,” “expect,” “intend,” “may,” “might,” “objective,” “ongoing,” “plan,” “predict,” “project,” “potential,” “should,” "target," “will,” “would,” or the negative of these terms or other comparable terminology. In particular, our outlook and revenue forecasts for full-year 2026, statements about our programs and innovation, our ability or expectations regarding our partnerships, collaborations and contract wins, our expectations regarding new vehicle launches and launch timelines, and our ability to retain existing customers and maintain their bookings are forward-looking statements.
Various risks that could cause actual results to differ from those expressed by the forward-looking statements included in this press release include, but are not limited to our failure to manage our growth effectively and our ability to achieve and maintain profitability; the potential for delayed or failed launches, and any failure of our launch vehicles and spacecraft to operate as intended; our inability to manufacture our launch vehicles, landers, or orbital vehicles at a quantity and quality that our customers demand; the hazards and operational risks that our products and service offerings are exposed to, including the wide and unique range of risks due to the unpredictability of space; the market for commercial launch services for small- and medium-sized payloads not achieving the growth potential we expect; adverse impacts from current or future disruptions in
Use of Non-GAAP Financial Measures
Adjusted EBITDA, Free Cash Flow,
Firefly believes non-GAAP financial information provides additional insight into the Company’s ongoing performance and liquidity. Therefore, Firefly provides this information to investors for a more consistent basis of comparison and to help them evaluate the Company’s ongoing performance and liquidity and to enable more meaningful period-to-period comparisons.
Adjusted EBITDA
We define Adjusted EBITDA as net loss, adjusted for (benefit) provision for income taxes, interest income, interest expense, depreciation and amortization, stock-based compensation expense, change in fair value of warrant liability, certain one-time costs related to the IPO, transaction-related expenses, gain on settlement of contingent liabilities, and certain other items that are not expected to recur in the future or that management does not view as reflective of the performance of the business. In addition to net loss, we use Adjusted EBITDA to evaluate our business, measure its performance, and make strategic decisions.
We believe that Adjusted EBITDA provides useful information to management, investors, and analysts in assessing our financial performance and results of operations across reporting periods by excluding items we do not believe are indicative of our core operating performance. Net loss is the
Free Cash Flow
We define Free Cash Flow as net cash used in operating activities, adjusted for purchases of property and equipment and internal-use software. We believe that Free Cash Flow is a meaningful indicator of liquidity that provides information to management and investors about the amount of cash generated from or used in operations, after purchases of property and internal-use software, that (after any debt service requirements or other non-discretionary expenditures not otherwise deducted from the measure) can be used for strategic initiatives, including continuous investment in our business and strengthening our balance sheet.
Free Cash Flow has limitations as a liquidity measure, and you should not consider it in isolation or as a substitute for analysis of our cash flows as reported under
We define
Non-GAAP Selling, General, and Administrative
We define Non-GAAP Selling, General and Administrative as selling, general and administrative, adjusted for amortization of acquired intangibles, stock-based compensation expense, certain one-time costs related to the IPO, and transaction-related expenses. Management believes this non-GAAP measure provides investors with meaningful insight into results from ongoing operations by excluding items of income or loss to present it in accordance with how management manages the business.
Non-GAAP Operating Expenses
We define Non-GAAP Operating Expenses as operating expenses, adjusted for amortization of acquired intangibles, stock-based compensation expense, certain one-time costs related to the IPO, and transaction-related expenses. Management believes this non-GAAP measure provides investors with meaningful insight into results from ongoing operations by excluding items of income or loss to present it in accordance with how management manages the business.
Non-GAAP Loss From Operations
We define Non-GAAP Loss From Operations as loss from operations, adjusted for amortization of acquired intangibles, stock-based compensation expense, certain one-time costs related to the IPO, and transaction-related expenses. Management believes this non-GAAP measure provides investors with meaningful insight into results from ongoing operations by excluding items of income or loss to present it in accordance with how management manages the business.
Non-GAAP Other Income (Expense)
We define Non-GAAP Other Income (Expense) as other income (expense), adjusted for change in fair value of warrant liability, gain on settlement of contingent liabilities, and certain other items that are not expected to recur in the future or that management does not view as reflective of the performance of the business. Management believes this non-GAAP measure provides investors with meaningful insight into results from ongoing operations by excluding items of income or loss to present it in accordance with how management manages the business.
Non-GAAP Net Loss
We define Non-GAAP Net Loss as net loss, adjusted for the income tax effect of business acquisitions, amortization of acquired intangibles, stock-based compensation, change in fair value of warrant liability, certain one-time costs related to the IPO, transaction-related expenses, gain on settlement of contingent liabilities, and certain other items that are not expected to recur in the future or that management does not view as reflective of the performance of the business. Management believes this non-GAAP measure provides investors with meaningful insight into results from ongoing operations by excluding items of income or loss to present it in accordance with how management manages the business.
Contacts
Media Relations
press@fireflyspace.com
Investor Relations
investors@fireflyspace.com
CONDENSED CONSOLIDATED STATEMENTS OF NET LOSS AND COMPREHENSIVE LOSS
(unaudited; in thousands, except per share amounts)
| For the Three Months Ended | For the Six Months Ended | |||||||||||||||
| 2026 | 2025 | 2026 | 2025 | |||||||||||||
| Revenue | $ | 117,683 | $ | 15,549 | $ | 198,562 | $ | 71,404 | ||||||||
| Cost of sales | 93,808 | 11,554 | 157,226 | 65,189 | ||||||||||||
| Gross profit | 23,875 | 3,995 | 41,336 | 6,215 | ||||||||||||
| Operating expenses | ||||||||||||||||
| Research and development | 71,532 | 45,774 | 139,041 | 93,786 | ||||||||||||
| Selling, general, and administrative | 47,540 | 12,571 | 93,160 | 25,323 | ||||||||||||
| Total operating expenses | 119,072 | 58,345 | 232,201 | 119,109 | ||||||||||||
| Loss from operations | (95,197 | ) | (54,350 | ) | (190,865 | ) | (112,894 | ) | ||||||||
| Other income (expense), net | ||||||||||||||||
| Change in fair value of warrant liability | (625 | ) | (4,191 | ) | (4,309 | ) | (1,118 | ) | ||||||||
| Interest income | 4,336 | 1,761 | 10,310 | 2,789 | ||||||||||||
| Interest expense | (1,794 | ) | (6,998 | ) | (5,399 | ) | (13,190 | ) | ||||||||
| Gain on settlement of contingent liabilities | 926 | — | 1,307 | — | ||||||||||||
| Other (expense) income, net | — | — | (7 | ) | 542 | |||||||||||
| Total other income (expense), net | 2,843 | (9,428 | ) | 1,902 | (10,977 | ) | ||||||||||
| Loss before (benefit) provision for income taxes | (92,354 | ) | (63,778 | ) | (188,963 | ) | (123,871 | ) | ||||||||
| (Benefit) provision for income taxes | (35 | ) | — | 32 | — | |||||||||||
| Net loss and comprehensive loss | (92,319 | ) | (63,778 | ) | (188,995 | ) | (123,871 | ) | ||||||||
| Less: Accretion of dividends of Series C Preferred Stock | — | (5,363 | ) | — | (10,942 | ) | ||||||||||
| Less: Accretion of dividends of Series D-1 Preferred Stock | — | (10,856 | ) | — | (17,465 | ) | ||||||||||
| Less: Accretion of dividends of Series D-3 Preferred Stock | — | (266 | ) | — | (266 | ) | ||||||||||
| Net loss available to common stockholders | $ | (92,319 | ) | $ | (80,263 | ) | $ | (188,995 | ) | $ | (152,544 | ) | ||||
| Net loss per common share | ||||||||||||||||
| Basic and diluted | $ | (0.57 | ) | $ | (5.78 | ) | $ | (1.18 | ) | $ | (11.17 | ) | ||||
| Weighted-average common shares outstanding | ||||||||||||||||
| Basic and diluted | 161,784 | 13,877 | 160,711 | 13,659 | ||||||||||||
CONDENSED CONSOLIDATED BALANCE SHEETS
(unaudited; in thousands, except per share amounts)
| 2026 | 2025 | |||||||
| Assets | ||||||||
| Current assets | ||||||||
| Cash and cash equivalents | $ | 459,817 | $ | 792,966 | ||||
| Short-term investments | 175,447 | 100,008 | ||||||
| Accounts receivable, net | 58,114 | 46,129 | ||||||
| Advanced payments, current | 71,592 | 12,350 | ||||||
| Contract asset | 19,939 | 3,499 | ||||||
| Other current assets | 14,381 | 8,223 | ||||||
| Total current assets | 799,290 | 963,175 | ||||||
| Advanced payments, less current portion | 10,269 | 60,496 | ||||||
| Property and equipment, net | 186,057 | 163,738 | ||||||
| Right-of-use assets - operating leases | 18,869 | 13,938 | ||||||
| Right-of-use assets - finance leases | 2,919 | 3,735 | ||||||
| Intangible assets, net | 152,286 | 165,709 | ||||||
| 466,984 | 450,119 | |||||||
| Other assets, less current portion | 2,549 | 4,024 | ||||||
| Total assets | $ | 1,639,223 | $ | 1,824,934 | ||||
| Liabilities, temporary equity, and stockholders' equity | ||||||||
| Current liabilities | ||||||||
| Accounts payable | $ | 57,823 | $ | 35,626 | ||||
| Accrued expenses | 52,356 | 42,755 | ||||||
| Accounts payable and accrued expenses – related parties | 1,446 | 330 | ||||||
| Operating lease liability, current | 3,053 | 1,161 | ||||||
| Finance lease liability, current | 1,066 | 1,056 | ||||||
| Deferred revenue, current | 151,174 | 116,135 | ||||||
| Notes payable, current | 7,410 | 7,099 | ||||||
| Other current liabilities | 18,795 | 9,419 | ||||||
| Total current liabilities | 293,123 | 213,581 | ||||||
| Operating lease liability, less current portion | 20,818 | 15,832 | ||||||
| Finance lease liability, less current portion | 1,462 | 2,004 | ||||||
| Deferred revenue, less current portion | 58,365 | 92,565 | ||||||
| Notes payable, less current portion | 19,588 | 281,441 | ||||||
| Warrant liability | 16,604 | 12,294 | ||||||
| Other liabilities, less current portion | 6,338 | 17,278 | ||||||
| Total liabilities | $ | 416,298 | $ | 634,995 | ||||
| Stockholders’ equity | ||||||||
| Common stock, | 17 | 17 | ||||||
| Additional paid-in capital | 2,432,182 | 2,210,201 | ||||||
| Accumulated deficit | (1,209,274 | ) | (1,020,279 | ) | ||||
| Total stockholders’ equity | 1,222,925 | 1,189,939 | ||||||
| Total liabilities and stockholders’ equity | $ | 1,639,223 | $ | 1,824,934 | ||||
CONDENSED CONSOLIDATED STATEMENTS OF CASH FLOWS
(unaudited; in thousands)
| For the Three Months Ended | For the Six Months Ended | ||||||||||||||||
| 2026 | 2025 | 2026 | 2025 | ||||||||||||||
| Cash flows from operating activities | |||||||||||||||||
| Net loss | $ | (92,319 | ) | $ | (63,778 | ) | $ | (188,995 | ) | $ | (123,871 | ) | |||||
| Adjustments to reconcile net loss to net cash used in operating activities: | |||||||||||||||||
| Depreciation and amortization | 13,954 | 3,920 | 29,888 | 7,916 | |||||||||||||
| Stock-based compensation | 17,027 | 760 | 29,539 | 1,191 | |||||||||||||
| Change in fair value of warrant liability | 625 | 4,191 | 4,309 | 5,107 | |||||||||||||
| Gain on settlement of contingent liabilities | (926 | ) | — | (1,307 | ) | — | |||||||||||
| Non-cash interest expense | 490 | 2,971 | 821 | 3,586 | |||||||||||||
| Non-cash interest income | (1,724 | ) | — | (2,361 | ) | — | |||||||||||
| Changes in operating assets and liabilities: | |||||||||||||||||
| Accounts receivable | (13,167 | ) | 9,266 | (11,838 | ) | (4,634 | ) | ||||||||||
| Advanced payments | (9,077 | ) | (2,882 | ) | (8,373 | ) | 38,778 | ||||||||||
| Contract assets | (16,440 | ) | — | (16,440 | ) | — | |||||||||||
| Other assets | 1,558 | (1,472 | ) | (3,145 | ) | (4,238 | ) | ||||||||||
| Accounts payable | 14,253 | (717 | ) | 20,849 | (3,344 | ) | |||||||||||
| Accrued expenses | 4,950 | (3,408 | ) | 9,610 | 2,245 | ||||||||||||
| Accounts payable and accrued expenses - related parties | 865 | 142 | 1,116 | 355 | |||||||||||||
| Other liabilities | (12,866 | ) | (3,301 | ) | (11,344 | ) | (11,190 | ) | |||||||||
| Right-of-use assets | 914 | 564 | 1,846 | 986 | |||||||||||||
| Lease liabilities | (457 | ) | (70 | ) | 876 | (2,063 | ) | ||||||||||
| Deferred revenue | 10,775 | 25,732 | 839 | 4,557 | |||||||||||||
| Net cash used in operating activities | (81,565 | ) | (28,082 | ) | (144,110 | ) | (84,619 | ) | |||||||||
| Cash flows from investing activities | |||||||||||||||||
| Purchases of property and equipment and internal-use software | (24,744 | ) | (9,183 | ) | (41,089 | ) | (11,837 | ) | |||||||||
| Purchases of short-term investments | — | — | (125,000 | ) | — | ||||||||||||
| Payments for acquisitions of businesses, net of acquired cash | (3,699 | ) | — | (3,699 | ) | — | |||||||||||
| Proceeds from sale of short-term investments | 50,000 | — | 50,008 | — | |||||||||||||
| Net cash used in investing activities | 21,557 | (9,183 | ) | (119,780 | ) | (11,837 | ) | ||||||||||
| Cash flows from financing activities | |||||||||||||||||
| Proceeds from issuance of common stock | 184,111 | — | 184,111 | — | |||||||||||||
| Payments of offering costs | (1,502 | ) | — | (1,502 | ) | — | |||||||||||
| Proceeds from issuance of Preferred Stock | — | 68,812 | — | 184,116 | |||||||||||||
| Principal payments on finance leases | (270 | ) | (440 | ) | (532 | ) | (883 | ) | |||||||||
| Payments on notes payable | (2,193 | ) | (1,025 | ) | (3,945 | ) | (3,195 | ) | |||||||||
| Payments of debt issuance costs | (1,188 | ) | (575 | ) | (1,188 | ) | (575 | ) | |||||||||
| Proceeds from repayment of employee note | 5 | 24 | 25 | 383 | |||||||||||||
| Proceeds from issuance of notes payable | 1,730 | (468 | ) | 1,730 | — | ||||||||||||
| Repayment of Revolving Credit Facility | — | — | (260,000 | ) | — | ||||||||||||
| Proceeds from exercise of stock options, net of shares withheld for taxes | 12,953 | 206 | 12,042 | 595 | |||||||||||||
| Net cash (used in) provided by financing activities | 193,646 | 66,534 | (69,259 | ) | 180,441 | ||||||||||||
| Net (decrease) increase in cash and cash equivalents and restricted cash | 133,638 | 29,269 | (333,149 | ) | 83,985 | ||||||||||||
| Cash and cash equivalents and restricted cash | |||||||||||||||||
| Balance, beginning of period | 326,179 | 192,274 | 792,966 | 137,558 | |||||||||||||
| Balance, end of period | $ | 459,817 | $ | 221,543 | $ | 459,817 | $ | 221,543 | |||||||||
| Reconciliation of cash and cash equivalents and restricted cash | |||||||||||||||||
| Cash and cash equivalents | $ | 459,817 | $ | 205,286 | $ | 459,817 | $ | 205,286 | |||||||||
| Restricted cash, current | — | 829 | — | 829 | |||||||||||||
| Restricted cash, non-current | — | 15,428 | — | 15,428 | |||||||||||||
| Total cash and cash equivalents and restricted cash at the end of the period | $ | 459,817 | $ | 221,543 | $ | 459,817 | $ | 221,543 | |||||||||
| For the Three Months Ended | For the Six Months Ended | ||||||||||||||||
| 2026 | 2025 | 2026 | 2025 | ||||||||||||||
| Supplemental disclosures of cash flow information | |||||||||||||||||
| Cash paid for interest | $ | 1,369 | $ | 5,536 | $ | 5,546 | $ | 11,101 | |||||||||
| Non-cash investing and financing activities | |||||||||||||||||
| (Decrease) increase in accounts payable for property and equipment | $ | (831 | ) | $ | (163 | ) | $ | 1,112 | $ | 1,413 | |||||||
| Property and equipment acquired through loans | $ | 642 | $ | — | $ | 642 | $ | — | |||||||||
| Capitalized interest (paid-in-kind) | $ | — | $ | 573 | $ | — | $ | 573 | |||||||||
| Equity issued for business combination | $ | 10,144 | $ | — | $ | 10,144 | $ | — | |||||||||
| Deferred offering costs payable | $ | 1,055 | $ | — | $ | 1,055 | $ | — | |||||||||
| Debt issuance costs incurred but unpaid | $ | 117 | $ | — | $ | 117 | $ | — | |||||||||
| Issuance of debt in exchange of software licenses and obligations | $ | — | $ | 664 | $ | — | $ | 664 | |||||||||
| Acquisition of internal-use software licenses and obligations | $ | 3,110 | $ | — | $ | 3,541 | $ | — | |||||||||
| Right-of-use asset acquired in exchange for operating lease liabilities | $ | — | $ | — | $ | 5,066 | $ | — | |||||||||
| Right-of-use asset acquired in exchange for finance lease liabilities | $ | — | $ | 193 | $ | — | $ | 1,625 | |||||||||
| Non-cash purchase consideration for acquisition of businesses | $ | 5,438 | $ | — | $ | 5,438 | $ | — | |||||||||
RECONCILIATION OF NON-GAAP FINANCIAL MEASURES
(unaudited; in thousands)
The following tables present reconciliations of Adjusted EBITDA, Free Cash Flow,
| For the Three Months Ended | For the Six Months Ended | |||||||||||||||
| 2026 | 2025 | 2026 | 2025 | |||||||||||||
| Net loss | $ | (92,319 | ) | $ | (63,778 | ) | $ | (188,995 | ) | $ | (123,871 | ) | ||||
| Adjusted for: | ||||||||||||||||
| (Benefit) provision for income taxes | (35 | ) | — | 32 | — | |||||||||||
| Interest income | (4,336 | ) | (1,761 | ) | (10,310 | ) | (2,789 | ) | ||||||||
| Interest expense | 1,717 | 6,998 | 5,399 | 13,190 | ||||||||||||
| Depreciation and amortization | 14,309 | 3,920 | 30,762 | 7,916 | ||||||||||||
| Stock-based compensation expense | 17,027 | 760 | 29,539 | 1,191 | ||||||||||||
| Change in fair value of warrant liability | 625 | 4,191 | 4,309 | 5,107 | ||||||||||||
| One-time costs related to the IPO(1) | — | 1,767 | — | 4,220 | ||||||||||||
| Transaction-related expenses | 2,724 | — | 4,633 | — | ||||||||||||
| Gain on settlement of contingent liabilities | (926 | ) | — | (1,307 | ) | — | ||||||||||
| Other(2) | — | — | 15 | — | ||||||||||||
| Adjusted EBITDA | $ | (61,214 | ) | $ | (47,903 | ) | $ | (125,923 | ) | $ | (95,036 | ) | ||||
| For the Three Months Ended | For the Six Months Ended | |||||||||||||||
| 2026 | 2025 | 2026 | 2025 | |||||||||||||
| Net cash used in operating activities | $ | (81,565 | ) | $ | (28,082 | ) | $ | (144,110 | ) | $ | (84,619 | ) | ||||
| Purchases of property and equipment and internal-use software | (24,744 | ) | (9,183 | ) | (41,089 | ) | (11,837 | ) | ||||||||
| Free Cash Flow | $ | (106,309 | ) | $ | (37,265 | ) | $ | (185,199 | ) | $ | (96,456 | ) | ||||
(1) Represents costs incurred related to the IPO that do not meet the direct and incremental criteria per
(2) Other includes loss on foreign exchange.
| For the Three Months Ended | For the Six Months Ended | |||||||||||||||
| 2026 | 2025 | 2026 | 2025 | |||||||||||||
| Research and development | $ | 71,532 | $ | 45,774 | $ | 139,041 | $ | 93,786 | ||||||||
| Stock-based compensation expense | (8,699 | ) | (177 | ) | (14,404 | ) | (295 | ) | ||||||||
| $ | 62,833 | $ | 45,597 | $ | 124,637 | $ | 93,491 | |||||||||
| Selling, general, and administrative | $ | 47,540 | $ | 12,571 | $ | 93,160 | $ | 25,323 | ||||||||
| Amortization of acquired intangibles | (5,000 | ) | — | (10,000 | ) | — | ||||||||||
| Stock-based compensation expense | (8,328 | ) | (583 | ) | (15,135 | ) | (896 | ) | ||||||||
| One-time costs related to the IPO(1) | — | (1,767 | ) | — | (4,220 | ) | ||||||||||
| Transaction-related expenses | (2,724 | ) | — | (4,633 | ) | — | ||||||||||
| Non-GAAP Selling, General, and Administrative | $ | 31,488 | $ | 10,221 | $ | 63,392 | $ | 20,207 | ||||||||
| Operating expenses | $ | 119,072 | $ | 58,345 | $ | 232,201 | $ | 119,109 | ||||||||
| Amortization of acquired intangibles | (5,000 | ) | — | (10,000 | ) | — | ||||||||||
| Stock-based compensation expense | (17,027 | ) | (760 | ) | (29,539 | ) | (1,191 | ) | ||||||||
| One-time costs related to the IPO(1) | — | (1,767 | ) | — | (4,220 | ) | ||||||||||
| Transaction-related expenses | (2,724 | ) | — | (4,633 | ) | — | ||||||||||
| Non-GAAP Operating Expenses | $ | 94,321 | $ | 55,818 | $ | 188,029 | $ | 113,698 | ||||||||
| Loss from operations | $ | (95,197 | ) | $ | (54,350 | ) | $ | (190,865 | ) | $ | (112,894 | ) | ||||
| Amortization of acquired intangibles | 5,000 | — | 10,000 | — | ||||||||||||
| Stock-based compensation expense | 17,027 | 760 | 29,539 | 1,191 | ||||||||||||
| One-time costs related to the IPO(1) | — | 1,767 | — | 4,220 | ||||||||||||
| Transaction-related expenses | 2,724 | — | 4,633 | — | ||||||||||||
| Non-GAAP Loss from Operations | $ | (70,446 | ) | $ | (51,823 | ) | $ | (146,693 | ) | $ | (107,483 | ) | ||||
| Other income (expense) | $ | 2,843 | $ | (9,428 | ) | $ | 1,902 | $ | (10,977 | ) | ||||||
| Change in fair value of warrant liabilities | 625 | 4,191 | 4,309 | 5,107 | ||||||||||||
| Gain on settlement of contingent liabilities | (926 | ) | — | (1,307 | ) | — | ||||||||||
| Other(2) | — | — | 15 | — | ||||||||||||
| Non-GAAP Other Income (Expense) | $ | 2,542 | $ | (5,237 | ) | $ | 4,919 | $ | (5,870 | ) | ||||||
| Net loss | $ | (92,319 | ) | $ | (63,778 | ) | $ | (188,995 | ) | $ | (123,871 | ) | ||||
| Income tax effect of business acquisitions | 128 | — | 128 | — | ||||||||||||
| Amortization of acquired intangibles | 5,000 | — | 10,000 | — | ||||||||||||
| Stock-based compensation | 17,027 | 760 | 29,539 | 1,191 | ||||||||||||
| Change in fair value of warrant liability | 625 | 4,191 | 4,309 | 5,107 | ||||||||||||
| One-time costs related to the IPO(1) | — | 1,767 | — | 4,220 | ||||||||||||
| Transaction-related expenses | 2,724 | — | 4,633 | — | ||||||||||||
| Gain on settlement of contingent liabilities | (926 | ) | — | (1,307 | ) | — | ||||||||||
| Other(2) | — | — | 15 | — | ||||||||||||
| Non-GAAP Net Loss | $ | (67,741 | ) | $ | (57,060 | ) | $ | (141,678 | ) | $ | (113,353 | ) | ||||
| Basic and diluted weighted average shares outstanding | 161,784 | 13,877 | 160,711 | 13,659 | ||||||||||||
| GAAP net loss per share, basic and diluted | $ | (0.57 | ) | $ | (5.78 | ) | $ | (1.18 | ) | $ | (11.17 | ) | ||||
| Non-GAAP net loss per share, basic and diluted | $ | (0.42 | ) | $ | (4.11 | ) | $ | (0.88 | ) | $ | (8.30 | ) | ||||
(1) Represents costs incurred related to the IPO that do not meet the direct and incremental criteria per
(2) Other includes loss on foreign exchange.
A photo accompanying this announcement is available at https://www.globenewswire.com/NewsRoom/AttachmentNg/10346240-51ba-4870-bcfb-a3be90a22d55


Launch and spacecraft vehicles in assembly at the Rocket Ranch , which supports ramped up capacity of carbon composite tanks and structures